
 Open Access Article
 This Open Access Article is licensed under a Creative Commons Attribution-Non Commercial 3.0 Unported Licence
Repurposing of oxazolone chemistry: gaining access to functionalized graphene nanosheets in a top-down approach from graphite†
Giulia
Neri
a,
Angela
Scala
a,
Enza
Fazio
b,
Placido G.
Mineo
 c,
Antonio
Rescifina
d,
Anna
Piperno
*a and
Giovanni
Grassi
a
c,
Antonio
Rescifina
d,
Anna
Piperno
*a and
Giovanni
Grassi
a
aDipartimento di Scienze Chimiche, Università di Messina, Viale Ferdinando Stagno D'Alcontres 31, 98166 Messina, Italy. E-mail: apiperno@unime.it; Fax: +39 090393897; Tel: +39 0906765173
bDipartimento di Fisica e di Scienze della Terra, Università di Messina, V.le F. Stagno d'Alcontres 31, 98166 Messina, Italy
cDipartimento di Scienze Chimiche, Università di Catania, V.le A. Doria 6, 95125 Catania, Italy
dDipartimento di Scienze del Farmaco, Università di Catania, V.le A. Doria 6, 95125 Catania, Italy
First published on 26th August 2015
Abstract
Solvent-free 1,3-dipolar cycloaddition (1,3-DC) reactions between graphite flakes and mesoionic oxazolones were carried out by heating the resulting solid mixture at mild temperatures (70–120 °C). The direct functionalization and delamination of graphite flakes into few layers of graphene nanosheets was confirmed by micro-Raman and X-ray photoelectron spectroscopies, scanning transmission electron microscopy and thermogravimetric analysis. The 1,3-DC reactions of mesoionic dipoles have been investigated with density functional theory to model graphene, exploring three different pathways: center, corner and edge. These theoretical calculations highlighted that the 1,3-DC reaction can proceed both through a concerted mechanism competing with a stepwise one involving a zwitterionic intermediate. The irreversible decarboxylation inherent in the last step justifies the high degree of functionalization experimentally observed, representing the driving force of the process.
1. Introduction
Research into graphene, a single-atom-thick nanomaterial with unprecedented properties, has generated enormous interest during recent years due to its tremendous potential applications,1–5 such as in electronic devices, selective sensors, functional composite materials, solar cells, energy storage or for biomedical use.6–8 Although its excellent properties give graphene great potential, in many practical applications its inertness, zero band gap, and non-dispersibility in solvents weaken its competitive strength in the synthesis of composites, semiconductors, sensors, etc. Moreover, the difficulty to produce high-quality graphene on a large scale limited its practical use. The functionalization of graphene is the key to achieve stable graphene dispersions leading to better processability for new materials, and to assist combination/incorporation with other classes of compounds to produce high-performance multifunctional materials.9,10 The most employed approaches for graphene modification involve the chemistry of graphene oxide11 (GO), especially esterification/amidation reactions at the carboxylic groups and the coupling of diazonium salts to the sp2 network.12,13 Other important approaches to fabricate functionalized graphene materials are 1,3-dipolar cycloaddition (1,3-DC),14,15 the Bingel reaction,16 the Diels–Alder reaction (DA),17,18 among others,19,20 which directly take place on the graphene surface. These synthetic strategies are not devoid of drawbacks due to the low intrinsic reactivity of graphene, which is lower than that of other carbon nanoforms such as fullerene and carbon nanotubes, principally because of the absence of tension in the graphene basal planes. DA is the most investigated cycloaddition process, since Haddon and co-workers have suggested that graphene can be used as either a diene or a dienophile for DA reactions.21 In 2013, for the first time, Seo et al. proposed the DA protocol to access functionalized graphene nanosheets in a top-down approach starting directly from graphite.22 More recently, modifications of graphite/graphene by DA reactions have been carried out using alternative protocols such as solvent-free processes23 and the retro-DA reaction.24To date, only the 1,3-DC reactions of azomethine ylides have been thoroughly investigated for the chemical manipulation of graphene,14,15 and no examples of graphite/graphene functionalization by mesoionic compounds such as 1,3-dipoles have been reported.
Oxazolones are versatile precursors in organic synthesis for the preparation of structurally complex amino acids and highly substituted heterocycles.25,26 Oxazolones may act as electronic acceptors through C5 or C2, as carbanions by deprotonation at C4, and also like mesoionic systems containing an azomethine ylide dipole. Their reactivity as dipoles was exploited to functionalize carbon nanomaterials such as [60]fullerene and multiwalled carbon nanotubes (MWCNTs) (Fig. 1).
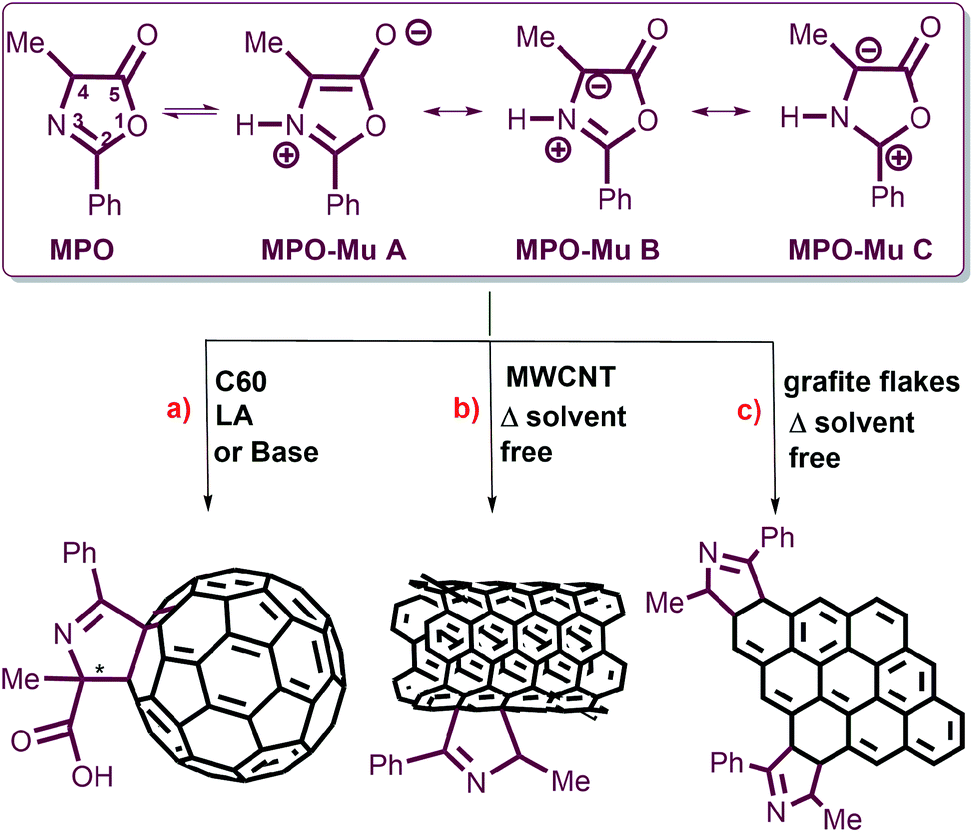 | ||
| Fig. 1 Models of the molecular structures of 4-methyl-2-phenyl oxazol-5-(4H)-one (MPO) and its Mu tautomers, and their 1,3-DC reactions. (a) Schematic representation of the enantioselective cycloaddition of MPO-Mu onto C60 under organocatalysis or LA metal catalysis. (b) 1,3-DC reaction between MPO-Mu and MWCNTs. (c) 1,3-DC of MPO-Mu with graphite flakes (GFs) reported herein. | ||
The tautomerization of oxazol-5-(4H)-one into its reactive mesoionic form (münchnone, Mu) has been promoted by heating, Lewis acidic (LA) conditions and basic catalyst (Fig. 1).27,28
As a part of an ongoing program aimed at the functionalization of carbon nanomaterials, we focused our interest on the direct delamination and functionalization of graphite into graphene, exploiting the reactivity of oxazolones under heating in solvent-free conditions. 4-Methyl-2-phenyl oxazolone (MPO) and 4-methyl-2-p-nitrophenyl oxazolone (MNPO) were selected as oxazolone substrates for their capability to react in solid–solid conditions.28 Under heating, the isomerisation of oxazolones to münchnones triggers the cycloaddition process with the successive domino reactions of decarboxylation and final dehydration of the 1![[thin space (1/6-em)]](https://www.rsc.org/images/entities/char_2009.gif) :1 adduct.27,28 We suppose that these features may be suited for the activation of graphite in a solid–solid 1,3-DC reaction without the mechanical, thermal or chemical activation required in DA approaches.22–24
:1 adduct.27,28 We suppose that these features may be suited for the activation of graphite in a solid–solid 1,3-DC reaction without the mechanical, thermal or chemical activation required in DA approaches.22–24
By comparing the results of our 1,3-DC reaction with literature DA methods, the top-down approach applied in this work is mild (70–120 °C vs. 160–220 °C) and leads to the efficient production of functionalized graphene nanosheets with a high degree of functionalization (2.1–4.6%). The structure, morphology and chemical composition of functionalized graphene materials were investigated by micro-Raman and X-ray photoelectron (XPS) spectroscopies, scanning transmission electron microscopy (STEM), and thermogravimetric analysis (TGA).
To shed light into this extraordinary reactivity and to predict the products and reaction sites, an atomic scale investigation of graphene functionalization with MPO was performed using DFT calculations.
2. Experimental section
2.1. Materials
Graphite flakes (GFs), solvents and other reagents were purchased from Sigma Aldrich. MPO and MNPO were synthesized according to literature procedures.29 Melting points were determined on a Kofler melting apparatus and are uncorrected. Merck Kieselgel 60F254 plates were used for TLC and Merck silica gel 60 (0.063–0.100 mm) for column flash chromatography.2.2. Synthesis of G-MPO and G-MNPO
:1, 3 × 50 mL) and each time sonicated for 10 min and separated from the supernatant by centrifugation at 3500 rpm for 20 min. The effective elimination of unreacted dipole was monitored by NMR analysis of washing solvents. The residue was dried at 60 °C to give 50 mg of G-MPO1. From TGA analysis under a N2 atmosphere, the amount of cycloadduct grafted to graphene was estimated to be ∼3.5% wt.
2.3. Characterization techniques
1H-NMR spectra were obtained with a Varian 500 MHz spectrometer. The Fourier Transform Infrared (FTIR, Perkin Elmer Spectrum 100) spectra were collected, in Attenuated Total Reflectance (ATR) configuration, from 4000 to 450 cm−1. The chemical composition and the bonding configurations of the samples were also investigated by means of XPS. The spectra were acquired at room temperature using a Thermo Scientific K-Alpha system, equipped with a monochromatic Al Kα source (1486.6 eV) and an hemispherical analyser operating in constant-pass energy (CAE) mode. The pass energy was set at 200 eV for survey scans and at 50 eV for the XPS core level spectra. A spot size diameter of about 400 μm was adopted while surface charging effects were avoided using an electron flood gun. Raman spectra were carried out, in air at room temperature, using a Horiba XploRA spectrometer equipped with a confocal microscope and a Peltier-cooled charge-coupled detector (CCD). The samples were excited using the 638 nm line from a solid state laser and integrated for 50 s, using a 50× microscope objective. In order to prevent laser-induced damage or heating, measurements were carried out using a low laser power (2.5 mW on the illuminated area of 2.0 μm2).Spectra from several random positions on each specimen were collected on account of the possible spatial non-homogeneity of the samples. To ensure reproducibility, experiments were performed in triplicate.
The morphology of graphene samples was analyzed using the Zeiss-Gemini 2 scanning electron microscope, operating, in transmission mode, at 30 kV and at a working distance of 4 mm. Some drops of the sample, dispersed in isopropanol (≅0.5 mg mL−1) using the Sonics VCX 130 ultrasonic sonicator, were deposited on a 400 mesh holey carbon coated copper grid and left to dry at room temperature for 3 h. TGA experiments were performed by means of Perkin-Elmer Pyris TGA7, in the temperature range 50–800 °C. About 5 mg of each sample was firstly placed in an platinum pan and kept at 25 °C under a 60 mL min−1 N2 flow until balance stabilization, and subsequently heated with a scan rate of 10 °C min−1 under the same N2 flux. The balance sensitivity was 0.1 μg. A baseline recorded in the same measurement conditions with an empty platinum pan was subtracted from each thermogram before data analysis.
2.4. Computational details
Geometry optimizations of the critical points (reactants, transition structures and products) were studied at the (U)M06-2X level of theory.31,32 For each geometry studied, calculation of harmonic vibrational frequencies was carried out at the same level of theory, with the aim to characterize all structures as minima or transition states. For the minima all the wavenumbers obtained are positive, whereas transition state structures were found to have only one negative eigenvalue with the corresponding eigenvector involving the formation of the newly created bonds. Vibrational frequencies were calculated (1 atm, 298.15 K) for all optimized structures, at the (U)M06-2X/6-31G(d) level of theory, and used, unscaled, to compute both ZPVE and thermal corrections at 298 K. The enthalpy and entropy changes were calculated from standard statistical thermodynamic formulas.33 The intrinsic reaction coordinates34,35 (IRC analysis) were also calculated to analyse the mechanism in detail for all the transition structures obtained at the same level of theory. All the optimizations were carried out by Berny's analytic gradient method36 included in the Gaussian 09 software package.37 In all cases, full geometry optimization was carried out without any symmetry constraints. The electronic structures of critical points were studied by the natural bond orbital38 (NBO) method as implemented in the Gaussian 09 suite.3. Results and discussion
3.1. Chemistry
All 1,3-DC reactions were performed in solvent-free conditions in a closed and sealed system using a glass ampoule at mild temperatures (70–120 °C) (Fig. 2). Moreover, the reactions were carried out under different experimental conditions, such as different graphite/dipole weight ratios (w/w), different reaction temperatures and with or without sonication (Table 1). To increase the efficiency of 1,3-DC, GFs and MPO or MNPO were firstly triturated in a mortar into a fine powder. In the first experiment the reaction was performed at 80 °C with a 1:10 GF/MPO weight ratio for 12 h (Table 1, entry 1). In order to completely remove the unreacted dipole, the reaction mixture was washed in sequence with different solvents, each time being sonicated and separated from the supernatant by centrifugation. The solid was then dried to constant weight under vacuum at 50 °C and characterized. The graphene functionalization degree (loading%) was estimated in terms of weight loss by TGA upon heating a solid reaction product from 100 °C to 700 °C under N2 atmosphere (Fig. 3).
 | ||
| Fig. 2 Schematic representation of the solvent-free 1,3-DC reaction of MPO and MNPO on GFs. | ||
| Entry | Experimental conditions | Sample | C 1s | N 1s | O 1s |
|---|---|---|---|---|---|
| a ))) = sonication. | |||||
| 1 | GF/MPO = 1/10, 80 °C, 12 h | G-MPO1 | 95.01 | 0.55 | 4.44 |
| 2 | GF/MPO = 1/10, 6 h )))a 70 °C; 120 °C, 12 h | G-MPO2 | 95.08 | 0.26 | 4.66 |
| 3 | GF/MNPO = 1/2, 6 h ))) 70 °C; 120 °C, 12 h | G-MNPO1 | 82.92 | 1.61 | 15.47 |
| 4 | GF/MNPO = 1/10, 6 h ))) 70 °C; 120 °C, 12 h | G-MNPO2 | 85.11 | 1.75 | 13.15 |
| 5 | GF | 88.38 | 0.00 | 11.62 | |
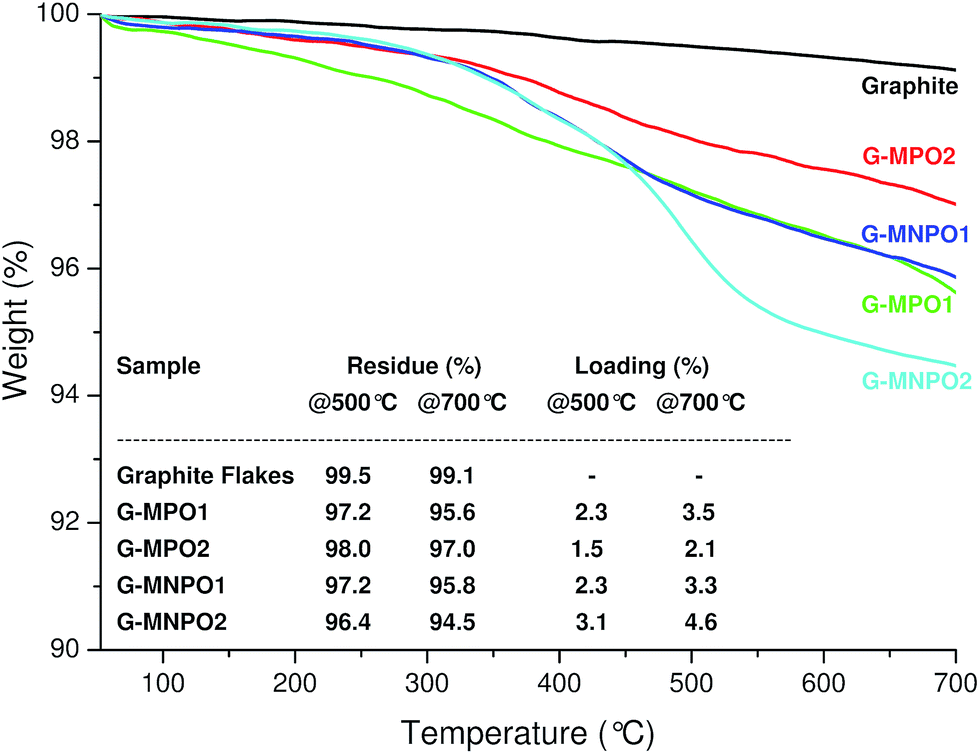 | ||
| Fig. 3 TGA profiles of GFs, G-MPO1, G-MPO2, G-MNPO1, and G-MNPO2, under a N2 atmosphere. The inserted table reports the values, at 500 °C and 700 °C, of weight residue (%) and loading (%). | ||
3.2. TGA characterization
Compared to GFs, the TGA thermogram of G-MPO1 showed a large weight loss in the range 300–700 °C with loadings of 2.3% and 3.5% at 500 °C and 700 °C, respectively. The thermal stability of G-MPO1 at low temperature is unambiguous evidence of covalent grafting of organic groups on graphene sheets, ruling out the presence of adsorbed organic compounds (the TGA thermogram of a physical mixture GF/MPO showed a large weight loss in the range 200–300 °C, data not shown). Moreover, the absence of adsorbed organic material was confirmed by the disappearance of characteristic azlactone absorption at 1818 cm−1 in the IR spectra (data not shown). In order to facilitate the exfoliation of graphite and the efficiency of the 1,3-DC process, the reaction mixture was subjected to sonication at 70 °C for 6 hours and then heated at 120 °C for 12 hours (Table 1, entries 2–4). We expected that the combined effects of temperature and sonication would promote the intercalation of oxazolones into graphite, expanding the graphite basal spacing and opening avenues for the penetration of dipoles into the graphite crystals. The TGA profiles of G-MPO2, G-MNPO1, and G-MNPO2 revealed that the loading values were good for all experiments, but no significant improvement in the efficiency of 1,3-DC was detected (Fig. 3). The efficiency of the 1,3-DC reaction was also maintained in the case of oxazolone MNPO, despite its higher melting point with respect to MPO. The 1,3-DC reaction of MNPO with GFs (Table 1, entry 4) showed good efficiency (4.5%@700 °C, see table inserted in Fig. 3). The loading was well preserved when lowering the graphite/dipole weight ratio from 1:10 to 1:2 (3.3%@700 °C, see table inserted in Fig. 3).
3.3. XPS analysis
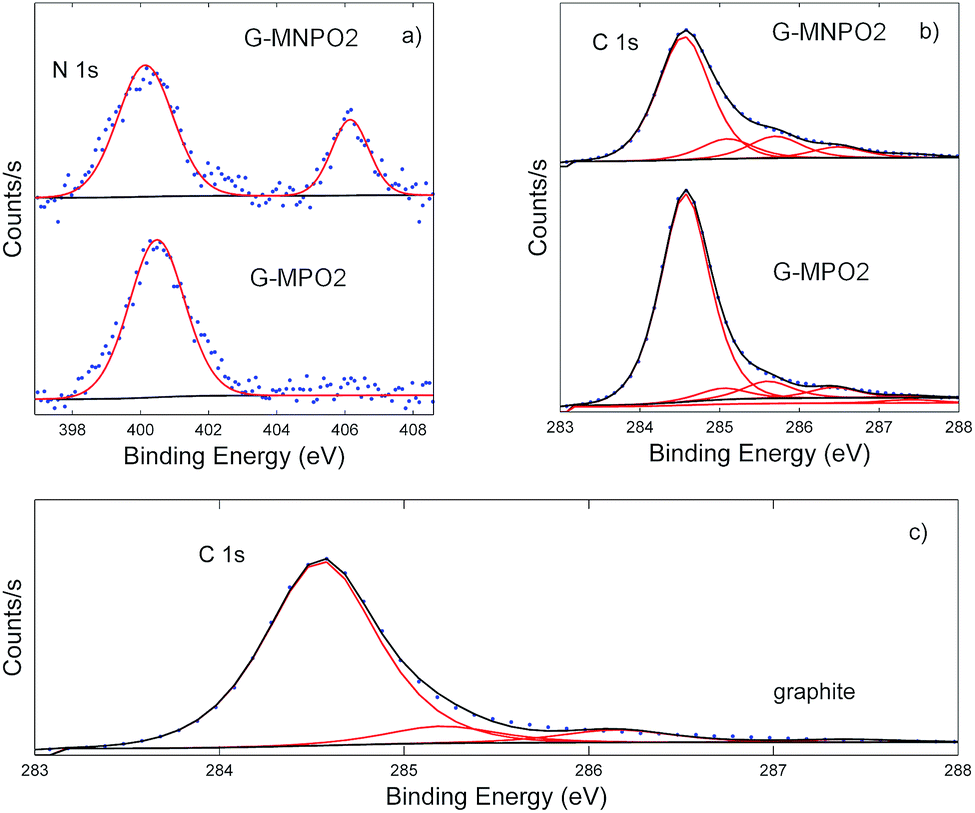
Information about the types of functional groups grafted on the graphene surfaces was obtained by carrying out XPS analysis. The XPS results show that the graphene nanomaterials have different C, O and N contents on the basis of the amount of oxazolone used (G-MPO series vs. G-MNPO series, Table 1). The XPS data of the G-MPO2 and G-MNPO2 samples, obtained in the same experimental conditions, were compared and discussed.In particular, G-MNPO2 exhibits relatively high amounts of N (1.75%) and O (13.15%) as well as a lower C content (85.11%) with respect to graphite (0.00% N, 11.62% O, and 88.38% C) and the G-MPO2 sample (0.26% N, 4.66% O, and 95.08% C).
As shown in Fig. 4, a change in the N 1s high-resolution profiles occurs due to the additional presence of the nitro group, absent in G-MPO2. The sample G-MNPO2 is dominated by two peaks at about 400 and 407 eV, representative of the formation of the C![[double bond, length as m-dash]](https://www.rsc.org/images/entities/char_e001.gif) N functionality and of aromatic nitro groups, respectively. Otherwise, the G-MP02 sample is characterized by only the contribution at 400 eV. Going from the sample G-MP02 to G-MNP02, the expected increase in the contribution centered at about 407 eV is observed (from 0% up to 28%). This behavior is accompanied by the decrease of the CN percentage (from 100% down to 72%).
N functionality and of aromatic nitro groups, respectively. Otherwise, the G-MP02 sample is characterized by only the contribution at 400 eV. Going from the sample G-MP02 to G-MNP02, the expected increase in the contribution centered at about 407 eV is observed (from 0% up to 28%). This behavior is accompanied by the decrease of the CN percentage (from 100% down to 72%).
 | ||
| Fig. 4 N 1s and C 1s photoelectron deconvoluted lineshapes. | ||
The C 1s bands were deconvoluted using six contributions: a main contribution at 284.5 eV attributed to CC/C–C in the aromatic ring and four other contributions at higher binding energies corresponding to carbon atoms bonded to nitrogen (C–N) and oxygen in different surface functionalities (C–OH, C–O, CO) centred at 285.2, 286.3, 288.7, and 288.9 eV, respectively (Fig. 4). The contribution at about 291.0 eV refers to π–π* bonds. The G-MPO2 and G-MNPO2 samples show only slight differences in terms of carbon-oxidized phases while, as expected, the percentage corresponding to C–N bonds increases in the G-MNPO2 sample (see Table 2).
| C 1s | CC |
C–H | C–N | C–O | CO |
π–π |
|---|---|---|---|---|---|---|
| Graphite | 85.0 | 7.7 | 0.0 | 5.9 | 1.3 | 0.1 |
| G-MPO2 | 83.4 | 4.6 | 6.8 | 4.3 | 0.8 | 0.1 |
| G-MNPO2 | 68.5 | 11.0 | 12.2 | 6.0 | 2.0 | 0.3 |
3.4. STEM analysis
Direct evidence of the effective occurrence of the exfoliation process was given by STEM analysis. All the samples showed homogeneously distributed exfoliated graphene layers.In several portions of the samples, various-dimensional transparent sheets stacked onto each other were observed, indicating the efficient functionalization and exfoliation of pristine graphite (whose morphology is shown in Fig. 5a) into a few layers of graphene nanosheets (Fig. 5b). Moreover, folded sheets were also observed (Fig. 5c). A thicknesses of about 2–3 nm was estimated in the G-MNPO samples (see Fig. S2, ESI†).
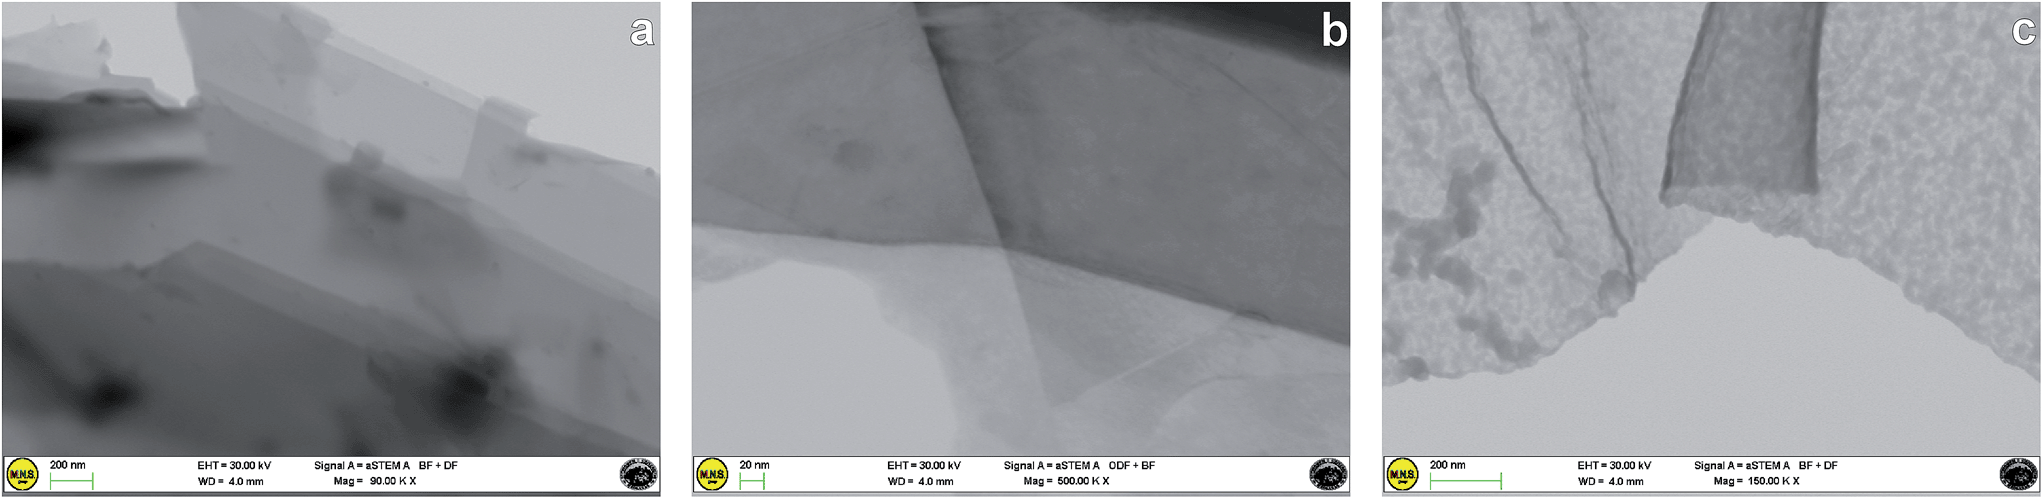 | ||
| Fig. 5 STEM images of (a) graphite, (b) few layers of graphene nanosheets in the G-MPO2 sample and (c) folded graphene sheet in the G-MNPO sample. | ||
3.5. Raman spectroscopy investigations
The structures of G-MPO and G-MNPO were further investigated by micro-Raman spectroscopy. Since this probes a region much larger than that investigated by STEM, it is more representative of the overall sample structure. A comparison of all the Raman spectra is reported in Fig. 6. The spectra have been normalized to better reveal the band profile changes. The graphene-based materials show, in the 1100–3000 cm−1 spectral region, four main peaks: structural imperfections due to the nanographene platform functionalization, D band (1350 cm−1); the primary in-plane vibrational G mode (at about 1580 cm−1); the G* band, which appears in the 2400–2450 cm−1 region of the spectra; and the second-order overtone 2D mode (at about 2690 cm−1). The G* band is interpreted as a combination of a transverse optical and longitudinal acoustic phonon mode near the K-point. This band results from double resonance Raman scattering processes and it is commonly denoted as D + D′′.39 Firstly, one can use Raman spectra to characterize the level of disorder in the samples, using the ID/IG peak intensities ratio. The estimated values are below 0.5, with no appreciable variation between the samples, indicating that the functionalization has a limited effect on the pristine graphite structure. The same behaviour is observed for the G mode peak position, which is located at about 1580 cm−1 for all the samples, with no shift.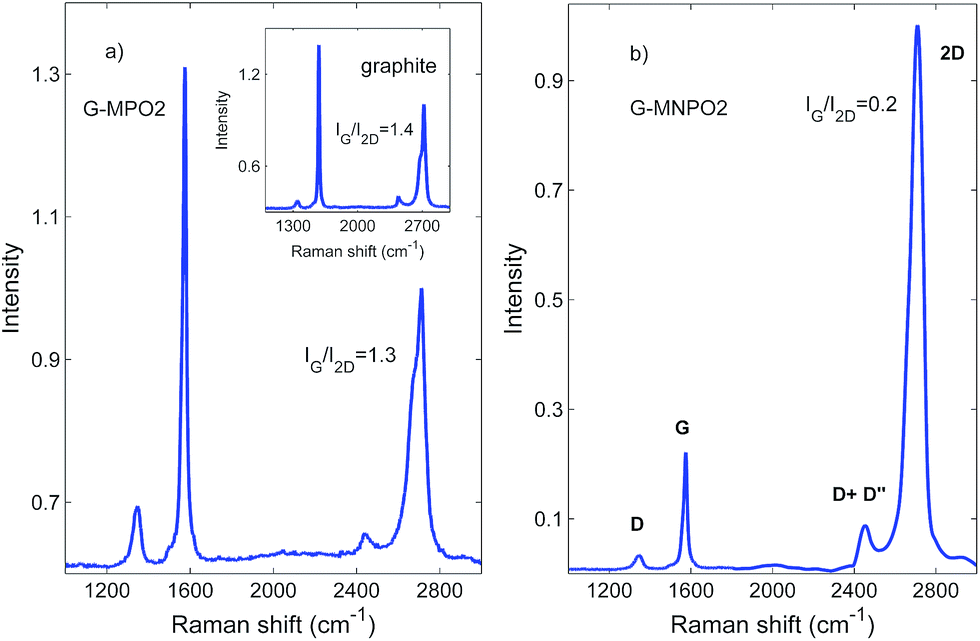 | ||
| Fig. 6 Raman spectra of GFs (inset), G-MPO2 and G-MNPO2. | ||
On the other hand, information about the number of graphene layers can be derived from the IG/I2D peak intensities ratio, as well as their positions and shapes. In fact, because of added forces from the interactions between the graphene layers, the Raman spectrum will change from that of single-layer graphene, namely a splitting of the 2D peak, into an increasing number of modes that can combine to give a wider, down-shifted, peak. Thus, the 2D band splitting of the G-MPO2 sample indicates the presence of several (at least four) graphene layers. At variance, the G-MNPO2 sample shows a single, almost symmetric 2D peak located at 2710 cm−1, with a full width half maximum of about 65 cm−1, i.e., in an intermediate position with respect to the 2D1 (2683 cm−1) and 2D2 (2718 cm−1) peak positions of the bulk graphite. Interestingly, the G-MNPO2 sample presents a IG/I2D ratio value of 0.2, significantly lower than both the GF and G-MPO2 samples (1.5–1.4). The IG/I2D ratio value, the barely visible occurrence of the D band and the almost symmetric 2D band lineshape point out that the G-MNPO2 sample exfoliation process is rather effective for obtaining single-layer-like functionalized graphene. In the other sample, Raman data suggest a simple delamination into multiple (albeit few) layers of functionalized graphene nanosheets. All these pieces of evidence are in good agreement with literature data.40–42
3.6. Computational studies
To further investigate the 1,3-DC reaction of Mu to GFs, and to rationalize and shed light on the obtained results, we explored the reactivity of MPO-Mu, chosen as a model, by first-principles calculations within the DFT framework. Graphene sheets were simulated by C70H22 polybenzenoid hydrocarbons consisting of 25 fused benzene rings (five in a row and five in a line), terminated by hydrogen atoms, presenting zigzag shape edges (Fig. 2).Houk et al. demonstrated that this 5 × 5 finite-sized model provides reliable energetics for both interior and peripheral bonds and represents a good compromise for computational investigations.14 Although there are many types of double bonds in large graphene systems, we explored only three of them, defined as corner (a), centre (b), and edge (c) (onwards defined as pathways a–c) (Fig. 2).
Because graphenes have a polyradical character and graphene models are more stable as open-shell singlet states,44–46 we performed unrestricted DFT calculations at the M06-2X level of theory, which gives a mean error of 0.8 kcal mol−1 with respect to the very well-performing CCSD(T) method,47 with the 6-31G(d) basis set. Single point energy calculations were subsequently carried out on the optimized structures, at the same level of theory, with the larger basis set 6-311G(d,p). Ideally, the two zigzag double bonds a and c are indistinguishable when the graphene model approaches infinity but, because of the simplified model, the 1,3-DC reaction on these two bonds differs in reactivity. Moreover, for the same reason, the double bonds b and c can lead to two regioisomeric products, but we have only considered the formation of a single regioisomer, choosing, especially for b, the one with less steric hindrance.48 At the same time, we have considered only the exo approach because refined computational results showed that it is the preferred one.49 However, preliminary computational studies conducted by us on pyrene (the simplest 2 × 2 model) confirmed both regio- and exo/endo selectivities adopted here (unpublished results). Finally, since Denis found that the presence of Stone–Wales translocations, 585 double vacancies, and 555–777 reconstructed double vacancies did not significantly change graphene reactivity,18 we have not considered the defects of graphene.
All transition state (TS-a–c), intermediate (I-a–c), and product structures (G-MPO-a,c) have been reported in Fig. 7 and 8, whereas their energetic and charge parameters have been summarized in Table 3, Fig. 9, and Table S1.†
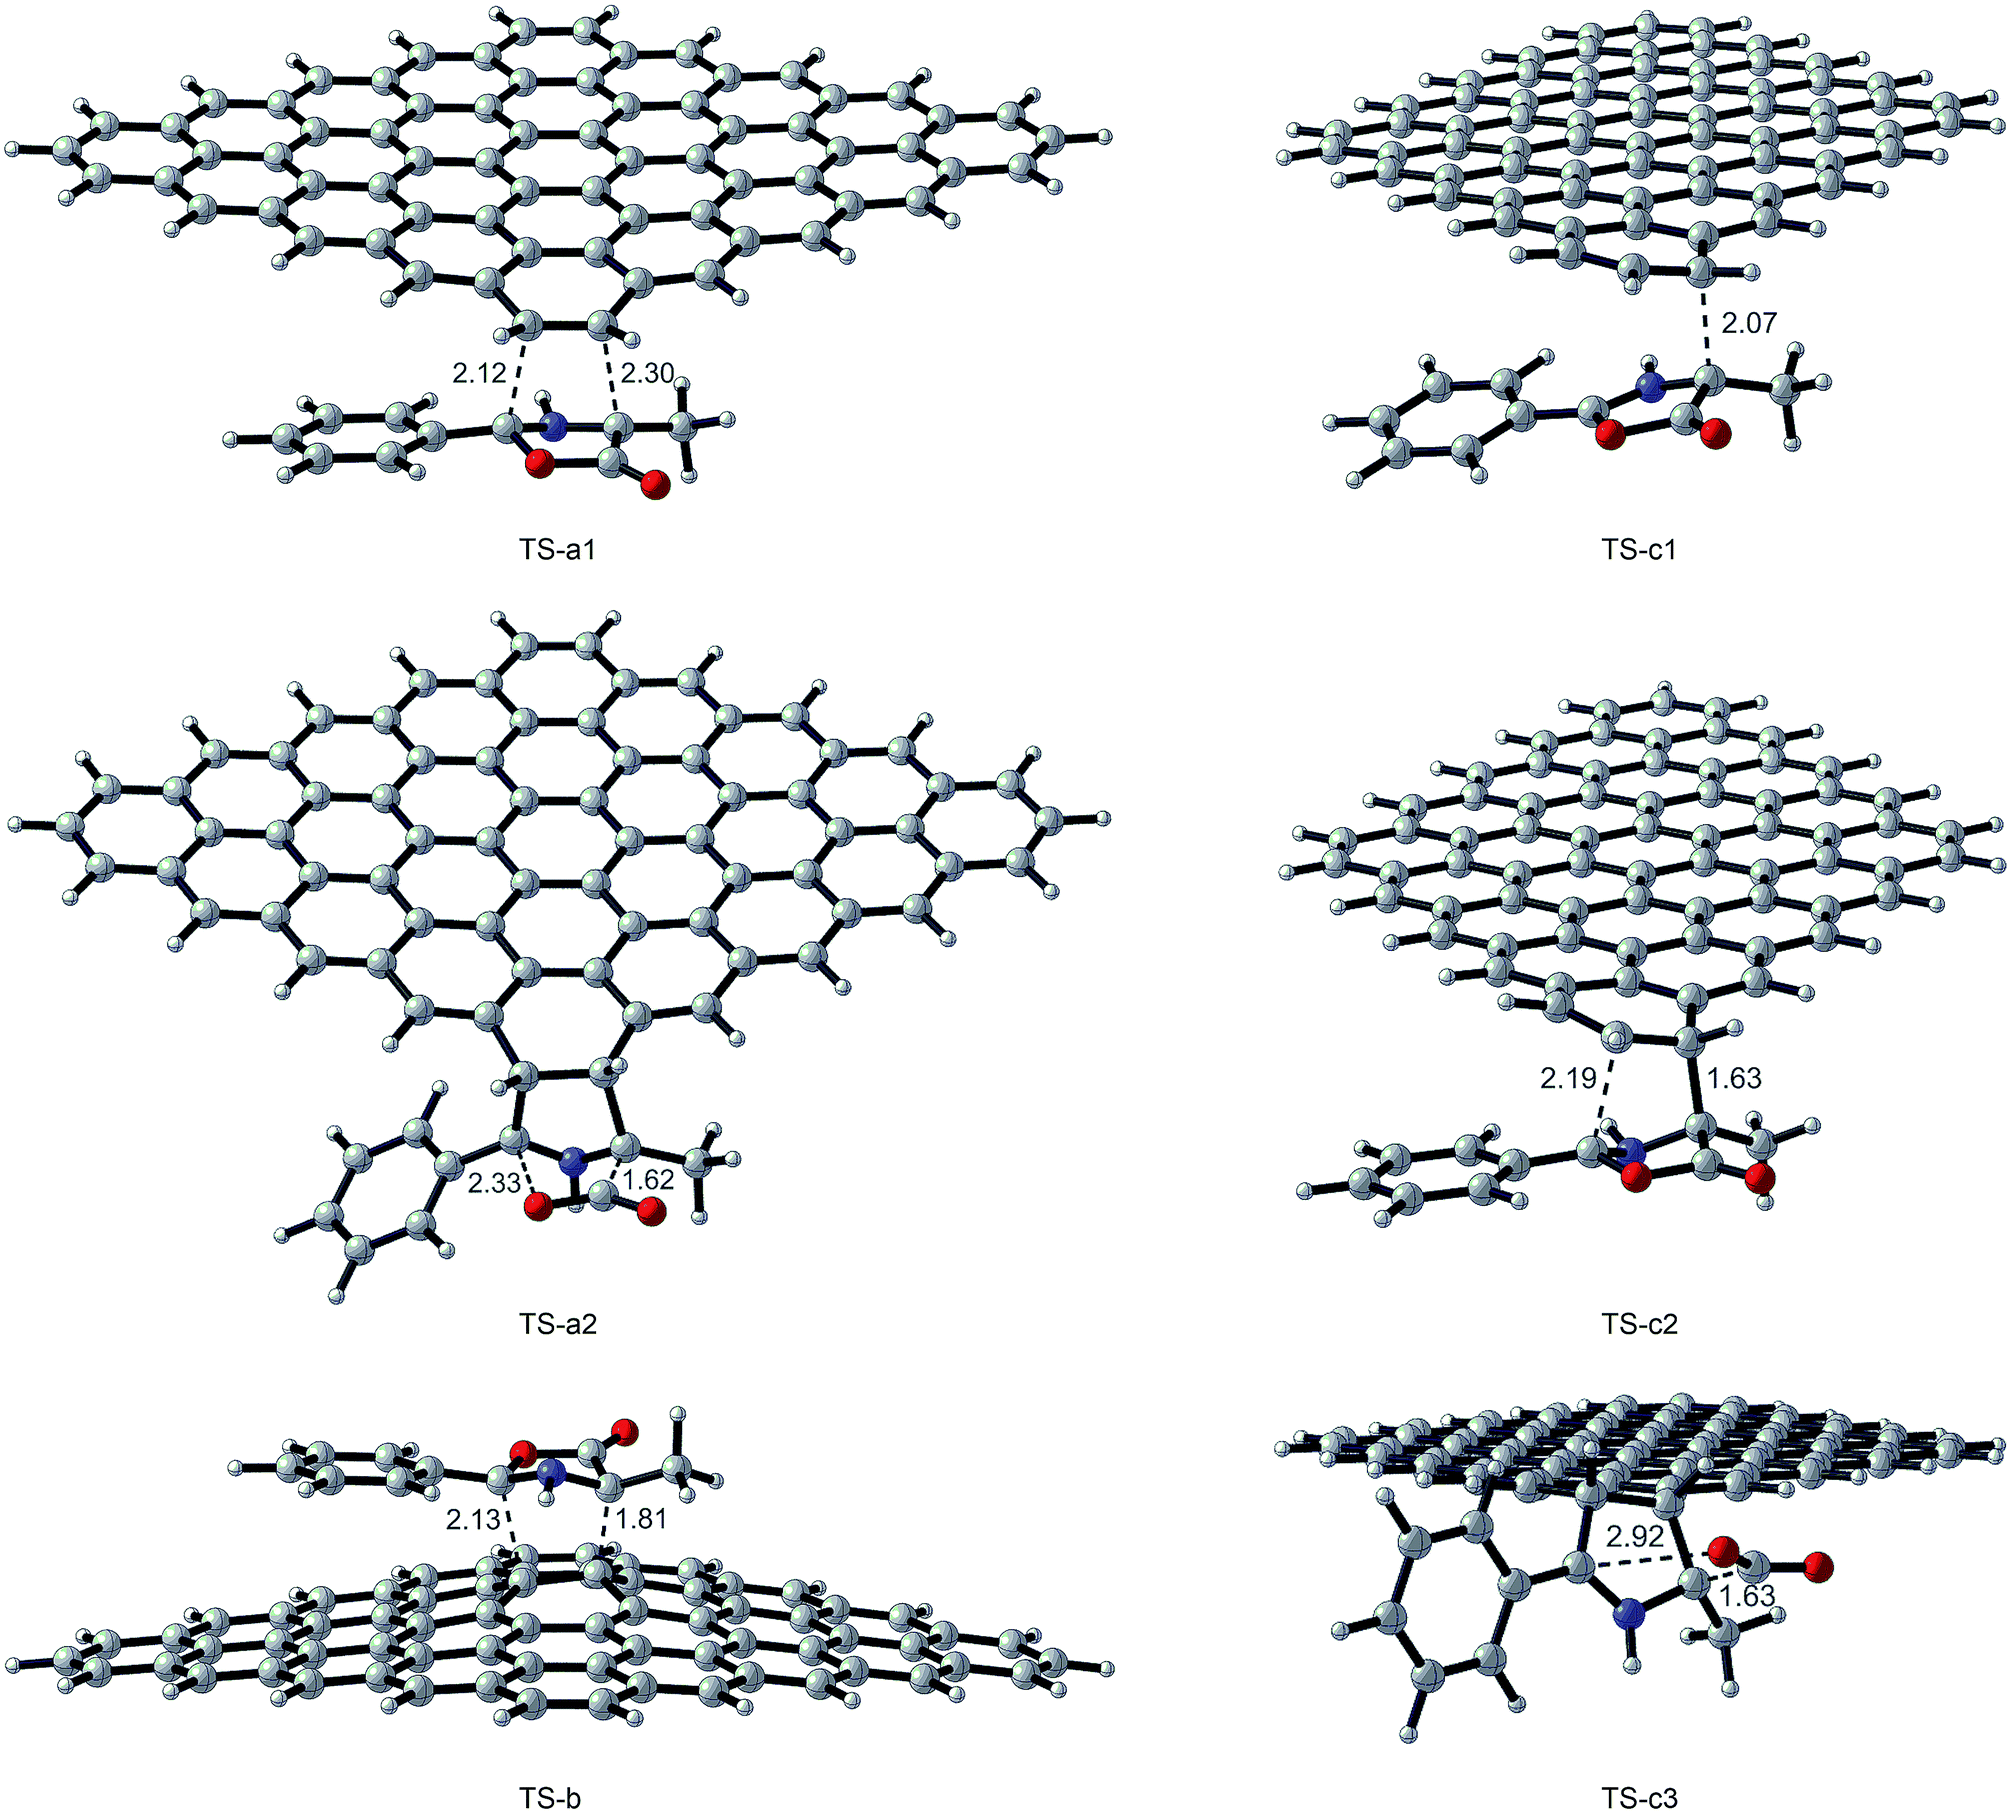 | ||
| Fig. 7 Transition state optimized structures for the 1,3-DC reaction of MPO-Mu with GFs. Distances are in Å. Carried out with CYLview.43 | ||
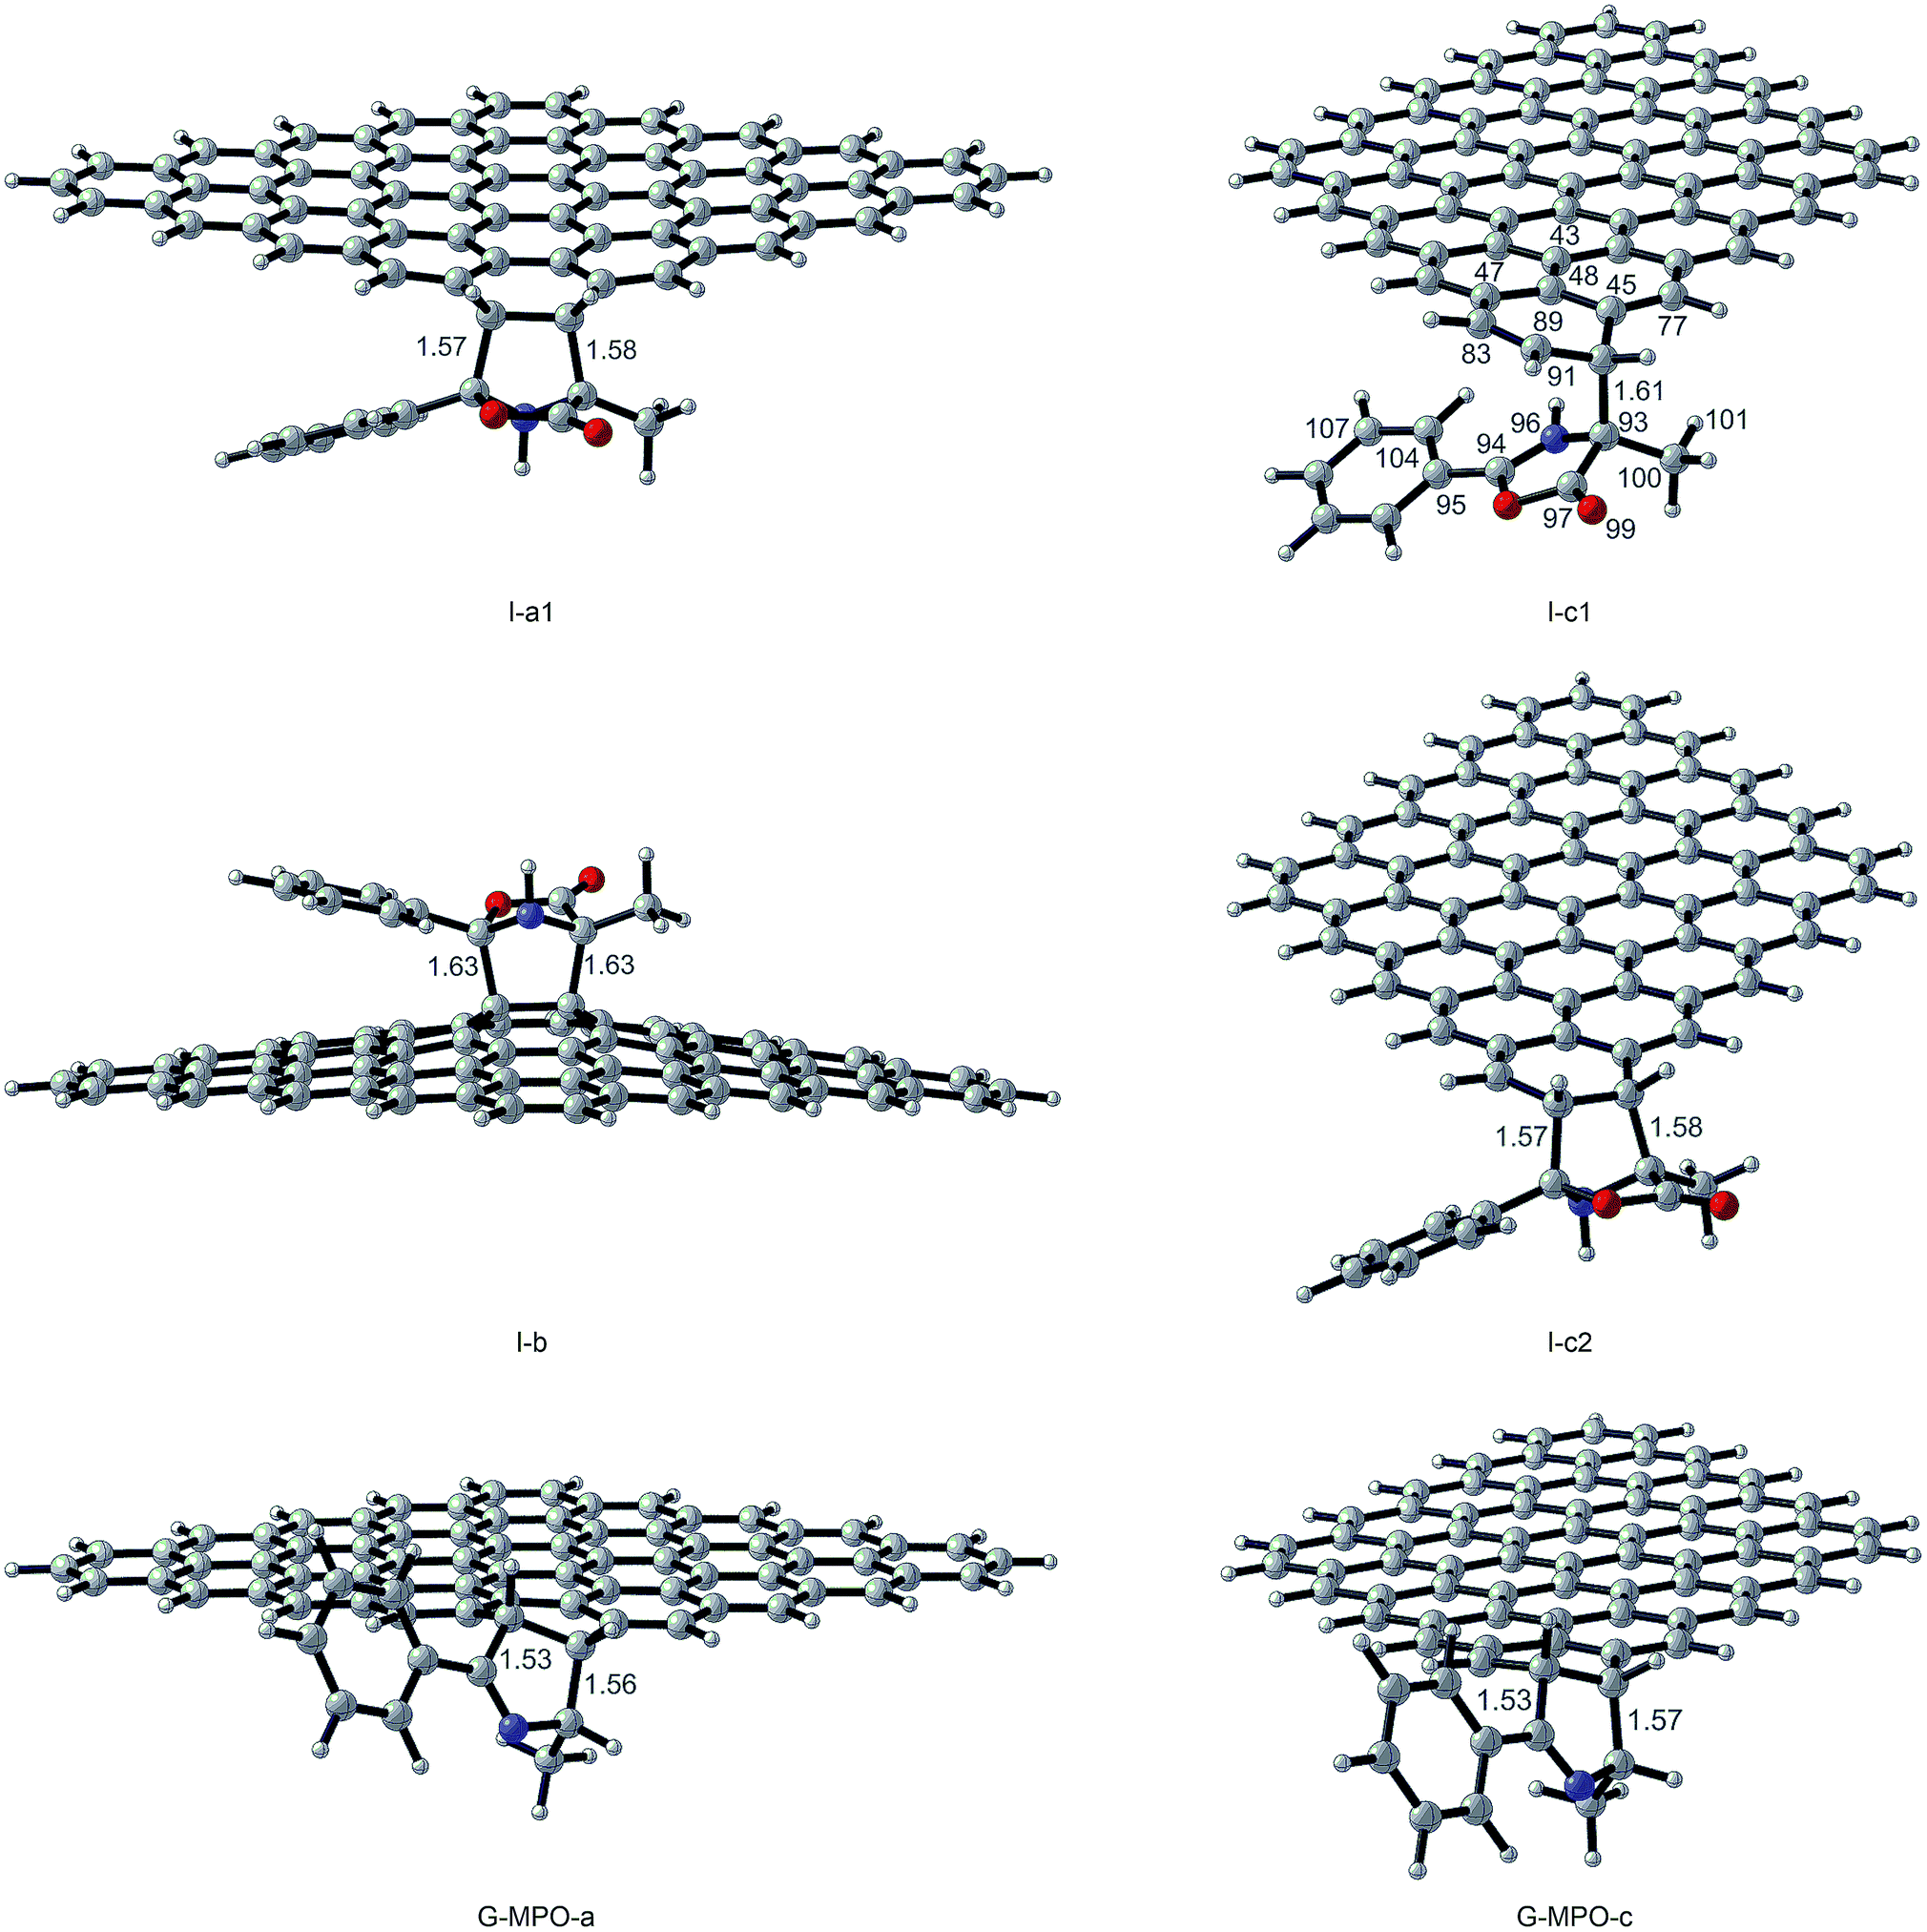 | ||
| Fig. 8 Intermediate and product optimized structures for the 1,3-DC reaction of MPO-Mu with GFs. Distances are in Å. Carried out with CYLview.43 | ||
| Structure | Direct ΔHa | Inverse ΔHb | Direct ΔGa | Inverse ΔGb | NPA qCT (e) |
|---|---|---|---|---|---|
| a Relative to MPO-Mu + GF or corresponding I. b Relative to the corresponding products. | |||||
| TS-a1 | −0.03 | 29.38 | 15.71 | 27.89 | +0.18 |
| TS-a2 | 21.74 | 29.78 | 20.74 | 41.60 | — |
| TS-b | 18.75 | 4.71 | 37.63 | 4.60 | +0.32 |
| TS-c1 | −2.71 | 7.45 | 12.84 | 7.41 | +0.47 |
| TS-c2 | 12.51 | 15.00 | 19.12 | 15.15 | +0.31 |
| TS-c3 | 23.67 | 32.34 | 26.73 | 44.42 | — |
| I-a1 | −29.41 | — | −12.18 | — | — |
| I-b | 14.04 | — | 33.04 | — | — |
| I-c1 | −10.16 | — | 5.43 | — | +0.75 |
| I-c2 | −12.65 | — | 3.97 | — | — |
| G-MPO-a | −37.45 | — | −33.03 | — | — |
| G-MPO-c | −21.32 | — | −17.69 | — | — |
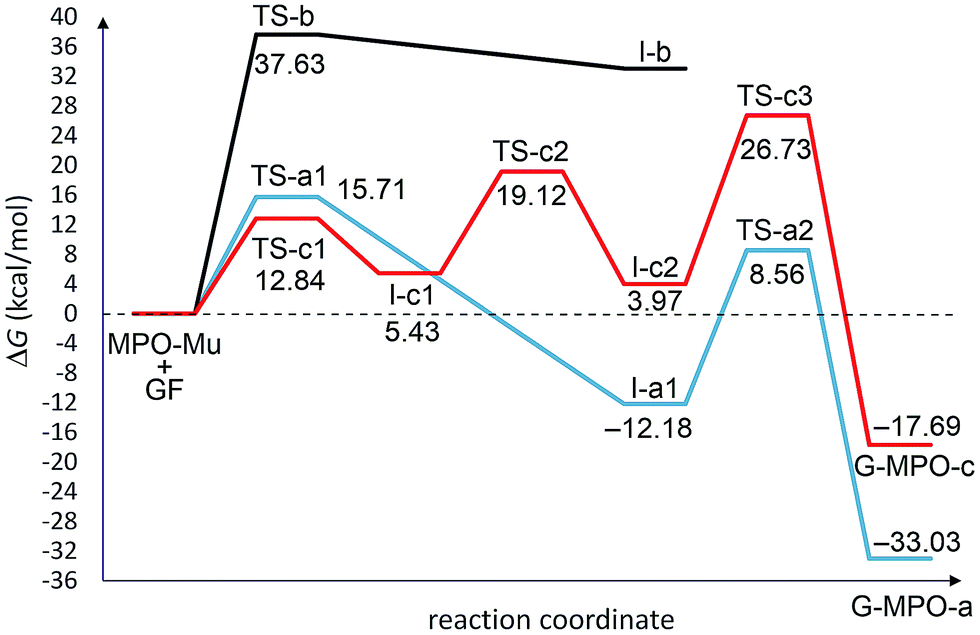 | ||
| Fig. 9 Free energy profiles for the a–c pathways involved in the 1,3-DC reaction of MPO-Mu with the 5 × 5 GF model. All values are relative to MPO-Mu + GF. | ||
From a mechanistic standpoint, the formation of I-a1,b,c2 may be rationalised by two possible approaches, a stepwise mechanism and a concerted one. In our case, for pathways a and b we were able to localize only the concerted process, whereas for pathway c only the stepwise one was successful. In principle, alternative mechanisms might also be envisaged for both cases, however all attempts to locate stationary points for reaction channels other than those reported herein were unsuccessful.
From Table 3 it is clear that pathway b is highly endergonic and the formation of I-b can ruled out; this behaviour was expected because the reaction on the interior double bound disrupts the aromaticity of four benzene rings. Pathway a is the only one that furnishes a 1,3-DC product energetically more stable than the reagents and has an activation energy (TS-a1) of 2.87 kcal mol−1 higher than that of TS-c1 for pathway c (Fig. 9). On the contrary pathway c is slightly endergonic, with an activation energy for the second step (TS-c2) of 3.41 kcal mol−1 higher than that of TS-a1. So, pathways a and c turn out to be competitive, with the second one highly reversible (ΔG inverse barriers of 7.41 and 15.15 kcal mol−1 for TSc1 and TS-c2, respectively, compared to 27.89 kcal mol−1 for TS-a1).
The natural population analysis38,50 allows us to evaluate the charge transferred between the two reactants at the TSs geometry. The charge transfer in terms of the residual charge on the MPO-Mu, for all the optimized TSs involved in the 1,3-DC process, is shown in Table 3. In all cases positive values are indicative of an electron flow from the HOMO of MPO-Mu to the LUMO of the GFs, in close agreement with Sustmann's type I dipolar cycloaddition rule (i.e. HOMO(dipole)–LUMO(dipolarophile) controlled reactions).51 Moreover this charge is more pronounced for the stepwise TS-c1 and reaches its maximum for the zwitterionic intermediate I-c1, according to a nucleophilic addition of the negatively charged C4 carbon atom of MPO-Mu (Fig. 8, C93) to one of the carbon atoms belonging to the c double bond. In the I-c1 structure the positive charge is almost all concentrated on the C93 atom (+0.72 e), whereas the negative one is principally spread over the C83 and C89 atoms.
The zwitterionic intermediate I-c1 is stabilized by secondary orbital interactions. In fact, from the results of the second order perturbation theory (SOPT) analysis of the Fock matrix in NBO basis, according to the definition of delocalization energy given by Weinhold,52,53 and reported in Table 4, it emerges that I-c1 is stabilized by a series of delocalizations, of which the main are the π → π* (0.47 kcal mol−1) of the C45–C85 bonding orbital with the antibonding orbital of the C104–C107 double bond and the two π → π* (0.52 and 0.53 kcal mol−1), due to the C83–C89 double bond with the antibonding orbitals of the C93–C100 and C97–O99 (Fig. 7 and Table 4).
| Bonds | Transition | Energy (kcal mol−1) |
|---|---|---|
| C45–C47/C100–H101 | π → σ* | 0.18 |
| C45–C85/C104–C107 | π → π* | 0.47 |
| C83–C89/C93–C100 | π → σ* | 0.34 |
| C83–C89/C94–C95 | π → π* | 0.52 |
| C83–C89/C97–O99 | π → π* | 0.53 |
| C89–H91/C97–O99 | σ → π* | 0.25 |
| C97–O99/C83–C89 | π → π* | 0.16 |
| C100–C101/C45–C77 | σ → π* | 0.14 |
| C104–C107/C47–C85 | π → π* | 0.12 |
| N96/C43–C48 | n → π* | 0.32 |
| N96/C47–C85 | n → π* | 0.14 |
| N96/C45–C77 | n → π* | 0.13 |
| N96/C47–C85 | n → π* | 0.07 |
Considering that the nitrogen inversion is a fast event, at these operating temperatures, we have taken it in account and reported here only the most stable conformer.
Finally, we considered the decarboxylative process that generates the products GMPO-a and c. The activation free energies, corresponding to the concerted loss of carbon dioxide from cycloadducts I-a1 and I-c2, of 20.74 and 22.76 kcal mol−1, respectively, suggest that this is the slow step of the reaction. The irreversible character of decarboxylation and the stability of the obtained products agree with the high grade of functionalization found experimentally.
The tautomerization of MPO to MPO-Mu is not yet fully clarified. An attempt to determine the free energy of activation for this process, based on a 1,2-hydrogen shift mechanism, gave a result of 57.93 kcal mol−1 (see ESI†). Thus, the formation of the mesoionic compound must proceed through a more complex process.54
Considering that the mesoionic MPO-Mu differs in energy by +19.35 kcal mol−1 from the starting MPO tautomer, the outcome of the whole reaction is that in the case of pathway c the process is endergonic by 1.66 kcal mol−1, whereas for pathway a it is exergonic by 13.68 kcal mol−1. So, it is probable that the most expensive step could consist of the tautomerization reaction (ΔG# > 25 kcal mol−1), justifying the temperature of almost 70 °C that it takes for the reaction to occur.
4. Conclusions
In summary, for the first time we have demonstrated that the solvent-free 1,3-DC reaction of mesoionic compounds is an effective tool for the direct functionalization and delamination of graphite flakes into few layers of graphene nanosheets.The procedure has been tested by employing two differently substituted oxazolones, and a high degree of functionalization (2.1–4.6%@700 °C) was obtained for both substrates under mild conditions (70–120 °C).
The graphite exfoliation efficiency depends upon the oxazolone substitution pattern. Raman data indicated that a single-layer-like functionalized graphene was obtained using MNPO.
As inferred from theoretical calculations, the examined 1,3-DC reaction may proceed through a concerted mechanism (pathway a) competing with a stepwise one (pathway b) involving two transition states plus a zwitterionic intermediate. However, the last stage is irreversible and this behaviour is in accord with the high degree of functionalization experimentally observed and represents the driving force of the process.
These results suggest a large scope of 1,3-DC between mesoionic compounds and graphite/graphene, and this strategy could be fruitfully extended to preformed Mu that, skipping the tautomerization process, should be more reactive.
Acknowledgements
This work was supported by MIUR [project PRIN 20109Z2XRJ_010].Notes and references
- F. Bonaccorso, L. Colombo, G. Yu, M. Stoller, V. Tozzini, A. C. Ferrari, R. S. Ruoff and V. Pellegrini, Science, 2015, 347, 1246501 CrossRef PubMed.
- H. P. Cong, J. F. Chen and S. H. Yu, Chem. Soc. Rev., 2014, 43, 7295–7325 RSC.
- T. Mahmoudi, W. Y. Rho, H. Y. Yang, S. R. P. Silva and Y. B. Hahn, Chem. Commun., 2014, 50, 8705–8708 RSC.
- J. M. Tour, Chem. Mater., 2014, 26, 163–171 CrossRef CAS.
- G. X. Liu, J. Nanoelectron. Optoelectron., 2012, 7, 329–360 CrossRef CAS PubMed.
- S. Goenka, V. Sant and S. Sant, J. Controlled Release, 2014, 173, 75–88 CrossRef CAS PubMed.
- K. Kostarelos and K. S. Novoselov, Nat. Nanotechnol., 2014, 9, 744–745 CrossRef CAS PubMed.
- S. X. Shi, F. Chen, E. B. Ehlerding and W. B. Cai, Bioconjugate Chem., 2014, 25, 1609–1619 CrossRef CAS PubMed.
- M. Quintana, E. Vazquez and M. Prato, Acc. Chem. Res., 2013, 46, 138–148 CrossRef CAS PubMed.
- V. Georgakilas, M. Otyepka, A. B. Bourlinos, V. Chandra, N. Kim, K. C. Kemp, P. Hobza, R. Zboril and K. S. Kim, Chem. Rev., 2012, 112, 6156–6214 CrossRef CAS PubMed.
- D. R. Dreyer, S. Park, C. W. Bielawski and R. S. Ruoff, Chem. Soc. Rev., 2010, 39, 228–240 RSC.
- G. Neri, A. Scala, F. Barreca, E. Fazio, P. G. Mineo, A. Mazzaglia, G. Grassi and A. Piperno, Chem. Commun., 2015, 51, 4846–4849 RSC.
- C. Peng, Y. Z. Xiong, Z. B. Liu, F. Zhang, E. C. Ou, J. T. Qian, Y. Q. Xiong and W. J. Xu, Appl. Surf. Sci., 2013, 280, 914–919 CrossRef CAS PubMed.
- Y. Cao and K. N. Houk, J. Mater. Chem., 2011, 21, 1503–1508 RSC.
- M. Quintana, A. Montellano, A. E. D. Castillo, G. Van Tendeloo, C. Bittencourt and M. Prato, Chem. Commun., 2011, 47, 9330–9332 RSC.
- B. Jin, J. Shen, R. F. Peng, C. D. Chen, Q. C. Zhang, X. Y. Wang and S. J. Chu, Ind. Eng. Chem. Res., 2015, 54, 2879–2885 CrossRef CAS.
- Y. Cao, S. Osuna, Y. Liang, R. C. Haddon and K. N. Houk, J. Am. Chem. Soc., 2013, 135, 17643–17649 CrossRef CAS PubMed.
- P. A. Denis, Chem.–Eur. J., 2013, 19, 15719–15725 CrossRef CAS PubMed.
- W. Y. Zan, Appl. Surf. Sci., 2014, 311, 377–383 CrossRef CAS PubMed.
- X. J. Xu, W. Lv, J. Huang, J. J. Li, R. L. Tang, J. W. Yan, Q. H. Yang, J. G. Qin and Z. Li, RSC Adv., 2012, 2, 7042–7047 RSC.
- S. Sarkar, E. Bekyarova, S. Niyogi and R. C. Haddon, J. Am. Chem. Soc., 2011, 133, 3324–3327 CrossRef CAS PubMed.
- J. M. Seo, I. Y. Jeon and J. B. Baek, Chem. Sci., 2013, 4, 4273–4277 RSC.
- J. M. Seo and J. B. Baek, Chem. Commun., 2014, 50, 14651–14653 RSC.
- Z. Ji, J. Chen, L. Huang and G. Q. Shi, Chem. Commun., 2015, 51, 2806–2809 RSC.
- A. Piperno, A. Scala, F. Risitano and G. Grassi, Curr. Org. Chem., 2014, 18, 2691–2710 CrossRef CAS.
- J. S. Fisk, R. A. Mosey and J. J. Tepe, Chem. Soc. Rev., 2007, 36, 1432–1440 RSC.
- J. Marco-Martinez, S. Reboredo, M. Izquierdo, V. Marcos, J. L. Lopez, S. Filippone and N. Martin, J. Am. Chem. Soc., 2014, 136, 2897–2904 CrossRef CAS PubMed.
- G. Grassi, A. Scala, A. Piperno, D. Iannazzo, M. Lanza, C. Milone, A. Pistone and S. Galvagno, Chem. Commun., 2012, 48, 6836–6838 RSC.
- A. D. Melhado, M. Luparia and F. D. Toste, J. Am. Chem. Soc., 2007, 129, 12638–12639 CrossRef CAS PubMed.
- M. Weber, S. Jautze, W. Frey and R. Peters, Chem.–Eur. J., 2012, 18, 14792–14804 CrossRef CAS PubMed.
- R. Valero, R. Costa, I. D. P. R. Moreira, D. G. Truhlar and F. Illas, J. Chem. Phys., 2008, 128, 114103 CrossRef PubMed.
- Y. Zhao and D. G. Truhlar, Theor. Chem. Acc., 2008, 120, 215–241 CrossRef CAS.
- W. J. Hehre, Ab initio molecular orbital theory, Wiley, New York, 1986 Search PubMed.
- K. Fukui, Acc. Chem. Res., 1981, 14, 363–368 CrossRef CAS.
- M. Headgordon and J. A. Pople, J. Chem. Phys., 1988, 89, 5777–5786 CrossRef CAS PubMed.
- H. B. Schlegel, J. Comput. Chem., 1982, 3, 214–218 CrossRef CAS PubMed.
- M. J. Frisch, G. W. Trucks, H. B. Schlegel, G. E. Scuseria, M. A. Robb, J. R. Cheeseman, G. Scalmani, V. Barone, B. Mennucci, G. A. Petersson, H. Nakatsuji, M. Caricato, X. Li, H. P. Hratchian, A. F. Izmaylov, J. Bloino, G. Zheng, J. L. Sonnenberg, M. Hada, M. Ehara, K. Toyota, R. Fukuda, J. Hasegawa, M. Ishida, T. Nakajima, Y. Honda, O. Kitao, H. Nakai, T. Vreven, J. A. Montgomery, J. E. Peralta, F. Ogliaro, M. Bearpark, J. J. Heyd, E. Brothers, K. N. Kudin, V. N. Staroverov, R. Kobayashi, J. Normand, K. Raghavachari, A. Rendell, J. C. Burant, S. S. Iyengar, J. Tomasi, M. Cossi, N. Rega, J. M. Millam, M. Klene, J. E. Knox, J. B. Cross, V. Bakken, C. Adamo, J. Jaramillo, R. Gomperts, R. E. Stratmann, O. Yazyev, A. J. Austin, R. Cammi, C. Pomelli, J. W. Ochterski, R. L. Martin, K. Morokuma, V. G. Zakrzewski, G. A. Voth, P. Salvador, J. J. Dannenberg, S. Dapprich, A. D. Daniels, Ö. Farkas, J. B. Foresman, J. V. Ortiz, J. Cioslowski and D. J. Fox, Gaussian 09 Revision D.01 Search PubMed.
- R. B. Weinstock and F. Weinhold, J. Chem. Phys., 1985, 83, 735–746 CrossRef PubMed.
- T. A. Nguyen, J. U. Lee, D. Yoon and H. Cheong, Sci. Rep., 2014, 4, 4630 Search PubMed.
- A. Das, B. Chakraborty and A. K. Sood, Bull. Mater. Sci., 2008, 31, 579–584 CrossRef CAS.
- R. Saito, M. Hofmann, G. Dresselhaus, A. Jorio and M. S. Dresselhaus, Adv. Phys., 2011, 60, 413–550 CrossRef CAS PubMed.
- R. Saito, A. Jorio, A. G. Souza, G. Dresselhaus, M. S. Dresselhaus and M. A. Pimenta, Phys. Rev. Lett., 2002, 88, 027401 CrossRef CAS.
- CYLview, 1.0.562 beta, C. Y. Legault, Université de Sherbrooke, 2009, http://www.cylview.org.
- S. D. Bian, A. M. Scott, Y. Cao, Y. Liang, S. Osuna, K. N. Houk and A. B. Braunschweig, J. Am. Chem. Soc., 2013, 135, 9240–9243 CrossRef CAS PubMed.
- F. Plasser, H. Pasalic, M. H. Gerzabek, F. Libisch, R. Reiter, J. Burgdorfer, T. Muller, R. Shepard and H. Lischka, Angew. Chem., Int. Ed., 2013, 52, 2581–2584 CrossRef CAS PubMed.
- M. Bendikov, H. M. Duong, K. Starkey, K. N. Houk, E. A. Carter and F. Wudl, J. Am. Chem. Soc., 2004, 126, 7416–7417 CrossRef CAS PubMed.
- P. Lazar, F. Karlicky, P. Jurecka, M. Kocman, E. Otyepkova, K. Safarova and M. Otyepka, J. Am. Chem. Soc., 2013, 135, 6372–6377 CrossRef CAS PubMed.
- J. M. Lopchuk, R. P. Hughes and G. W. Gribble, Org. Lett., 2013, 15, 5218–5221 CrossRef CAS PubMed.
- M. Martin-Rodriguez, L. M. Castello, C. Najera, J. M. Sansano, O. Larranaga, A. de Cozar and F. P. Cossio, Beilstein J. Org. Chem., 2013, 9, 2422–2433 CrossRef PubMed.
- J. E. Carpenter and F. Weinhold, J. Mol. Struct.: THEOCHEM, 1988, 169, 41–62 CrossRef.
- R. Sustmann, Pure Appl. Chem., 1974, 40, 569–593 CrossRef CAS.
- F. Weinhold, Encyclopedia of computational chemistry, J. Wiley, New York, Chichester, 1998 Search PubMed.
- F. Weinhold and C. R. Landis, Valency and bonding: a natural bond orbital donor–acceptor perspective, Cambridge University Press, Cambridge, UK, New York, 2005 Search PubMed.
- Experimental evidence indicates that several 1,3-DC reactions of MPO with activated alkenes proceed at rt. Our results showed that 1,3-DC of MPO performed in solid–solid conditions was more effective than classical reactions in molecular solvents. The functionalization degrees detected in the reaction performed in toluene at reflux for 12 h using a 1:10 GF/MPO weight ratio were 0.40%@500 °C and 0.93%@700 °C. Considering that no literature data are available, we have undertaken a comprehensive study to fully explain our results.
Footnote |
| † Electronic supplementary information (ESI) available: FT-IR, STEM, and Raman analyses, dispersibility, Cartesian coordinates and energies of DFT-computed stationary points. See DOI: 10.1039/c5sc02576a |
| This journal is © The Royal Society of Chemistry 2015 |