 Open Access Article
Creative Commons Attribution 3.0 Unported Licence
Tuning the singlet-triplet energy gap: a unique approach to efficient photosensitizers with aggregation-induced emission (AIE) characteristics†
Shidang
Xu‡
a,
Youyong
Yuan‡
a,
Xiaolei
Cai
a,
Chong-Jing
Zhang
a,
Fang
Hu
b,
Jing
Liang
a,
Guanxin
Zhang
b,
Deqing
Zhang
b and
Bin
Liu
*ac
aDepartment of Chemical and Biomolecular Engineering, National University of Singapore, 4 Engineering Drive 4, Singapore 117585
bBeijing National Laboratory for Molecular Sciences, Organic Solids Laboratory, Institute of Chemistry, Chinese Academy of Sciences, Beijing 100190, China
cInstitute of Materials Research and Engineering, 3 Research Link, Singapore 117602. E-mail: cheliub@nus.edu.sg
First published on 6th July 2015
Abstract
The efficiency of the intersystem crossing process can be improved by reducing the energy gap between the singlet and triplet excited states (ΔEST), which offers the opportunity to improve the yield of the triplet excited state. Herein, we demonstrate that modulation of the excited states is also an effective strategy to regulate the singlet oxygen generation of photosensitizers. Based on our previous studies that photosensitizers with aggregation-induced emission characteristics (AIE) showed enhanced fluorescence and efficient singlet oxygen production in the aggregated state, a series of AIE fluorogens such as TPDC, TPPDC and PPDC were synthesized, which showed ΔEST values of 0.48, 0.35 and 0.27 eV, respectively. A detailed study revealed that PPDC exhibited the highest singlet oxygen efficiency (0.89) as nanoaggregates, while TPDC exhibited the lowest efficiency (0.28), inversely correlated with their ΔEST values. Due to their similar optical properties, TPDC and PPDC were further encapsulated into nanoparticles (NPs). Subsequent surface modification with cell penetrating peptide (TAT) yielded TAT–TPDC NPs and TAT–PPDC NPs. As a result of the stronger singlet oxygen generation, TAT–PPDC NPs showed enhanced cancer cell ablation as compared to TAT–TPDC NPs. Fine-tuning of the singlet-triplet energy gap is thus proven to be an effective new strategy to generate efficient photosensitizers for photodynamic therapy.
Introduction
Photosensitized generation of reactive oxygen species (ROS) has attracted great research interest, and has found numerous applications in different fields,1,2 including synthetic organic chemistry,3 wastewater treatment,5,6 and photodynamic therapy (PDT).4 PDT represents a well-consolidated but gradually expanding approach to the treatment of cancer. It involves excitation of a photosensitizer (PS) with specific light wavelengths, which is followed by intersystem crossing (ISC) from its lowest singlet excited state (S1) to the lowest triplet excited state (T1); subsequently, energy transfer from the T1 of the PS to ground-state oxygen (3O2) generates ROS, which causes oxidative damage of targets.7The primary cytotoxic agent involved in this photodynamic process is singlet oxygen (1O2), the efficient generation of which is habitually related to the ISC efficiency of the sensitizer and concentration quenching of the excited state. As such, efficient ISC offers the opportunity to improve the triplet excited state yield, which is highly desirable for efficient 1O2 generation. In addition, any system with minimized concentration quenching of the excited state is also favorable.
Incorporation of heavy atoms into molecular structures to enhance the spin–orbit perturbations is one of the most widely used approaches to improve the ISC efficiency of PSs.8–10 However, the presence of heavy atoms such as selenium, iodine, bromine, and certain lanthanides has often been reported to cause increased “dark toxicity”.11 It is thus important to propose alternative strategies to achieve strong ISC without using heavy atoms, to minimize dark toxicity. Previous studies have shown that the ISC rate constants could be estimated from eqn (1),12 where HSO is the Hamiltonian for the spin–orbit perturbations (SOP) and ΔES1–T1 (ΔEST) is the energy gap between the S1 and T1 states. ISC can be modeled by mixing of T1 with S1 states due to SOP. This equation shows the relationship between ISC rate and ΔEST, which paves the way for improving ISC efficiency, and consequently 1O2 generation (Scheme 1).
 | (1) |
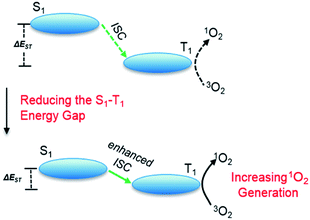 | ||
| Scheme 1 A physical model of 1O2 generation, depicting the S1–T1 ISC process and the proposed strategy for increasing 1O2 generation. | ||
Concentration quenching of the excited state is another common problem that affects the 1O2 generation efficiency of PSs. This is particularly serious for hydrophobic PSs, which tend to aggregate in aqueous media due to their rigid planar structures, resulting in aggregation-caused quenching (ACQ)13 and remarkable reduction in 1O2 generation efficiency.14 The quenching is more severe when the PSs, such as porphyrin derivatives, are encapsulated into nanocarriers, which could lead to significantly decreased fluorescence and photodynamic efficiency.15 Opposite to the ACQ effect, propeller-shaped fluorogens with aggregation-induced emission (AIEgen) characteristics have recently emerged as a powerful and versatile tool for biomedical applications.16–25 AIEgens are almost non-emissive in the molecular state but can be induced to emit strong fluorescence in the aggregated state owing to the prohibition of energy dissipation through non-radiative channels.26–33 In addition, AIEgen PSs have been found to exhibit enhanced fluorescence and efficient photosensitizing characteristics in the solid state,24,34–38 which paves the way for tackling the ACQ problem of PSs. This motivates us to develop more efficient AIEgen PSs for image-guided photodynamic therapy.
To develop more efficient AIEgen PSs, we propose to control the ΔEST values by incorporation of electron donors and acceptors into π-conjugated systems to manipulate the HOMO–LUMO distribution.39–42 By taking advantage of the unique optical properties of AIEgens, in this contribution, a series of AIEgens with methoxy as the electron donor and dicyanovinyl as the acceptor were synthesized, and their ability to generate 1O2 was studied both in solution and in cells. The work demonstrates for the first time that reducing ΔEST is an effective strategy for achieving efficient PSs for photodynamic therapy.
Experimental section
Materials
1,2-Distearoyl-sn-glycero-3-phosphoethanolamine-N-maleimide(polyethyleneglycol)-3000] (DSPE-PEG3000-Mal) was ordered from Avanti Polar Lipids. 4-Acetylphenylboronic acid, malononitrile, 2′,7′-dichlorodihydrofluorescein diacetate (DCF-DA) and other chemicals were all purchased from Alfa Aesar or Sigma-Aldrich. Cell penetrating peptide HIV-1 TAT was purchased from GL Biochem Ltd. Trypsin–EDTA, Annexin V-FITC, fetal bovine serum (FBS) and Hoechst 33342 were purchased from Life Technologies. TPDC and TPPDC were synthesized according to our previous reports.35,37Instrumentation
NMR spectra were performed on a Bruker ARX 400 NMR spectrometer. Electrospray ionization mass spectrometry (ESI-MS) was performed on a Proteome X-LTQ. Particle size and size distribution were determined by laser light scattering (LLS) with a particle size analyzer (90 Plus, Brookhaven Instruments Co., United States) at a fixed angle of 90° at room temperature. The zeta potential was determined by a Malvern Zetasizer Nano ZS90 (Worcestershire, UK). TEM images were obtained from a JEOL JEM-2010 transmission electron microscope with an accelerating voltage of 200 KV. UV-vis absorption spectra were taken on a Shimadzu Model UV-1700 spectrometer. Photoluminescence (PL) spectra were measured on a Perkin-Elmer LS 55 spectrofluorometer. All UV and PL spectra were collected at 24 ± 1 °C.Computational details
All molecules were fully optimized by the hybrid B3LYP, in combination with the 6-31G(d) basis set. The excited-state characteristics were calculated by time-dependent density functional theory (TD-DFT) using optimized ground state geometries. TD-DFT in combination with the B3LYP hybrid functional method and the 6-31G(d) basis set has been shown to provide accurate energies for the excited state of D–A molecular systems with less than 0.1 eV error.39–41 The geometry data of TPDC, TPPDC and PPDC are provided in the (ESI).†Synthesis of PPDC
The synthesis and characterization of the intermediates of DMTPBr and PPAc are described in the ESI.† To synthesize PPDC, PPAc (100 mg, 0.18 mmol), malononitrile (100 mg, 1.50 mmol) and ammonium acetate (139 mg, 1.80 mmol) were dissolved in a mixture of dichloromethane (20 mL) and methanol (4 mL). Then silica gel (2.4 g) was added to the above mixture, and the solvent was removed under reduced pressure. The resulting mixture was heated at 100 °C for 4 h. The mixture was cooled down and subsequently separated by chromatography (hexane/ethyl acetate = 20/1, v/v) to give the desired product as a yellow powder (74 mg, 73.6% yield). 1H NMR (400 MHz, CDCl3) δ 7.65–7.50 (m, 4H), 7.31 (d, J = 8.4 Hz, 2H), 7.11–6.95 (m, 7H), 6.92–6.80 (m, 4H), 6.65–6.49 (m, 4H), 3.67 (d, J = 0.7 Hz, 6H), 2.59 (s, 3H). 13C NMR (100 MHz, CDCl3) δ 174.5, 158.30, 158.2, 144.8, 144.8, 144.0, 140.9, 138.4, 136.4, 136.1, 134.2, 132.6, 132.5, 132.0, 131.4, 128.0, 127.8, 127.2, 126.3, 113.1, 113.0, 112.9, 83.8, 77.3, 77.0, 76.7, 60.3, 55.0, 55.0, 23.9, 21.0, 14.1; EI-MS, m/z: [M + 1]+ calcd 558.2, found 558.5.Preparation of TAT–TPDC NPs and TAT–PPDC NPs
DSPE-PEG3000-Mal (1.0 mg) and TPDC (or PPDC) (0.5 mg) in THF solution (1 mL) was poured into water (10 mL) and sonicated for 2 min with a microtip probe sonicator at 12 W output. The organic solvent was removed by stirring the mixture at room temperature to yield NPs. The NPs were further reacted with HIV-TAT peptide (RKKRRQRRRC, 1.5 mg) via click coupling reaction overnight. Then the TAT-functionalized NPs were purified by ultrafiltration (MWCO 20![[thin space (1/6-em)]](https://www.rsc.org/images/entities/char_2009.gif) 000) three times, and resuspended in Milli-Q water for further use. The grafting efficiency of TAT to the NPs was evaluated using the following procedure. In brief, the filtrate containing the unreacted TAT was carefully collected and analyzed using HPLC. The amount of grafted TAT was obtained by subtracting the amount of TAT in the filtrate from the total amount of TAT used. The grafting efficiency of TAT to the NPs was calculated by taking the ratio between the amount of grafted TAT and the initial amount of TAT used for conjugation.
000) three times, and resuspended in Milli-Q water for further use. The grafting efficiency of TAT to the NPs was evaluated using the following procedure. In brief, the filtrate containing the unreacted TAT was carefully collected and analyzed using HPLC. The amount of grafted TAT was obtained by subtracting the amount of TAT in the filtrate from the total amount of TAT used. The grafting efficiency of TAT to the NPs was calculated by taking the ratio between the amount of grafted TAT and the initial amount of TAT used for conjugation.
1O2 quantum yield measurements44
The 1O2-sensitive indicator 9,10-anthracenediyl-bis(methylene) dimalonic acid (ABDA) was used as the 1O2 indicator, and Rose Bengal (RB) was employed as the standard photosensitizer. In these experiments, 10 μL of ABDA solution (2 M) was added to 1 mL of sample solution, and white light (400–800 nm) with a power density of 0.25 W cm−2 was used as the irradiation source. The absorbance of ABDA at 378 nm was recorded at different irradiation times to obtain the decay rate of the photosensitizing process. The 1O2 quantum yield of the PS in water (ФPS) was calculated using the following formula: | (2) |
Cell culture
Human cervix carcinoma HeLa cells were provided by American Type Culture Collection (ATCC) and cultured in DMEM medium containing penicillin (100 U mL−1), FBS (Invitrogen, 10%) and streptomycin (100 μg mL−1). The cells were maintained in a humidified incubator with 5% CO2 at 37 °C.Quantification of the cellular uptake by fluorescence microplate reader
HeLa cells in 96-well plates were incubated with the medium containing TAT–TPDC NPs and TAT–PPDC NPs (5 μg mL−1) for a designated time. Then the cells were washed with 1 × PBS twice and the fluorescence intensity was studied using a T-CAN microplate reader with excitation and emission wavelengths at 405 and 595 nm, respectively.Confocal imaging
The cells were cultured in 8-well chambers at 37 °C and precultured overnight. Then the culture medium was removed and the cells were washed with 1 × PBS before incubation with the TAT–TPDC NPs and TAT–PPDC NPs (5 μg mL−1). The cell nuclei were living stained with Hoechst 33342 (Life Technologies, Ex: 404 nm, Em: 430–470 nm). The cells were imaged by confocal laser scanning microscope (CLSM, Zeiss LSM 410, Jena, Germany). The images were analyzed with the Image J 1.43 × program (developed by the NIH, http://rsbweb.nih.gov/ij/).Cytotoxicity studies
The metabolic activity of the cells was assessed by 3-(4,5-dimethythiazol-2-yl)-2,5-diphenyltetrazolium bromide (MTT) assays. After 24 h incubation in DMEM medium, the cells were incubated with different concentrations of TAT–TPDC NPs and TAT–PPDC NPs for 4 h, then the medium was replaced with a fresh one and exposed to white light irradiation. The cells were further incubated for 24 h and washed with 1 × PBS before the addition of 100 μL of MTT solution (0.5 mg mL−1) into each well. After 3 h incubation, the MTT solution was removed and DMSO (100 μL) was added into each well. The absorbance of MTT at 570 nm was studied with the microplate reader (Genios Tecan). Cells without any treatment were used as a control.Results and discussion
Molecular design and TD-DFT calculation of ΔEST
The molecular designs of TPDC, TPPDC and PPDC are based on the following considerations: (1) tetraphenylethylene (TPE) is AIE-active, and the AIE characteristics can be retained after chemical modification;27,29 (2) small ΔEST values can be realized via intramolecular charge transfer within molecular systems containing spatially separated donor and acceptor moieties;39–42 (3) the benzene ring is a widely used π bridge for HOMO–LUMO engineering; (4) close molecular structures suggest a similar amount of spin–orbit coupling between S1 and T1, so that ΔEST can be viewed as inversely proportional to kISC (eqn (1)). Accordingly, based on the parent TPE, by incorporating dicyanovinyl as the electron acceptor and methoxy as the electron donor, TPDC, TPPDC and PPDC were synthesized and purified with high yields. The molecular structures, HOMO and LUMO distribution and ΔEST values of all three compounds are summarized in Fig. 1. As predicted by time-dependent DFT (TD-DFT), the ΔEST values of TPDC, TPPDC and PPDC are 0.48, 0.35 and 0.27 eV, respectively, which are much smaller than that for TPE (1.22 eV). The small ΔEST suggests that a potentially high ISC rate is possible for efficient 1O2 generation.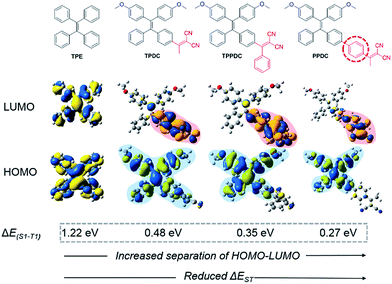 | ||
| Fig. 1 Chemical structures and HOMO–LUMO distributions of TPE, TPDC, TPPDC and PPDC, optimized structures of the HOMO and LUMO at S1 were calculated by TD-DFT (Gaussian 09/B3LYP/6-31G(d)). | ||
Synthesis
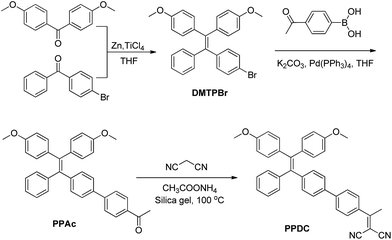
The synthesis of PPDC is shown in Scheme 2. DMTPBr was synthesized according to the reported procedures.35DMTPBr was first transformed into PPAcvia Suzuki-coupling with 4-acetylphenylboronic acid. PPDC was subsequently obtained in 74.6% yield by the reaction between PPAc and malononitrile in the presence of ammonium acetate and pyridine. The final product and intermediates were characterized by NMR and mass spectrometry in Fig. S1–S8,† which revealed their correct structures with high purity.Optical properties and 1O2 generation of photosensitizers
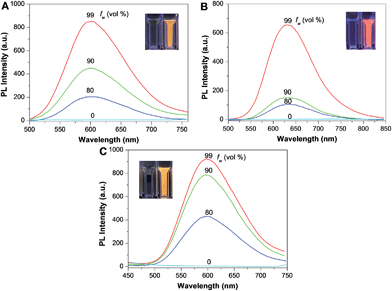
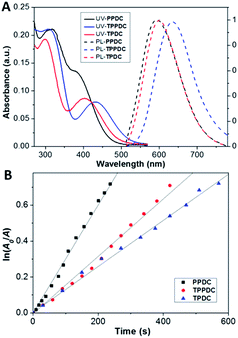
The optical properties of TPDC, TPDCP and PPDC were investigated first. The AIE characteristics of all the compounds were studied by monitoring their emission properties in DMSO/water mixtures with different volume fractions of water. As shown in Fig. 2, all three compounds are almost non-emissive in pure DMSO and they gradually become emissive after introducing a certain amount of water into the DMSO solution, indicating that they are indeed AIE active. The size distributions of the aggregates formed in DMSO/water (v/v = 1/99) mixtures were evaluated by laser light scattering (LLS), which revealed an average size of ∼50 nm for each (Fig. S9†). Fig. 3A shows the absorption and emission spectra of TPDC, TPDCP and PPDC as nanoaggregates at the same concentration of 10 μM. Although TPDC shows a red-shifted absorption spectrum as compared to PPDC, they have similar light absorption in the white light range (>400 nm) by comparing the areas under the absorption spectra.To assess the capabilities of PPDC, TPDC and TPPDC for 1O2 generation, a commercial 1O2 probe, ABDA, was used as an indicator, and RB was used as the standard PS (the 1O2 quantum yield for ФRB is 0.75 in water).43 As shown in Fig. S10,† under white light irradiation, the presence of PPDC, TPDC, TPPDC or RB, in the ABDA solution leads to gradually decreased ABDA absorbance with prolonged irradiation time, indicating degradation of ABDA by the generated 1O2 in solution. It is important to note that under the same conditions, the white light irradiation on ABDA alone does not lead to an obvious change in absorbance. If we define A0 and A as the absorbance of ABDA in the presence of these AIEgen PSs at 378 nm before and after irradiation, respectively, the plot of ln (A0/A) against time gives straight lines in Fig. 3B. From the slopes, the decomposition rate constants (KPS) of PPDC, TPPDC and TPDC can be calculated as 0.0032, 0.0018 and 0.0013 s−1, respectively. Under the same experimental conditions, the rate constant for RB (KRB) is 0.0055 s−1 (Fig. S10†). The integrations of the optical absorption in the wavelength range of 400–800 nm (APS) for RB, PPDC, TPPDC and TPDC are 9.52, 4.68, 7.33 and 5.67, respectively (Fig. S10†). Interestingly, PPDC shows the second largest KPS with the smallest integrated area. The 1O2 quantum yields of PPDC, TPPDC and TPDC were calculated to be 0.89, 0.32 and 0.28, respectively. These results agreed well with the prediction based on eqn (1). Tuning the ΔEST is thus an effective strategy to yield PSs with controlled 1O2 generation efficiency. Due to the similar APS values for TPDC and PPDC, they were chosen for 1O2 generation comparison in cells.
Preparation and characterization of TAT–TPDC NPs and TAT–PPDC NPs
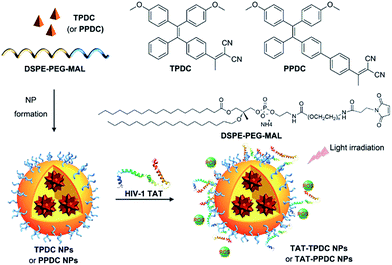
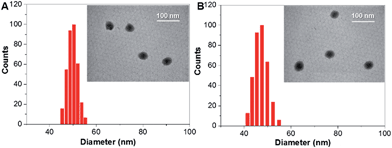
The TAT–TPDC NPs and TAT–PPDC NPs were prepared via the modified nano-precipitation method (Scheme 3).19 The maleimide-bearing copolymer DSPE-PEG3000-Mal was used as the matrix to encapsulate TPDC and PPDC to yield maleimide-functionalized AIE NPs, which were subsequently reacted with sulfhydryl (–SH) bearing cell-penetrating peptide (RKKRRQRRRC) to yield the TAT–TPDC NPs and TAT–PPDC NPs, respectively.The absorption and emission spectra of TAT–TPDC NPs and TAT–PPDC NPs are shown in Fig. S11.† When the same concentrations of TAT and NPs were used, the TAT conjugation efficiencies were calculated to be 62 ± 5% and 58 ± 4% for TAT–TPDC NPs and TAT–PPDC NPs, respectively. The size distributions of both NPs were evaluated by laser light scattering (LLS), which revealed an average size of ∼50 nm for each (Fig. 4). Likewise, TAT–TPDC NPs and TAT–PPDC NPs exhibit similar morphology according to the TEM images shown in the insets of Fig. 4. In addition, the zeta potentials for TAT–TPDC NPs and TAT–PPDC NPs are 23.7 mV and 23.4 mV, respectively. In view of the similar TAT conjugation efficiency, particle size, and surface charge of TAT–TPDC NPs and TAT–PPDC NPs, it is reasonable to expect that the two NPs would show similar uptake efficiency by the same cancer cells.
Imaging of live cancer cells
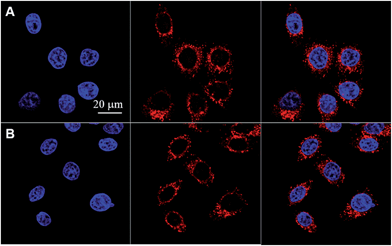
TAT–TPDC NPs and TAT–PPDC NPs were incubated with human cervix carcinoma HeLa cells for 4 h and their confocal fluorescence images are shown in Fig. 5. Red fluorescence either from TAT–TPDC NPs or TAT–PPDC NPs in the cell cytoplasm and blue fluorescence from Hoechst in the cell nuclei are simultaneously observed. Further quantitative fluorescence intensity analysis of both samples of NPs was performed by comparing the fluorescence intensity ratio (TPDC/PPDC) of the NPs retained in the medium before and after cell incubation and cell removal. The same intensity ratio indicates that the HeLa cell uptake of both types of NPs is similar.Photodynamic therapy
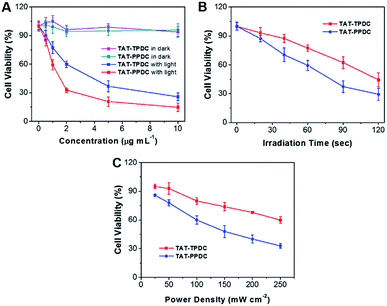
Low cytotoxicity in dark conditions but high toxicity upon exposure to light irradiation is essential for phototherapy. Quantitative evaluation of the therapeutic effect of TAT–TPDC NPs and TAT–PPDC NPs on HeLa cells was studied by standard MTT assay. The cytotoxicity of HeLa cells upon incubation with TAT–TPDC NPs and TAT–PPDC NPs in dark conditions was first evaluated. As shown in Fig. 6A, after 24 h incubation, no significant cytotoxicity is observed in the dark. However, after exposure to light irradiation, a dose-dependent cytotoxicity is observed in HeLa cells for both types of NPs. The half-maximal inhibitory concentrations (IC50) of TAT–TPDC NPs and TAT–PPDC NPs for HeLa cells are 3.44 and 1.28 μg mL−1, respectively. The lower IC50 of TAT–PPDC NPs relative to that for TAT–TPDC NPs should be attributed to the higher 1O2 quantum yield and more efficient light-induced 1O2 generation upon light irradiation for the former. The 2.6-fold lower IC50 of TAT–TPDC NPs is reckoned significant in cancer cell inhibition. Furthermore, to validate the exposure time and light power-dependent PDT, both TAT–TPDC NP- and TAT–PPDC NP-incubated HeLa cells were irradiated with light for different time durations or at different power densities. For example, when the cells were incubated with 1.0 μg mL−1 each of the NPs, followed by white light irradiation at a power density of 100 mW cm−2, the time required to reach 50% cell viability was 73 s for TAT–PPDC NPs and 113 s for TAT–TPDC NPs. By keeping the NP concentration the same at 1.0 μg mL−1, and the irradiation time as 60 s, varying the light power densities also results in different cell viabilities (Fig. 6C). Under all the tested conditions, TAT–PPDC NPs showed enhanced inhibition of cell viability as compared to TAT–TPDC NPs, which clearly demonstrates the importance of PS design in photodynamic therapy. These results also show that therapeutic efficiency can be regulated by controlling the laser irradiation time or the light power density.Fluorescein isothiocyanate (FITC)-tagged Annexin V, a cell apoptosis indicator, was subsequently used to study whether cell apoptosis occurred in the PDT process. FITC-tagged Annexin V is commonly used to distinguish viable cells from apoptotic ones, as Annexin V can selectively bind to the exposed phosphatidylserines on the outer cytoplasmic membrane of apoptotic cells. As shown in Fig. S12,† after incubation of HeLa cells with TAT–TPDC NPs or TAT–PPDC NPs followed by light irradiation and FITC-tagged Annexin V staining, strong green fluorescence attributed to FITC is clearly observed on the cell membranes, indicating that the cells undergo the apoptosis process. On the other hand, no green fluorescence signal is observed in HeLa cells under dark conditions, indicating that TAT–TPDC NPs and TAT–PPDC NPs show low dark toxicity. The results indicate that the 1O2 clearly causes cell death.
Conclusions
In this contribution, three AIEgen PSs of TPDC, TPPDC and PPDC were designed and synthesized with fine-tuned ΔESTvia HOMO–LUMO engineering. Among the three AIEgens, PPDC shows the highest 1O2 quantum yield of 0.89, owing to its lowest ΔEST value (0.27 eV). This led to higher HeLa cell inhibition for TAT–PPDC NPs relative to TAT–TPDC NPs upon white light illumination. These observations validate our hypothesis that reducing the ΔEST values could yield higher 1O2 generation and more efficient PDT. Distinguished from traditional PSs that show ACQ characteristics with reduced 1O2 generation in aggregates (e.g. NPs), the AIEgen PSs developed in this work show strong fluorescence emission and efficient 1O2 generation in NPs, which make them highly favorable for image-guided cancer therapy. When the fine-tuning of the ΔEST approach is further extended to a large variety of fluorophores, such as BODIPY, rhodamine, and phthalocyanine, etc., one would expect to develop new PSs with enhanced 1O2 generation for more efficient PDT.Notes and references
- Y. Cakmak, S. Kolemen, S. Duman, Y. Dede, Y. Dolen, B. Kilic, Z. Kostereli, L. T. Yildirim, A. L. Dogan, D. Guc and E. U. Akkaya, Angew. Chem., Int. Ed., 2011, 50, 11937–11941 CrossRef CAS PubMed.
- M. DeRosa, Coord. Chem. Rev., 2002, 233–234, 351–371 CrossRef CAS.
- E. L. Clennan and A. Pace, Tetrahedron, 2005, 61, 6665–6691 CrossRef CAS PubMed.
- L. Villén, F. Manjón, D. García-Fresnadillo and G. Orellana, Appl. Catal., B, 2006, 69, 1–9 CrossRef PubMed.
- D. W. Felsher, Nat. Rev. Cancer, 2003, 3, 375–380 CrossRef CAS PubMed.
- Y. Wu, Y. Zhen, Y. Ma, R. Zheng, Z. Wang and H. Fu, J. Phys. Chem. Lett., 2010, 1, 2499–2502 CrossRef CAS.
- C. S. Foote, Photochem. Photobiol., 1991, 54, 659 CrossRef CAS PubMed.
- T. Yogo, Y. Urano, Y. Ishitsuka, F. Maniwa and T. Nagano, J. Am. Chem. Soc., 2005, 127, 12162–12163 CrossRef CAS PubMed.
- J. Zhao, W. Wu, J. Sun and S. Guo, Chem. Soc. Rev., 2013, 42, 5323–5351 RSC.
- N. Adarsh, R. R. Avirah and D. Ramaiah, Org. Lett., 2010, 12, 5720–5723 CrossRef CAS PubMed.
- S. H. Lim, C. Thivierge, P. Nowak-Sliwinska, J. Han, H. van den Bergh, G. Wagnieres, K. Burgess and H. B. Lee, J. Med. Chem., 2010, 53, 2865–2874 CrossRef CAS PubMed.
- Y. L. Chen, S. W. Li, Y. Chi, Y. M. Cheng, S. C. Pu, Y. S. Yeh and P. T. Chou, ChemPhysChem, 2005, 6, 2012–2017 CrossRef CAS PubMed.
- J. B. Birks, Photophysics of Aromatic Molecules, Wiley, 1970 Search PubMed.
- N. Sekkat, H. van den Bergh, T. Nyokong and N. Lange, Molecules, 2012, 17, 98144 Search PubMed.
- J. Moan, K. Berg and V. Iani, Action spectra of dyes relevant for photodynamic therapy, in Photodynamic tumour therapy 2nd and 3rd generation photosensitizers, ed. J. G. Moser, Harwood Academic Publishers, Amsterdam, 1998, 1169–1181 Search PubMed.
- H. Shi, J. Liu, J. Geng, B. Z. Tang and B. Liu, J. Am. Chem. Soc., 2012, 134, 9569–9572 CrossRef CAS PubMed.
- S. Chen, Y. Hong, Y. Liu, J. Liu, C. W. T. Leung, M. Li, R. T. K. Kwok, E. Zhao, J. W. Y. Lam, Y. Yu and B. Z. Tang, J. Am. Chem. Soc., 2013, 135, 4926–4929 CrossRef CAS PubMed.
- D. Ding, C. C. Goh, G. Feng, Z. Zhao, J. Liu, R. Liu, N. Tomczak, J. Geng, B. Z. Tang, L. G. Ng and B. Liu, Adv. Mater., 2013, 25, 6083–6088 CrossRef CAS PubMed.
- K. Li, W. Qin, D. Ding, N. Tomczak, J. Geng, R. Liu, J. Liu, X. Zhang, H. Liu, B. Liu and B. Z. Tang, Sci. Rep., 2013, 3, 1150 Search PubMed.
- D. Ding, K. Li, B. Liu and B. Z. Tang, Acc. Chem. Res., 2013, 46, 2441–2453 CrossRef CAS PubMed.
- Y. Yuan, R. T. Kwok, B. Z. Tang and B. Liu, J. Am. Chem. Soc., 2014, 136, 2546–2554 CrossRef CAS PubMed.
- X. Xue, Y. Zhao, L. Dai, X. Zhang, X. Hao, C. Zhang, S. Huo, J. Liu, C. Liu, A. Kumar, W. Q. Chen, G. Zou and X. J. Liang, Adv. Mater., 2014, 26, 712–717 CrossRef CAS PubMed.
- J. Liang, B. Z. Tang and B. Liu, Chem. Soc. Rev., 2015, 44, 2798–2811 RSC.
- Q. Hu, M. Gao, G. Feng and B. Liu, Angew. Chem., Int. Ed., 2014, 53, 14225–14229 CrossRef CAS PubMed.
- J. Mei, Y. Hong, J. W. Lam, A. Qin, Y. Tang and B. Z. Tang, Adv. Mater., 2014, 26, 5429–5479 CrossRef CAS PubMed.
- X. Zhang, X. Zhang, L. Tao, Z. Chi, J. Xu and Y. Wei, J. Mater. Chem. B, 2014, 2, 4398–4414 RSC.
- Y. Hong, J. W. Lam and B. Z. Tang, Chem. Soc. Rev., 2011, 40, 5361–5388 RSC.
- J. Luo, Z. Xie, J. W. Lam, L. Cheng, H. Chen, C. Qiu, H. S. Kwok, X. Zhan, Y. Liu, D. Zhu and B. Z. Tang, Chem. Commun., 2001, 1740–1741 RSC.
- Y. Hong, J. W. Lam and B. Z. Tang, Chem. Commun., 2009, 4332–4353 RSC.
- S. Xu, T. Liu, Y. Mu, Y. F. Wang, Z. Chi, C. C. Lo, S. Liu, Y. Zhang, A. Lien and J. Xu, Angew. Chem., Int. Ed., 2015, 54, 874–878 CrossRef CAS PubMed.
- K. Li and B. Liu, Chem. Soc. Rev., 2014, 43, 6570–6597 RSC.
- Z. Chi, X. Zhang, B. Xu, X. Zhou, C. Ma, Y. Zhang, S. Liu and J. Xu, Chem. Soc. Rev., 2012, 41, 3878–3896 RSC.
- J. Li, Y. Jiang, J. Cheng, Y. Zhang, H. Su, J. W. Lam, H. H. Sung, K. S. Wong, H. S. Kwok and B. Z. Tang, Phys. Chem. Chem. Phys., 2015, 17, 1134–1141 RSC.
- E. Zhao, H. Deng, S. Chen, Y. Hong, C. W. Leung, J. W. Lam and B. Z. Tang, Chem. Commun., 2014, 50, 14451–14454 RSC.
- Y. Yuan, C. J. Zhang, M. Gao, R. Zhang, B. Z. Tang and B. Liu, Angew. Chem., Int. Ed., 2015, 54, 1780–1786 CrossRef CAS PubMed.
- Y. Yuan, G. Feng, W. Qin, B. Z. Tang and B. Liu, Chem. Commun., 2014, 50, 8757–8760 RSC.
- F. Hu, Y. Huang, G. Zhang, R. Zhao, H. Yang and D. Zhang, Anal. Chem., 2014, 86, 7987–7995 CrossRef CAS PubMed.
- Y. Yuan, C. Zhang and B. Liu, Chem. Commun., 2015, 51, 8626–8629 RSC.
- Q. Zhang, B. Li, S. Huang, H. Nomura, H. Tanaka and C. Adachi, Nat. Photonics, 2014, 8, 326–332 CrossRef CAS PubMed.
- J. Li, T. Nakagawa, J. MacDonald, Q. Zhang, H. Nomura, H. Miyazaki and C. Adachi, Adv. Mater., 2013, 25, 3319–3323 CrossRef CAS PubMed.
- H. Uoyama, K. Goushi, K. Shizu, H. Nomura and C. Adachi, Nature, 2012, 492, 234–238 CrossRef CAS PubMed.
- S. Y. Lee, T. Yasuda, Y. S. Yang, Q. Zhang and C. Adachi, Angew. Chem., Int. Ed., 2014, 53, 6402–6406 CrossRef CAS PubMed.
- L. Xiao, L. Gu, S. B. Howell and M. J. Sailor, ACS Nano, 2011, 5, 3651–3659 CrossRef CAS PubMed.
- J. Ge, M. Lan, B. Zhou, W. Liu, L. Guo, H. Wang, Q. Jia, G. Niu, X. Huang, H. Zhou, X. Meng, P. Wang, C. S. Lee, W. Zhang and X. Han, Nat. Commun., 2014, 5, 4596 CAS.
Footnotes |
| † Electronic supplementary information (ESI) available: Synthesis and characterization of the intermediates and molecular orbital data. See DOI: 10.1039/c5sc01733e |
| ‡ These authors contributed equally. |
| This journal is © The Royal Society of Chemistry 2015 |

