 Open Access Article
Systematic and site-specific analysis of N-sialoglycosylated proteins on the cell surface by integrating click chemistry and MS-based proteomics†
Weixuan
Chen
,
Johanna M.
Smeekens
and
Ronghu
Wu
*
School of Chemistry and Biochemistry and the Petit Institute for Bioengineering and Bioscience, Georgia Institute of Technology, Atlanta, Georgia 30332, USA. E-mail: Ronghu.Wu@chemistry.gatech.edu; Fax: +1-404-894-7452; Tel: +1-404-385-1515
First published on 26th May 2015
Abstract
Glycoproteins on the cell surface are ubiquitous and essential for cells to interact with the extracellular matrix, communicate with other cells, and respond to environmental cues. Although surface sialoglycoproteins can dramatically impact cell properties and represent different cellular statuses, global and site-specific analysis of sialoglycoproteins only on the cell surface is extraordinarily challenging. An effective method integrating metabolic labeling, copper-free click chemistry and mass spectrometry-based proteomics was developed to globally and site-specifically analyze surface N-sialoglycoproteins. Surface sialoglycoproteins metabolically labeled with a functional group were specifically tagged through copper-free click chemistry, which is ideal because it is quick, specific and occurs under physiological conditions. Sequentially tagged sialoglycoproteins were enriched for site-specific identification by mass spectrometry. Systematic and quantitative analysis of the surface N-sialoglycoproteome in cancer cells with distinctive invasiveness demonstrated many N-sialoglycoproteins up-regulated in invasive cells, the majority of which contained cell adhesion-related domains. This method is very effective to globally and site-specifically analyze N-sialoglycoproteins on the cell surface, and will have extensive applications in the biological and biomedical research communities. Site-specific information regarding surface sialoglycoproteins can serve as biomarkers for disease detection, targets for vaccine development and drug treatment.
Introduction
Glycoproteins on the cell surface are very common and essential in many cellular events, including cell–cell communication, cell–matrix interactions and response to environmental cues.1–3 Surface proteins frequently modulate and represent different developmental and/or diseased statuses of cells.4–6 Aberrant protein glycosylation on the cell surface is directly correlated with disease, such as cancer and infectious diseases.7–9 Due to the relatively easy accessibility, glycoproteins located on the cell surface can be exploited as indicators for cell classification and biomarkers for disease detection.10 Furthermore, they are excellent drug targets for disease treatments, especially emerging and promising immunotherapy utilizing macromolecular antibodies or enzymes serving as drugs.11,12 In fact, the majority of FDA approved drugs target cell surface proteins, including receptors, enzymes and transporters.13Modern mass spectrometry (MS)-based proteomics techniques provide a great opportunity to globally analyze proteins and protein modifications.14–21 However, it is extremely challenging to comprehensively and site-specifically identify glycoproteins because of their low abundance, glycan heterogeneity and dynamic reversible nature.22,23 Furthermore, comprehensive identification of glycoproteins located only on the cell surface is even more challenging because it requires specific separation and enrichment of surface glycoproteins prior to MS analysis.
Glycans covalently bound to glycoproteins also contain valuable information.24,25 Functions and properties of glycoproteins are frequently determined by different types of heterogeneous glycans.26,27 Compared to other naturally occurring monosaccharides, sialic acid is very unique because it carries a negative charge under physiological conditions and contains more hydroxyl groups. Therefore, sialic acid capped at the termini of glycans in glycoproteins can dramatically change glycoprotein properties by increasing the overall negative charge and hydrophilicity. Correspondingly, surface sialoglycoproteins carrying negative charges make cells repel one another and increase cell solubility, which leads to less rigid cell adhesion and enhanced cancer cell invasiveness and metastasis.28–30 Therefore, it is critically important to comprehensively and site-specifically analyze sialoglycoproteins on the cell surface to better understand glycoprotein function and cellular activities. Sialoglycopeptides have reportedly been enriched by TiO2,31 lectins and hydrophilic interaction chromatography,32,33 prior to MS analysis, but none of these enrichment methods are suitable to specifically target sialoglycoproteins located only on the cell surface. The elegant cell surface capturing technique was reported to enrich surface glycoproteins,34 but it is not specific for sialoglycoproteins. Global identification and quantification of surface sialoglycoproteins will provide a better understanding of the roles of glycoproteins in physiological and pathological processes, which will lead to identifying new targets for disease treatment and vaccine development, and discovering effective biomarkers for disease detection and surveillance.9,25,35–37
Here we have integrated metabolic labeling, copper-free click chemistry, and MS-based proteomics to perform the first global identification and quantification of surface N-linked sialoglycoproteins site-specifically. The copper-free click reaction is ideal to tag metabolically labeled surface sialoglycoproteins on living cells because it is quick and specific. More importantly, it occurs under physiological conditions and does not require cytotoxic heavy metal ions. The method developed here was employed to systematically quantify surface N-sialoglycoproteins in cancer cells with distinctive invasiveness. This method can be extensively applied to biochemical, biological and biomedical research.
Results and discussion
The principle of a new method to selectively enrich sialoglycoproteins on the cell surface
Unnatural sugars containing bioorthogonal functional groups have previously been incorporated into proteins to gain insight into biological systems.38–41 The functional groups can be exploited as a chemical handle to separate labeled proteins. In this work, cells were labeled by acetylated N-azidoacetylmannosamine (Ac4ManNAz),42,43 which was converted to sialic acid containing an azido group. Then it was used to modify proteins by sialyltransferases, so that the resultant labeled sialoglycoproteins contained the functional azido group. As shown in Fig. 1, this functional group was employed to tag cell surface N-sialoglycoproteins through a click chemistry reaction under physiological conditions. In order to avoid cytotoxic heavy metal ions as catalysts in the common copper-catalyzed azide-alkyne cycloaddition (CuAAC), we adopted a copper-free click chemistry method based on a strained alkyne i.e. dibenzocyclooctyne (DBCO) to tag surface sialoglycoproteins on living cells under mild physiological conditions.44,45 As a result, sialoglycoproteins containing the azido group on the cell surface were conjugated with DBCO-sulfo-biotin. The mild physiological conditions under which the click reaction was carried out allowed cell surface sialoglycoproteins to be tagged by DBCO-sulfo-biotin while cells were still alive. After the copper-free click reaction, the remaining reagents were washed away. Sequentially cells were lysed, and proteins were extracted and digested. The purified peptides were incubated with NeutrAvidin to enrich any N-sialoglycopeptides tagged by biotin. Finally peptide N-glycosidase F (PNGase F) was employed to remove glycans on Asn in heavy-oxygen water and, as a result, Asn was converted to Asp with an 18O tag for MS analysis.46,47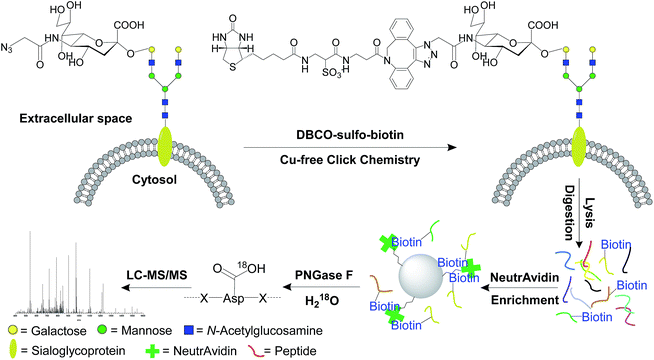 | ||
| Fig. 1 The principle of the site-specific identification of the cell surface N-sialoglycoproteome by integrating metabolic labeling, copper-free click chemistry and MS-based proteomics techniques. | ||
The effectiveness of tagging surface sialoglycoproteins demonstrated by microscopic imaging and gel results
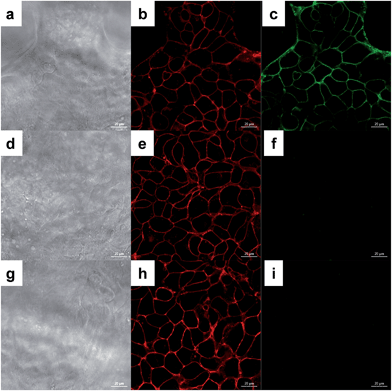
HEK293T cells were used to prove the effectiveness of the surface tagging method. Labeled cells were incubated with DBCO-Fluor545 and DBCO-sulfo-biotin (Fig. 2a–c and S1†) simultaneously. Because neither reagent can penetrate into cells, only surface sialoglycoproteins were bound to Fluor545 and/or biotin, and correspondingly strong red fluorescence was detected on the surface (Fig. 2b). Tiny dots were found inside the cells due to endocytosis in the living cells,48i.e. cell surface sialoglycoproteins tagged by the dye were taken in by cells. Biotin was further bound to streptavidin–fluorescein isothiocyanate (FITC), which resulted in a green signal (Fig. 2c).To further confirm that the method was effective, additional experiments were performed. First, unlabeled cells showed no fluorescence signal (Fig. S2†), which proved that the metabolic labeling worked well. Second, once labeled cells were tagged with DBCO-Fluor545 and further incubated with streptavidin–FITC, we detected strong red signal (Fig. 2e), but no green signal (Fig. 2f) because cells were not treated with DBCO-sulfo-biotin. These results demonstrated that the green signal in Fig. 2c was from the streptavidin–biotin interaction, and not non-specific binding. Third, labeled cells were incubated with DBCO-Fluor545, followed by DBCO-sulfo-biotin, then streptavidin–FITC. The red signal that was only detected (Fig. 2h and i) indicated that no free azido groups remained after incubation with DBCO-Fluor545, and the click reaction was efficient and complete.
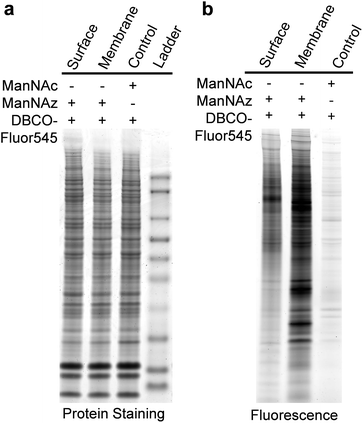
We also ran sodium dodecyl sulfate-polyacrylamide gel electrophoresis (SDS-PAGE) experiments and the results are shown in Fig. 3. SimplyBlue protein staining results showed that every lane contained many similar protein bands (Fig. 3a), but their fluorescence signals were dramatically different, as shown in Fig. 3b. In the right lane of Fig. 3b, minimal fluorescence signal was detected for unlabeled cells. Fewer bands appeared in the left lane for the cell surface sialoglycoproteins than those in the middle lane for membrane proteins of labeled cells, i.e. cytosol components were removed by drilling holes with digitonin so that the reaction reagents could travel into cells. This is consistent with the expectation that the signal intensity is stronger for sialoglycoproteins from the whole cell lysate than the cell surface.
N-sialoglycoprotein site identification in HEK293T cells
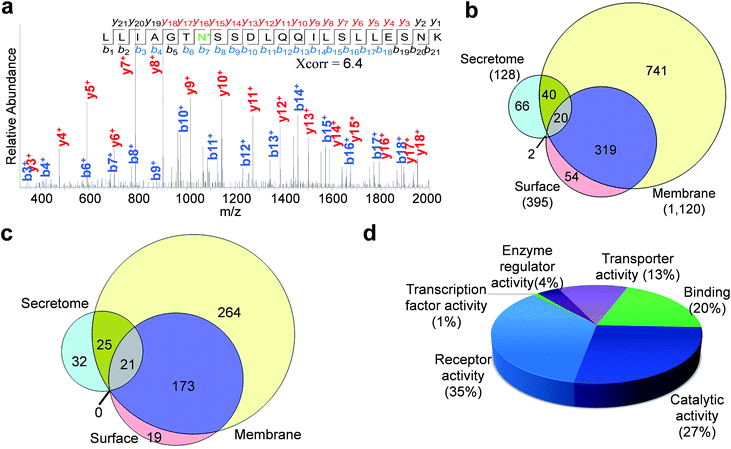
Enriched cell surface samples were subjected to analysis by LC-MS/MS. One example of an identified N-sialoglycopeptide, LLIAGTN*SSDLQQILSLLESNK (* represents the glycosylation site) with a glycosylation site at N381, is shown in Fig. 4a. This peptide is from the protein SLC3A2 (CD98), which is required for the function of light chain amino-acid transporters and mediates integrin signaling.49 Heavy-oxygen labeling allowed us to identify the peptide and localize the glycosylation site confidently. We identified 395 unique N-sialoglycosylation sites on 213 surface proteins in HEK293T cells (Table S1†) (the number refers to protein families, and 213 families include 248 proteins considering isoforms). To confirm that the method is specific for the analysis of surface N-sialoglycoproteins, we ran parallel experiments using both labeled and unlabeled cells. There were no N-sialoglycosylation sites identified in unlabeled cells. This strongly suggests that the method is effective.By using a similar strategy, 128 sites were localized on 78 N-sialoglycoproteins in the secretome (Table S2†). For the membrane protein sample, we confidently identified 1120 N-sialoglycosylation sites on 482 proteins (Table S3†). As listed in the supplemental tables, over 95% of the identified sites contained the consensus motif, NXS/T (X is any amino acid residue except proline).
The overlap of identified sites from these experiments is shown in Fig. 4b. The majority of the sites (339 out of 395) in the cell surface experiment were also identified in the membrane protein experiment. The overlap is very high considering possible variations of large-scale experiments. In contrast, only 22 out of 128 sites in the secretome were also found in the cell surface dataset. It is known that some proteins exist both on the cell surface and in the secretome simultaneously. Almost half of the sites in the secretome (60 sites) were identified in the membrane protein experiment as well. The comparison between the identified N-sialoglycoproteins is displayed in Fig. 4c, and over 90% of cell surface N-sialoglycoproteins were also identified in the membrane protein experiment.
For the 213 surface N-sialoglycoproteins identified in HEK293T cells, the results of molecular function analysis from the Protein ANalysis THrough Evolutionary Relationships (PANTHER) Classification System50 are displayed in Fig. 4d. The largest category is receptor activity (35%), followed by catalytic activity (27%), binding (20%) and transporter activity (13%). These are consistent with the well-known functions of cell surface proteins.
Investigation of the correlation between surface N-sialoglycoproteins and cell invasiveness
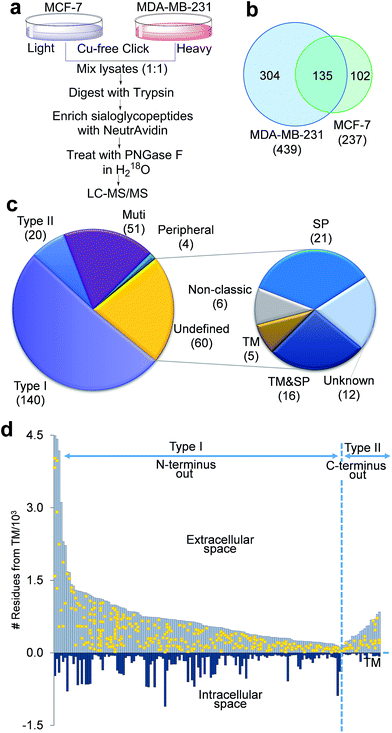
The negative charges carried by surface sialoglycoproteins result in cell–cell repulsion, and correspondingly attenuate cell adhesion, which is correlated with cell invasiveness and mobility. The current method provides a unique opportunity to quantify surface N-sialoglycoproteins globally and site-specifically combined with quantitative proteomics techniques (stable isotope labeling by amino acids in cell culture (SILAC)). Two types of breast cancer cells with distinctive invasiveness were chosen: MCF-7 cells with low invasiveness, and MDA-MB-231 cells which are highly invasive. Even their morphologies are dramatically different (Fig. S3†). The experimental procedure is shown in Fig. 5a. We identified 439 N-sialoglycosylation sites on the MDA-MB-231 surface, which is nearly two times more than those identified in MCF-7 cells (237), and 304 sites were identified exclusively in MDA-MB-231 cells (Fig. 5b, all sites in Table S4†).The number of N-sialoglycoproteins in both types of cells and their overlap are shown in Fig. S4.† Among the 274 surface N-sialoglycoproteins identified in both types of breast cancer cells, about half of them are type I membrane proteins, i.e. the N-terminus extends into the extracellular space, while only 20 are type II, i.e. the C-terminus extends into the extracellular area, as shown in Fig. 5c, based on the information on the UniProt website (http://www.uniprot.org) (Table S5†). These results are consistent with previous reports that type I single-pass membrane proteins are more common than type II in Homo sapiens.51 Normally, peripheral membrane proteins only temporarily adhere to the membrane and tend to be collected in the water-soluble fraction. Here only four identified N-sialoglycoproteins belong to this category, e.g. CLU, GBA, MSN and LRP1. LRP1 is an endocytic receptor involved in endocytosis and in phagocytosis of apoptotic cells. Interestingly it belongs to both the single-pass type I and peripheral membrane protein categories. This is the reason that 275 proteins are shown in Fig. 5c and the total number of identified proteins is 274. About 20% of the cell surface identified N-sialoglycoproteins (51 proteins) are multi-pass membrane proteins, among which several proteins contain over ten transmembrane domains.
There are 60 undefined proteins due to insufficient information available on the UniProt website. In order to determine whether these proteins also contain transmembrane (TM) domains or signal peptides (SP) for protein secretion, we employed SecretomeP and Phobius analysis to perform the computation, and the results are listed in Table S6.† More than one third of these proteins (21) have a TM domain, including 16 of them containing both TM and SP domains. About another third of them (21) contain SP domains, and 6 are non-classic secretory proteins, which may be secreted and located on the cell surface through non-classical protein secretion pathways. These results strongly suggest that the vast majority of these undefined proteins were located on the cell surface. Sialoglycopeptides have reportedly been enriched by TiO2,31 lectins and chromatography,32 but none of these methods can specifically target sialoglycoproteins located only on the cell surface. In this work, we tagged surface sialoglycoproteins using a totally different copper-free click chemistry reaction, which does not require cytotoxic heavy metal ions. Combining the enzymatic reaction, this is the first global and site-specific surface sialoglycoprotein identification. The vast majority of identified sialoglycoproteins are membrane proteins. As shown in Fig. 5c, 232 (84.7%) of 274 identified sialoglycoproteins contain at least one membrane domain, another 21 (7.7%) have signal peptides for secretion and 6 (2.2%) belong to unconventional secreted proteins.
The site location of type I and II proteins are shown in Fig. 5d. All sites were located in the extracellular space, which corresponds to the fact that glycans are typically located in the extracellular section of surface glycoproteins. These results further demonstrate that the current method is effective to specifically target surface N-sialoglycoproteins and that the sialoglycosylation site identification is confident.
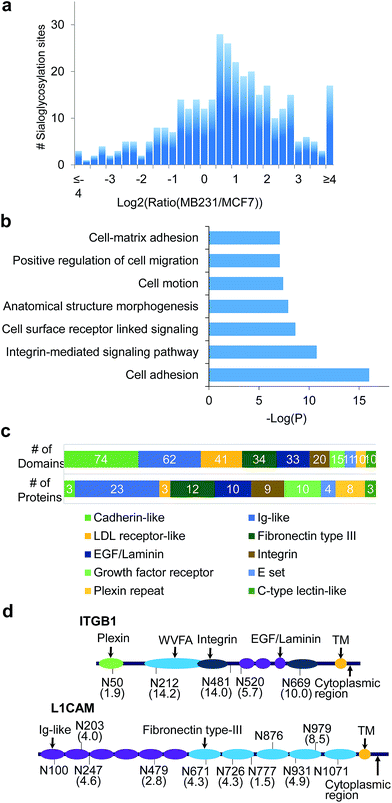
A total of 406 unique N-sialoglycopeptides were quantified in breast cancer cells (Table S7†), and the ratio distribution is shown in Fig. 6a. In invasive cells, 179 peptides, corresponding to 99 proteins, were up-regulated by over 2-fold. In striking contrast, the number of up-regulated sialoglycopeptides was nearly three times more than the number of down-regulated peptides (67 peptides). Among 99 proteins containing up-regulated N-sialoglycopeptides, clustering analysis52 showed that the most highly enriched function was cell adhesion, with a P value of 1.00 × 10⁻¹⁶ (Fig. 6b, glycoproteins in Table S8†). Additionally, proteins corresponding to integrin-mediated signaling, cell motion and cell-matrix adhesion were also enriched. These results strongly suggest that surface sialoglycoproteins are correlated with cell adhesion and mobility.
Domain analysis
Domain analysis was performed for the 99 up-regulated sialoglycoproteins. As listed in Table S9,† we found 68 different types of domains in these sialoglycoproteins, among which the most frequent was the cadherin-like domain (found 74 times) (Fig. 6c). This domain mediates Ca2+-dependent cell–cell adhesion and modulates a wide variety of processes including cell polarization and migration. Three proteins, i.e. FAT1, FAT4 and DSG2, are dominated by this domain. The second most popular (62 times) is the immunoglobulin (Ig)-like domain, which is very common and found in hundreds of proteins with various functions, including antibodies and receptor tyrosine kinases. The Ig-like domain is also involved in protein–protein and protein–ligand interactions, and plays critical roles in cell adhesion and cell surface recognition. About one quarter of up-regulated N-sialoglycoproteins (24 proteins) on the cell surface contain this domain. The next most popular domains among up-regulated N-sialoglycoproteins are LDL receptor-like, fibronectin type III, EGF/laminin, integrin and growth factor receptor domains. Up-regulated N-sialoglycoproteins containing at least one of the important domains are listed in Table S10.† Nine proteins contain the integrin domain. For example, integrin beta-1 (ITDB1 or CD29) contains an integrin domain and several other domains, as shown in Fig. 6d. This protein has been extensively reported to be sialylated in cancer cells and related to cancer cell metastasis.28 In our experiment, five N-sialoglycosylation sites were identified and quantified with ratios between 1.9 and 14.2.The fibronectin type III domain is present in 12 up-regulated N-sialoglycoproteins (Fig. 6c), and is involved in a number of important functions: e.g. cell adhesion, differentiation, migration and tumor metastasis. On these 12 proteins, 28 N-sialoglycosylation sites were quantified, 24 sites were up-regulated by more than 2-fold, and 18 sites were located in the domain. Quantification of N-sialoglycosylation sites required that the quantified peptide contained only one site, and that the ModScore was > 19 to ensure that the site was well-localized. Based on these criteria, 342 N-sialoglycosylation sites on the cell surface were quantified, and they are listed in Table S11.† Almost half of them (145 sites) were up-regulated by over 2-fold and similarly only a small number of N-sialoglycosylation sites (54 sites) were down-regulated. For example, for protein L1CAM (CD171), we identified 11 N-sialoglycosylation sites, among which 10 sites were also listed as predicted sites on the UniProt website, except the site at N931. For this site, the peptide GSGPASEFTFSTPEGVPGHPEALHLECQSN*TSLLLR has an XCorr of 4.5 and mass accuracy of 0.4 ppm, and also contains the consensus motif. This site is significantly up-regulated in invasive cells with a ratio of 4.9. Seven of the eight quantified sites are up-regulated with ratios between 2.8 to 8.5. Two sites are located on the Ig-like domain and five sites are on the fibronectin type III domain, as shown in Fig. 6d. More examples are discussed in the ESI.†
Identification and quantification of CDs
Cell surface molecules known as cluster of differentiation (CD) molecules are very important for differentiation and classification of cells. Traditionally these CDs are targets for immunophenotyping cells,53 and they can have various functions, including receptors, ligands and roles in cell adhesion. To date more than 350 CDs from all different types of human cells have been designated. In our experiments, many CDs were identified and quantified in HEK293T and breast cancer cells. As listed in Table S12,† 325 identified N-sialoglycosylation sites were located on a total of 88 CDs, which is the first systemic identification of N-sialoglycosylation sites on CDs. Among these, 34 CDs were exclusively found in HEK293T cells, and 21 existed only in breast cancer cell lines.A total of 119 N-sialoglycopeptides in 57 CDs (ModScore > 19) were quantified in the cancer cell invasiveness experiments (Table S13†), and some examples are listed in Table 1. More than half of quantified N-sialoglycopeptides (68) in CDs were up-regulated by 2-fold while 11 were down-regulated. . This identification and quantification of N-sialoglycosylation sites in CDs can provide another dimension of information, which can be used to further identify cell type and differentiate cellular status.
The abundance distributions of identified and total CDs are shown in Fig. S5,† and the abundance values were obtained from an on-line database (PaxDb).54 The current enrichment and separation method combined with modern MS-based proteomics techniques is capable of analyzing many CDs with very low abundance, but it is still challenging to identify some CDs with extremely low abundance. By using more starting material and an instrument with higher sensitivity, we will be able to identify more CDs.
| Protein | CD | Site | ModScore | Peptide | Ratio | Xcorr | ppm | Annotation |
|---|---|---|---|---|---|---|---|---|
| a *-N-sialoglycosylation site; #-heavy lysine; @-heavy arginine; ^-oxidized methionine. | ||||||||
| MRC2 | CD280 | 69 | 1000 | VTPACN*TSLPAQR@ | 4.9 | 3.0 | 1.8 | C-type mannose receptor 2 |
| 140 | 1000 | TSN*ISKPGTLER | 7.2 | 2.3 | 0.8 | |||
| LRP1 | CD91 | 446 | 1000 | FN*STEYQVVTR@ | 3.6 | 3.4 | 0.3 | Prolow-density lipoprotein receptor-related protein 1 |
| 1511 | 1000 | WTGHN*VTVVQR@ | 1.6 | 2.8 | −0.8 | |||
| 3089 | 73.3 | MHLN*GSNVQVLHR@ | 3.0 | 4.3 | 1.5 | |||
| PLAUR | CD87 | 222 | 1000 | GN*STHGCSSEETFLIDCR@ | 2.4 | 3.6 | 0.6 | Urokinase plasminogen activator surface receptor |
| IL6ST | CD130 | 157 | 1000 | ETHLETN*FTLK# | 0.6 | 2.4 | 0.4 | Interleukin-6 receptor subunit beta |
| 379 | 97.7 | SHLQN*YTVNATK# | 3.3 | 3.7 | 1.0 | |||
| 390 | 37.5 | LTVN*LTNDR@ | 6.1 | 2.2 | 0.1 | |||
| CD44 | CD44 | 57 | 1000 | AFN*STLPTM^AQMEK# | 11.4 | 2.9 | −0.6 | Receptor for hyaluronic acid, mediates cell-matrix interactions |
| INSR | CD220 | 445 | 1000 | HN*LTITQGK# | 5.0 | 2.9 | 0.5 | Insulin receptor |
| 698 | 1000 | HN*QSEYEDSAGECCSCPK# | 4.1 | 4.9 | 0.5 | |||
| IGF1R | CD221 | 244 | 92.2 | ACTENNECCHPECLGSCSAPDN*DTACVACR | 0.3 | 6.1 | 0.3 | Insulin-like growth factor 1 receptor |
| 747 | 1000 | DVMQVAN*TTMSSR | 0.2 | 3.1 | −0.4 | |||
Conclusions
Considering the importance of surface glycoproteins and extraordinary challenges of their analysis, advancement in the global analysis of surface glycoproteins will have profound implications. The current strategy integrating metabolic labeling, copper-free click chemistry, an enzymatic reaction, and MS-based proteomics techniques provides several advantages. First, we used copper-free click chemistry to tag surface sialoglycoproteins, which does not require cytotoxic heavy metal ions and occurs under mild physiological conditions. Therefore, it is ideal for tagging surface sialoglycoproteins on living cells.55 Second, surface sialoglycoproteins were identified site-specifically, which provides not only valuable site-specific information, but also direct and solid evidence for sialoglycoprotein identification. Third, the vast majority (92.4%) of surface sialoglycoproteins identified in this work contain at least one membrane domain or signal peptide. One limitation of this method is that the experiment is based on metabolic labeling, therefore it is unsuitable for tissue samples. However, model animals such as zebrafish39 and mice55 can be studied with this method. In addition to the site-specific analysis of N-sialoglycoproteins on the cell surface, this method can also be used to analyze the N-sialoglycoproteome in the secretome and whole cell lysates, as reported above.We performed systematic and quantitative analysis of the surface N-sialoglycoproteome on breast cancer cells with distinctive invasiveness, and the results demonstrated that many N-sialoglycopeptides were up-regulated in invasive cells. Up-regulated N-sialoglycoproteins with cell adhesion and motion functions were highly enriched, and cell adhesion-related domains were dominant. This method can be extensively applied to other research studying sialoglycoproteins on the surface of cells, including stem cells and infectious cells. Global and site-specific analysis of surface sialoglycoproteins will potentially lead to identifying new targets for disease treatment and vaccine development, and discovering effective biomarkers for disease detection and surveillance.
Acknowledgements
We are grateful to Dr Gang Bao for generously providing us with the HEK293T and MCF-7 cell lines. This work is supported by the National Science Foundation (CAREER Award, CHE-1454501). R.W. is also supported by the Blanchard Assistant Professorship.Notes and references
- A. Varki, Glycobiology, 1993, 3, 97–130 CrossRef CAS PubMed.
- P. Van den Steen, P. M. Rudd, R. A. Dwek and G. Opdenakker, Crit. Rev. Biochem. Mol. Biol., 1998, 33, 151–208 CrossRef CAS PubMed.
- A. Varki, R. D. Cummings, J. D. Esko, H. H. Freeze, P. Stanley, C. R. Bertozzi, G. W. Hart and M. E. Etzler, Essentials of Glycobiology, Cold Spring Harbor Laboratory Press, Cold Spring Harbor, New York, 2nd edn, 2008 Search PubMed.
- M. D. Mager, V. LaPointe and M. M. Stevens, Nat. Chem., 2011, 3, 582–589 CrossRef CAS PubMed.
- J. W. Dennis, M. Granovsky and C. E. Warren, BioEssays, 1999, 21, 412–421 CrossRef CAS PubMed.
- J. P. C. da Cunha, P. A. F. Galante, J. E. de Souza, R. F. de Souza, P. M. Carvalho, D. T. Ohara, R. P. Moura, S. M. Oba-Shinja, S. K. N. Marie, W. A. Silva, R. O. Perez, B. Stransky, M. Pieprzyk, J. Moore, O. Caballero, J. Gama-Rodrigues, A. Habr-Gama, W. P. Kuo, A. J. Simpson, A. A. Camargo, L. J. Old and S. J. de Souza, Proc. Natl. Acad. Sci. U. S. A., 2009, 106, 16752–16757 CrossRef CAS PubMed.
- S. Kaur, S. Kumar, N. Momi, A. R. Sasson and S. K. Batra, Nat. Rev. Gastroenterol. Hepatol., 2013, 10, 607–620 CrossRef CAS PubMed.
- M. E. Giorgi and R. M. de Lederkremer, Carbohydr. Res., 2011, 346, 1389–1393 CrossRef PubMed.
- D. H. Dube and C. R. Bertozzi, Nat. Rev. Drug Discovery, 2005, 4, 477–488 CrossRef CAS PubMed.
- G. Varady, J. Cserepes, A. Nemeth, E. Szabo and B. Sarkadi, Biomarkers Med., 2013, 7, 803–819 CrossRef CAS PubMed.
- A. M. Scott, J. D. Wolchok and L. J. Old, Nat. Rev. Cancer, 2012, 12, 278–287 CrossRef CAS PubMed.
- M. X. Sliwkowski and I. Mellman, Science, 2013, 341, 1192–1198 CrossRef CAS PubMed.
- M. A. Yildirim, K. I. Goh, M. E. Cusick, A. L. Barabasi and M. Vidal, Nat. Biotechnol., 2007, 25, 1119–1126 CrossRef CAS PubMed.
- J. R. Yates, J. Am. Chem. Soc., 2013, 135, 1629–1640 CrossRef CAS PubMed.
- E. S. Witze, W. M. Old, K. A. Resing and N. G. Ahn, Nat. Methods, 2007, 4, 798–806 CrossRef CAS PubMed.
- R. H. Wu, W. Haas, N. Dephoure, E. L. Huttlin, B. Zhai, M. E. Sowa and S. P. Gygi, Nat. Methods, 2011, 8, 677–683 CrossRef CAS PubMed.
- D. H. Phanstiel, J. Brumbaugh, C. D. Wenger, S. L. Tian, M. D. Probasco, D. J. Bailey, D. L. Swaney, M. A. Tervo, J. M. Bolin, V. Ruotti, R. Stewart, J. A. Thomson and J. J. Coon, Nat. Methods, 2011, 8, 821–U884 CrossRef CAS PubMed.
- D. F. Zielinska, F. Gnad, J. R. Wisniewski and M. Mann, Cell, 2010, 141, 897–907 CrossRef CAS PubMed.
- L. Z. Dai, C. Peng, E. Montellier, Z. K. Lu, Y. Chen, H. Ishii, A. Debernardi, T. Buchou, S. Rousseaux, F. L. Jin, B. R. Sabari, Z. Y. Deng, C. D. Allis, B. Ren, S. Khochbin and Y. M. Zhao, Nat. Chem. Biol., 2014, 10, 365–373 CrossRef CAS PubMed.
- S. Lemeer and A. J. R. Heck, Curr. Opin. Chem. Biol., 2009, 13, 414–420 CrossRef CAS PubMed.
- A. Nandi, R. Sprung, D. K. Barma, Y. X. Zhao, S. C. Kim, J. R. Falck and Y. M. Zhao, Anal. Chem., 2006, 78, 452–458 CrossRef CAS PubMed.
- H. Zhang, X. J. Li, D. B. Martin and R. Aebersold, Nat. Biotechnol., 2003, 21, 660–666 CrossRef CAS PubMed.
- R. G. Spiro, Glycobiology, 2002, 12, 43R–56R CrossRef CAS PubMed.
- R. Raman, S. Raguram, G. Venkataraman, J. C. Paulson and R. Sasisekharan, Nat. Methods, 2005, 2, 817–824 CrossRef CAS PubMed.
- S. R. Stowell, C. M. Arthur, R. McBride, O. Berger, N. Razi, J. Heimburg-Molinaro, L. C. Rodrigues, J. P. Gourdine, A. J. Noll, S. von Gunten, D. F. Smith, Y. A. Knirel, J. C. Paulson and R. D. Cummings, Nat. Chem. Biol., 2014, 10, 470–476 CrossRef CAS PubMed.
- P. R. Crocker, J. C. Paulson and A. Varki, Nat. Rev. Immunol., 2007, 7, 255–266 CrossRef CAS PubMed.
- G. W. Hart and R. J. Copeland, Cell, 2010, 143, 672–676 CrossRef CAS PubMed.
- M. J. Schultz, A. F. Swindall and S. L. Bellis, Cancer Metastasis Rev., 2012, 31, 501–518 CrossRef CAS PubMed.
- C. Bull, M. A. Stoel, M. H. den Brok and G. J. Adema, Cancer Res., 2014, 74, 3199–3204 CrossRef PubMed.
- Y. Tian, F. J. Esteva, J. Song and H. Zhang, Mol. Cell. Proteomics, 2012, 11 DOI:10.1074/mcp.M111.011403.
- M. R. Larsen, S. S. Jensen, L. A. Jakobsen and N. H. H. Heegaard, Mol. Cell. Proteomics, 2007, 6, 1778–1787 CAS.
- M. Thaysen-Andersen, M. R. Larsen, N. H. Packer and G. Palmisano, RSC Adv., 2013, 3, 22683–22705 RSC.
- J. Wu, X. L. Xie, S. Nie, R. J. Buckanovich and D. M. Lubman, J. Proteome Res., 2013, 12, 3342–3352 CrossRef CAS PubMed.
- B. Wollscheid, D. Bausch-Fluck, C. Henderson, R. O'Brien, M. Bibel, R. Schiess, R. Aebersold and J. D. Watts, Nat. Biotechnol., 2009, 27, 378–386 CrossRef CAS PubMed.
- M. M. Fuster and J. D. Esko, Nat. Rev. Cancer, 2005, 5, 526–542 CrossRef CAS PubMed.
- M. A. Wolfert and G. J. Boons, Nat. Chem. Biol., 2013, 9, 776–784 CrossRef CAS PubMed.
- J. E. Hudak and C. R. Bertozzi, Chem. Biol., 2014, 21, 16–37 CrossRef CAS PubMed.
- H. C. Hang, C. Yu, D. L. Kato and C. R. Bertozzi, Proc. Natl. Acad. Sci. U. S. A., 2003, 100, 14846–14851 CrossRef CAS PubMed.
- S. T. Laughlin, J. M. Baskin, S. L. Amacher and C. R. Bertozzi, Science, 2008, 320, 664–667 CrossRef CAS PubMed.
- L. Yang, J. O. Nyalwidhe, S. Guo, R. R. Drake and O. J. Semmes, Mol. Cell. Proteomics, 2011, 10, M110007294 Search PubMed.
- M. Grammel and H. C. Hang, Nat. Chem. Biol., 2013, 9, 475–484 CrossRef CAS PubMed.
- S. T. Laughlin and C. R. Bertozzi, Nat. Protoc., 2007, 2, 2930–2944 CrossRef CAS PubMed.
- A. A. Neves, H. Stockmann, R. R. Harmston, H. J. Pryor, I. S. Alam, H. Ireland-Zecchini, D. Y. Lewis, S. K. Lyons, F. J. Leeper and K. M. Brindle, FASEB J., 2011, 25, 2528–2537 CrossRef CAS PubMed.
- A. Kuzmin, A. Poloukhtine, M. A. Wolfert and V. V. Popik, Bioconjugate Chem., 2010, 21, 2076–2085 CrossRef CAS PubMed.
- C. S. McKay and M. G. Finn, Chem. Biol., 2014, 21, 1075–1101 CrossRef CAS PubMed.
- H. Kaji, H. Saito, Y. Yamauchi, T. Shinkawa, M. Taoka, J. Hirabayashi, K. Kasai, N. Takahashi and T. Isobe, Nat. Biotechnol., 2003, 21, 667–672 CrossRef CAS PubMed.
- B. Küster and M. Mann, Anal. Chem., 1999, 71, 1431–1440 CrossRef.
- M. N. Levine, T. T. Hoang and R. T. Raines, Chem. Biol., 2013, 20, 614–618 CrossRef CAS PubMed.
- C. C. Feral, N. Nishiya, C. A. Fenczik, H. Stuhlmann, M. Slepak and M. H. Ginsberg, Proc. Natl. Acad. Sci. U. S. A., 2005, 102, 355–360 CrossRef CAS PubMed.
- P. D. Thomas, M. J. Campbell, A. Kejariwal, H. Y. Mi, B. Karlak, R. Daverman, K. Diemer, A. Muruganujan and A. Narechania, Genome Res., 2003, 13, 2129–2141 CrossRef CAS PubMed.
- A. Kanapin, S. Batalov, M. J. Davis, J. Gough, S. Grimmond, H. Kawaji, M. Magrane, H. Matsuda, C. Schonbach, R. D. Teasdale, Z. Yuan, R. G. Grp and G. S. L. Memebers, Genome Res., 2003, 13, 1335–1344 CrossRef CAS PubMed.
- D. W. Huang, B. T. Sherman and R. A. Lempicki, Nat. Protoc., 2009, 4, 44–57 CrossRef CAS PubMed.
- H. Zola, B. Swart, A. Banham, S. Barry, A. Beare, A. Bensussan, L. Boumsell, C. D. Buckley, H. J. Buhring, G. Clark, P. Engel, D. Fox, B. Q. Jin, P. J. Macardle, F. Malavasi, D. Mason, H. Stockinger and X. F. Yang, J. Immunol. Methods, 2007, 319, 1–5 CrossRef CAS PubMed.
- M. Wang, M. Weiss, M. Simonovic, G. Haertinger, S. P. Schrimpf, M. O. Hengartner and C. von Mering, Mol. Cell. Proteomics, 2012, 11, 492–500 CAS.
- P. V. Chang, J. A. Prescher, E. M. Sletten, J. M. Baskin, I. A. Miller, N. J. Agard, A. Lo and C. R. Bertozzi, Proc. Natl. Acad. Sci. U. S. A., 2010, 107, 1821–1826 CrossRef CAS PubMed.
Footnote |
| † Electronic supplementary information (ESI) available: Supplementary text and references, six supplementary figures, and thirteen supplementary tables. See DOI: 10.1039/c5sc01124h |
| This journal is © The Royal Society of Chemistry 2015 |

