
 Open Access Article
 This Open Access Article is licensed under a Creative Commons Attribution-Non Commercial 3.0 Unported Licence
Engineering a FRET strategy to achieve a ratiometric two-photon fluorescence response with a large emission shift and its application to fluorescence imaging†
Lin
Yuan
*a,
Fangping
Jin
a,
Zebing
Zeng
*a,
Chengbin
Liu
a,
Shenglian
Luo
a and
Jishan
Wu
b
aState Key Laboratory of Chemo/Biosensing and Chemometrics, College of Chemistry and Chemical Engineering, Hunan University, Changsha 410082, P. R. China. E-mail: lyuan@hnu.edu.cn; zbzeng@hnu.edu.cn
bDepartment of Chemistry, National University of Singapore, 3 Science Drive 3, 117543, Singapore
First published on 28th January 2015
Abstract
Two-photon excitation (TPE) probe-based fluorescence imaging has become one of the most attractive diagnostic techniques to investigate biomolecules and biological events in live cells and tissues. At the current stage most of the TPE-based sensing is reflected by fluorescence intensity changes. Nevertheless the mere altering of intensity could be facilely affected by ambient conditions. On the other hand, TPE probes based on an intramolecular charge transfer (ICT) strategy could solve this problem to some extent with a morphology change-induced emission shift. However their applications are yet constrained due to the inherent limitation of ICT, e.g. the high degree of overlap of two emissions bands and shifts of the TPE maxima. To achieve the desired TPE-based sensing and to circumvent the problems stated above, we adapted a Förster resonance energy transfer (FRET) strategy to develop small molecule ratiometric TPE fluorescent probes. Our FRET-based ratiometric TPE fluorescent probe displays a remarkable emission shift (up to 125 nm) with two well-resolved emission bands. Hence the ratio of these two emission bands could enable the measurement of fluorescence changes more accurately, thus further improving imaging in live cells and deep tissues. To the best of our knowledge, the current reported probe has the largest emission shift among all the small molecule ratiometric TPE fluorescent probes while the maximum TPE wavelength remains unchanged. This work has provided a FRET approach to fabricate novel small molecule ratiometric TPE fluorescent probes that improve imaging in deep tissues.
Introduction
Small molecule fluorescent probes have been intensely pursued in chemical biology research and medical diagnosis during the past thirty years because of their properties, such as the ability to improve analytical sensitivity, and in particular their ability to offer capability for in vivo imaging studies with high spatiotemporal resolution.1–4 Among the numerous molecular imaging techniques, two-photon excitation (TPE) probe-based fluorescence imaging stands out extraordinarily as a result of its advantages for studying targeted biological molecules and biological events in live cells and deep tissues.5,6 In addition to the advantages of conventional techniques such as those of superior sensitivity/selectivity, and non-invasiveness, TPE imaging is prominent for its deeper tissue penetration capability and substantially lower photo-bleaching and photo-damage of the tissue, in virtue of the usage of low energy near infrared excitation.7,8High resolution TPE imaging is mostly attributed to the development of satisfactory TPE fluorescent probes. To date, a large number of TPE fluorescent imaging probes have been developed that have greatly contributed to biomedical research.5,6 However, most of the reported TPE sensing and imaging methods rely on fluorescence intensity changes, which are easily influenced by many factors, including photo-bleaching, microenvironments (e.g. pH, polarity, temperature, and so forth), and local probe concentrations. An effective strategy to overcome this shortcoming is the use of ratiometric fluorescent probes with concomitant changes in the intensities at dual-emission or dual-excitation bands.9 Ratiometric TPE fluorescent probes based on intramolecular charge transfer (ICT) strategy have been disclosed in the literature,10–16 where the background interference and false positive results were possibly weak. A few types of ICT probe exhibited extraordinary properties and were applied in cell or tissue imaging. Unfortunately, these ICT-based probes are usually affected by certain undesirable photo-physical properties, which constrain their full potential for applications. For instance, in many cases the ICT-based probes exhibit relatively broad emission spectra, whereas their emission shift before and after interaction with the target bio-molecules is not prominent enough, thus resulting in a significant overlap between the shifted emission bands. This phenomenon severely limits the accurate measurement of the ratio of the two emission bands. Furthermore, to choose a suitable TPE wavelength/source for these probes remains challenging as the maximum TPE wavelength also strongly fluctuates/shifts before and after reaction. Accordingly, we have to sacrifice one band of fluorescence brightness and irradiate at the excitation maxima of the other band; or we would equally sacrifice both bands of fluorescence brightness by irradiating at the iso-excitation point to achieve two-photon ratiometric imaging. Therefore, given the weaknesses of ICT-based fluorescence probes, a brand new strategy to design and develop small-molecule ratiometric TPE probes with improved resolution of both emission bands and unchanged TPE wavelengths for imaging in live cells and deep tissues is still highly demanded.
In view of the defects of the ICT strategy that utilizes a single fluorophore to acquire ratiometric effects, we turned our attention to Förster resonance energy transfer (FRET). The FRET phenomenon involves the non-radiative transfer of excitation energy from an excited donor to a proximal ground-state acceptor.17,18 The advantage of FRET-based ratiometric probes over ICT probes lies in their superior emission shifts with fixed excitation wavelengths.17,18 Surprisingly, although many FRET-based one-photon ratiometric fluorescent probes17–29 and two-photon energy transfer cassettes30–33 have been reported, to the best of our knowledge, there is no FRET-based small molecule ratiometric TPE fluorescent probe for deep-tissue imaging of specific biomolecules.
Herein we report the design of a simple yet efficient small molecule ratiometric TPE fluorescent probe based on a FRET strategy by considering the following prerequisites: (1) a large emission shift (>80 nm) with two-well resolved emission bands before and after interaction with the analytes of interest; (2) a significant TPE cross-section with constant maximum TPE wavelength for bright TPE imaging; (3) appreciable water solubility for cell/tissue permeability and staining; (4) a remarkable ratiometric response. Aiming at these targets, a TPE FRET cassette was constructed to develop a ratiometric fluorescent probe for hydrogen sulphide (H2S). Notably, this probe demonstrated distinguished improvements in ratiometric fluorescent response with a large emission shift (up to 125 nm) and comparative fluorescence intensity. Moreover, the maximum TPE wavelength (donor moiety) of this probe barely shifted before and after interaction with H2S. This probe was further applied for practical H2S imaging in live cells and tissues in two-photon ratiometric mode. Hence in summary, such FRET probes provide a new opportunity for biomedical researchers to explore accurate two-photon imaging using ratiometric TPE fluorescent probes with well-resolved emission spectra.
Results and discussion
Design and synthesis
Our design strategy for the ratiometric TPE fluorescent probe is to modulate TPE FRET efficiency in a two fluorophore cassette comprised of a well-known acedan (2-acetyl-6-dialkylaminonaphthalene)34 moiety as a two-photon excitation donor and a H2S-responsive anthocyanidin-analogue dye as an acceptor, linked by a rigid spacer. The two-photon fluorescence spectrum of acedan 2 matches well with the absorption spectrum of dye 6 (Fig. S1a†), but the gap between their emission bands is very large (130 nm) (Fig. S1a in ESI†). In addition, both 6 (Φ = 0.55) and 2 (Φ = 0.47) have substantial fluorescence quantum yields. These two factors are crucial for effective FRET-based ratiometric fluorescent probes with superior emission shift and comparative fluorescence intensity. In the absence of H2S, the acceptor shows a strong absorption in the acedan emission region and two-photon excitation of the donor chromophore should result in red acceptor emission by TPE-FRET. However, upon selective reaction with H2S, the conjugated structure of the acceptor is interrupted (Fig. S2 in ESI†), resulting in the decrease of the absorption of the acceptor in the donor emission region (Fig. S1b in ESI†). Thus the FRET process is suppressed, and a green emission increase is expected on excitation of the donor.Probe TR-H2S was facilely synthesized by the route shown in Scheme 1. The intermediate 3 was prepared in 78% yield by the coupling reaction between compound 1 (ref. 35) and 4-(N-Boc-amino)piperidine, followed by hydrolysis. Acceptor 6 was synthesized through a two-step reaction route. Reaction of compound 4 with tert-butyl bromoacetate under basic conditions yielded compound 5, which was further treated with 4-(diethylamino)salicylaldehyde in acidic conditions to produce compound 6. Finally, TR-H2S was obtained by coupling 3 with 6 in 74% yield. All the new intermediates and the resulting probe TR-H2S were well characterized by 1H NMR, 13C NMR, HPLC-MS, and HRMS (ESI†).
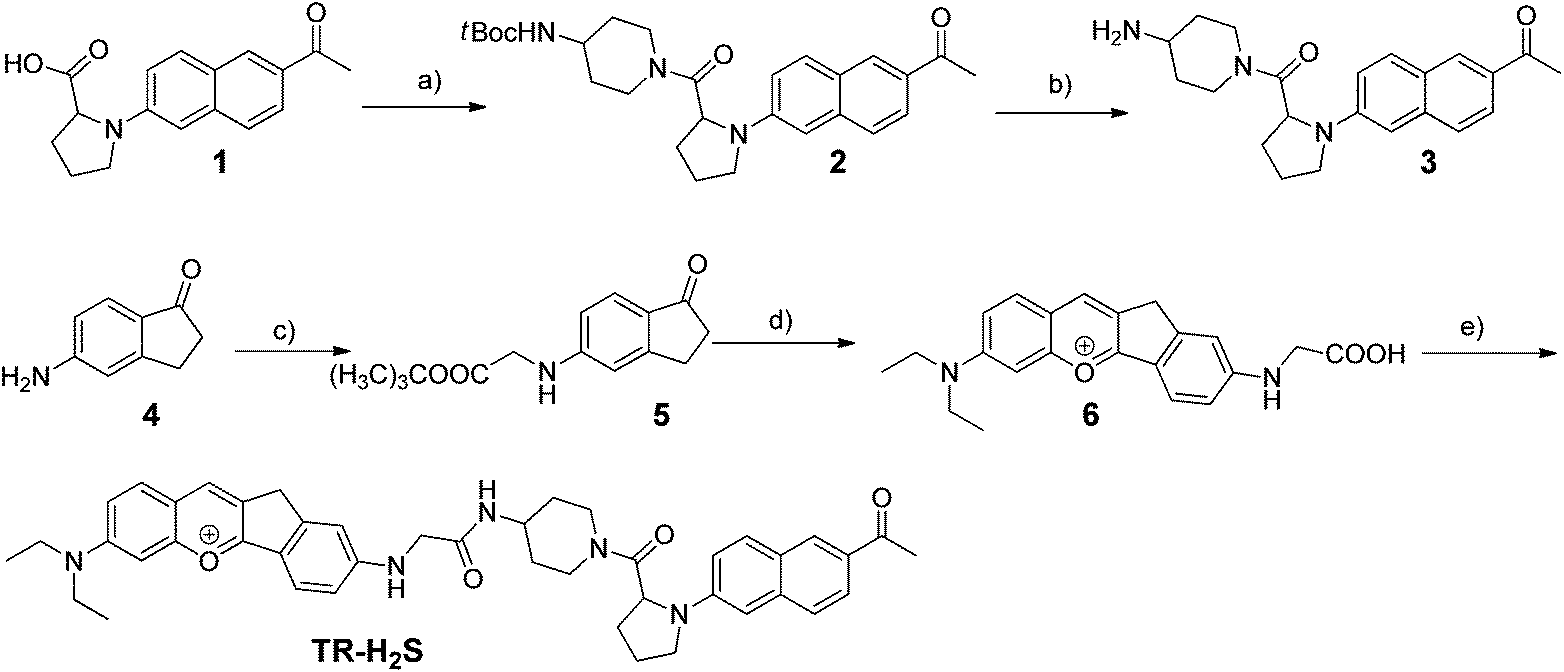 | ||
| Scheme 1 Synthesis of probe TR-H2S. Reaction conditions: (a) 4-(N-Boc-amino)piperidine, EDC·HCl, HOBt; (b) CF3COOH/CH2Cl2; (c) K2CO3, BrCH2CO2C(CH3)3; (d) 4-(diethylamino)salicylaldehyde, MeSO3H; (e) 3, EDC·HCl, HOBt. EDC·HCl = 1-ethyl-3-(3-dimethylaminopropyl) carbodiimide hydrochloride, HOBt = 1-hydroxybenzotriazole. | ||
Spectral properties
The absorption spectra, as well as the two- and one-photon induced emission spectra of TR-H2S in MeOH are illustrated in Fig. 1 and Fig. S3 (ESI†). The absorption spectra of TR-H2S show maxima at 378 and 578 nm, characteristic of the donor and acceptor components, respectively (Fig. 1a). Irradiation of TR-H2S at 378 (one-photon) or 760 nm (two-photon) resulted in emission mainly from the acceptor component with a maximum at around 620 nm and a minor band at around 490 nm (Fig. 1b and S3 in ESI†). This result is consistent with FRET from the two-photon acedan donor to the anthocyanidin-analogue acceptor, indicating superior energy transfer efficiency (>97%, by comparing the emission intensity of donor dye 2 and the residual emission of the donor in FRET dyes). The high energy transfer efficiency was further reinforced by the excellent spectroscopic overlap between the normalized excitation and absorption spectra of TR-H2S (Fig. S4 in ESI†).36,37 In addition, the fluorescence intensity of TR-H2S is 2.6-fold brighter than the acceptor dye 6 upon irradiation at 760 nm (Fig. 1b). | ||
Fig. 1 The absorption (a) and two-photon (λex = 760 nm) induced emission spectra (b) of TR-H2S ( ), 2 ( ), 2 ( ), and 6 ( ), and 6 ( ) at 25 °C in MeOH. Emission at around 500 nm is quenched (>97%) upon excitation of TR-H2S at 760 nm compared to excitation of 2 at 760 nm. ) at 25 °C in MeOH. Emission at around 500 nm is quenched (>97%) upon excitation of TR-H2S at 760 nm compared to excitation of 2 at 760 nm. | ||
We then investigated the spectral response of the probe to H2S. As expected, once H2S was added to the probe solution, the fluorescence tint changed from crimson to green (inset in Fig. 2a), while the emission wavelength was measured to shift from 620 nm to 497 nm upon excitation at 378 nm. This is because the nucleophilic attack of H2S towards the benzopyrylium moiety of the acceptor interrupts its π-conjugation, thereby leading to a decrease in acceptor absorption (Fig. 2b) as well as a decrease in FRET efficiency.38 To further examine the H2S-based quenching mechanism, HPLC-MS was used to clarify the mechanism of the reaction between 6 and Na2S. The HPLC chromatogram of 6 is shown in Fig. S2a (ESI†). After incubation with Na2S for 1 min (Fig. S2b in ESI†), a new peak with a longer retention time was observed, which was attributed to the formation of a neutral 6–SH adduct deduced through mass spectra (Fig. S2c in ESI†). The proposed neutral 6–SH product was further supported by 1H NMR titration studies (Fig. S2d in ESI†), which showed that almost all aromatic proton signals shifted up-field upon addition of Na2S to the solution of compound 6.
 | ||
Fig. 2 Spectra of TR-H2S (5 μM) upon titration of H2S (Na2S, 0–200 μM) in phosphate buffered saline (PBS) buffer (pH = 7.4, 2% DMSO, 1 mg mL−1 human serum albumin (HSA)): (a) one-photon excitation emission spectra (λex = 378 nm); (b) absorption spectra; (c) two-photon excitation emission spectra (λex = 760 nm). (d) Two-photon absorption cross section of TR-H2S in the absence ( ) and presence of H2S ( ) and presence of H2S ( ) (200 μM). ) (200 μM). | ||
We further investigated the concentration dependent fluorescence response of probe TR-H2S to H2S under the two-photon (760 nm) excitation model. As shown in Fig. 2c, upon addition of Na2S (0–200 μM), the emission intensity at 625 nm gradually decreased with the simultaneous appearance of a new blue emission peak centred at 500 nm. Meanwhile a clear iso-emission point was observed at 588 nm. Essentially, the intensity ratio (I500/I625) lineally increased when the concentration of Na2S changed from 1 to 80 μM whereas the detection limit was determined to be 0.3 μM based on a signal-to-noise ratio (S/N) = 3 (Fig. S5 in ESI†), and the highest intensity ratio (I500/I625) change with a 796-fold enhancement was achieved by the addition of 200 μM Na2S. Impressively, the shift of two emission bands is very large (emission shift: Δλ = 125 nm) with comparative fluorescence intensity, thus generating two well-resolved emission bands. This resolution is beneficial for accurate two-photon imaging owing to the very large ratiometric value induced by the remarkable intensities of the two emission bands. This very large emission shift is distinctively larger than that associated with through-bond energy transfer (TBET)-based ratiometric TPE probes.39 To the best of our knowledge, it has the largest emission shift for small molecule ratiometric TPE fluorescent probes. The observation validates our design concept that FRET is an efficient strategy to develop ratiometric TPE fluorescent probes with large emission shifts and well resolved emission bands. It is noteworthy that the maximum two-photon excitation wavelength of the donor moieties at 760 nm remains fixed (Fig. 2d), which is significantly superior than ratiometric TPE probes based on ICT, thus the FRET probe is more suitable for accurate two-photon imaging. The different photobleaching rates of the donor and acceptor components of FRET-based probes can affect the donor–acceptor ratio, and thus would bias ratiometric measurements. Thus, we measured the fluorescence intensity of acedan 2 and anthocyanidin 6 after exposure to light. As shown in Fig. S6a (ESI†), the relative fluorescence intensity of both 2 and 6 gradually decreased after lengthy exposure to UV light (80 W, 365 nm). However, the relative fluorescence intensity of both 2 and 6 remained was almost unchanged after exposure to femtosecond laser irradiation (80 W, 760 nm) (Fig. S6b in ESI†). This is because the photobleaching of the dyes is less likely to occur within the restricted excitation volume, characteristic of two-photon excitation.40 As expected, the emission ratio of probe TR-H2S almost unchanged after exposure at 760 nm (80 W) for 40 min (Fig. S6c in ESI†). The above results suggest that FRET-based ratiometric TPE fluorescent probes are less affected by photobleaching, and are thereby more suitable for bioimaging applications.
The ratio change of probe TR-H2S upon addition of H2S was very fast and reached a plateau within 30 seconds (Fig. S7 in ESI†), suggesting that TR-H2S enables real-time tracking of H2S concentration changes. Moreover, TR-H2S can respond to H2S at a biologically relevant pH level (Fig. S8 in ESI†). Thus, we further evaluated the specific nature of this probe by co-incubation with relevant reactive sulfur (RSS), oxygen (ROS), and nitrogen species (RNS), along with some cations and anions. As shown in Fig. 3, only H2S could lead to pronounced enhancement of the fluorescence intensity ratio (I500/I625). Other biologically relevant RSS (GSH, cysteine, SO42−, S2O3−, SCN−), RNS (NO2−, NO3−, NO, NH3·H2O), ROS (t-BuOOH, H2O2, O2−˙, HO˙, HOCl), amino acids without thiol groups (Lys, Glu), metal ions and anions (Ca2+, K+, Na+, Zn2+, Mg2+, N3−, CN−) showed minimal interference (Fig. 3). The excellent selectivity enables TR-H2S to suitably detect H2S in rather complex biological environments. The high selectivity of TR-H2S for H2S over other biological thiols can be rationalized on the basis of the different pKa values of thiols and electrostatic repulsion. It has been reported that H2S in aqueous solution has a pKa value lower than 6.9 whereas other biothiols have higher pKa values (e.g. Cys, 8.30; GSH, 9.20).41 Thus, H2S is a better nucleophile than other biothiols under physiological media. In addition, both the TR-H2S probe and Cys or GSH have a cationic group, which will prevent their effective collisions (Fig. S9 in ESI†).38 This high selectivity of positively charged dye TR-H2S for H2S over other biothiols is in good agreement with previous reports.38,42
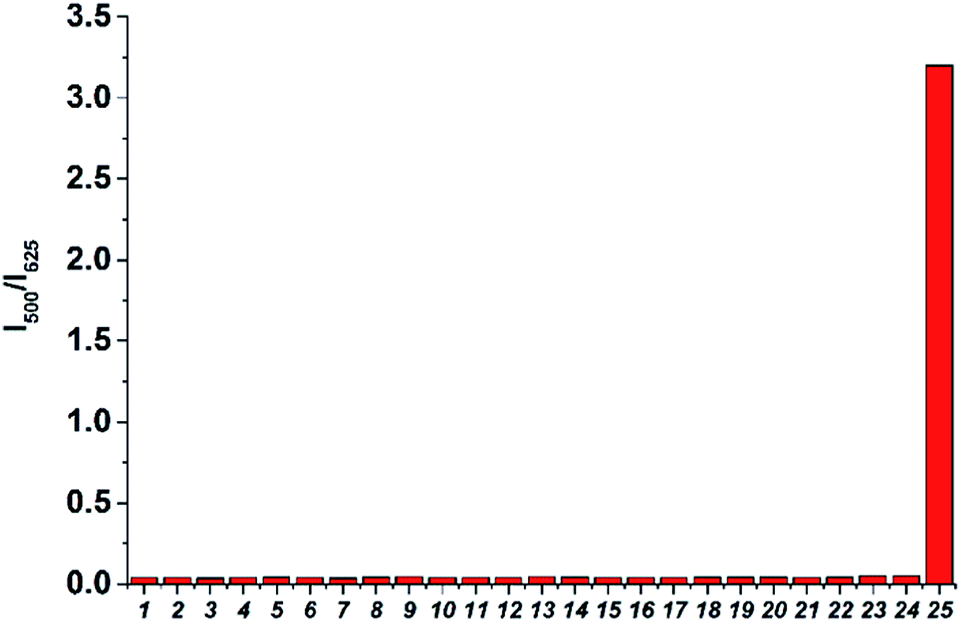 | ||
| Fig. 3 Fluorescence intensity ratio (I500/I625) responses of probe TR-H2S (2 μM) to representative species in PBS buffer (pH = 7.4, 2% DMSO, 1 mg mL−1 HSA). (1) Free, (2) tBuOOH (200 μM), (3) NO (200 μM), (4) and (5) H2O2 (200 μM), (6) KO2 (200 μM), (7) Lys (200 μM), (8) HOCl (100 μM), (9) NH3·H2O (200 μM), (10) ˙OH (hydroxyl radical) (200 μM), (11) NO2− (200 μM), (12) NO3− (200 μM), (13) Glu (200 μM), (14) N3− (200 μM), (15) CN−(200 μM), (16) K+ (5 mM), (17) Na+ (5 mM), (18) Ca2+ (1 mM), (19) Zn2+ (1 mM), (20) Mg2+ (500 μM), (21) S2O32− (200 μM), (22) SCN− (100 μM), (22) SO42− (500 μM), (23) Cys (1 mM), (24) GSH (5 mM), (25) H2S (100 μM). | ||
The properties of probe TR-H2S and some previously published small-molecule ratiometric fluorescent H2S probes based on ICT,10,38,42–49 FRET50,51 and excited state intramolecular proton transfer (ESIPT)52–55 mechanisms are summarized in Table S1,† in which all of the probes have moderate selectivity for H2S over other biothiols. The fluorescence detection limit of probe TR-H2S was 0.3 μM (Table S1, ESI†), which is comparable with most ratiometric H2S probes. However, probe TR-H2S collectively displays several unique advantages, such as its large emission shift (125 nm), unchanged maximum low energy TPE wavelength (760 nm) and the fact that both emission bands are located in the long wavelength region (500–630 nm).
Cell and tissue imaging
Overall, probe TR-H2S displays a high selectivity and fast response towards H2S at physiological pH accompanied with two well-resolved emission bands. In addition, probe TR-H2S also displays negligible toxicity through an MTT assay (Fig. S10 in ESI†). The above results suggest that TR-H2S is promising for applications in biological systems. We then tested the capability of probe TR-H2S for ratiometric imaging of H2S in living cells and tissue. We first investigated whether this probe can be applied to fluorescence imaging of deep tissues before and after interaction with the H2S. As shown in Fig. S11 and 12 (ESI†), rat liver tissue samples incubated with only probe TR-H2S (Fig. S11†) or incubated with TR-H2S for 30 minutes and then further incubated with H2S (Fig. S12†) showed a strong red or green fluorescence at 90–180 μM by TPM, respectively. Therefore, TR-H2S possesses good tissue penetration, and could be useful for the dual-colour imaging of deep tissue.Liver slices incubated with TR-H2S displayed a strong fluorescence in the red channel (Fig. 4b) and slight fluorescence in the green channel (Fig. 4a). However, in the presence of H2S, a partial quenching of the fluorescence in the red channel (Fig. 4e) and a remarkable increase of fluorescence in the green channel (Fig. 4d) were observed. Thus, the ratio data, which was obtained using commercial software, significantly increased (Fig. 4c–f and S13 in ESI†). A similar phenomenon was also observed for cell imaging (Fig. S14 in ESI†). These experiments indicated that probe TR-H2S can provide ratiometric TPE detection of H2S at cell and tissue level with less cross-talk between dual emission channels. Therefore, probe TR-H2S has the potential to serve as an efficient molecular probe for the study of biological processes involving H2S within live cells and tissue.
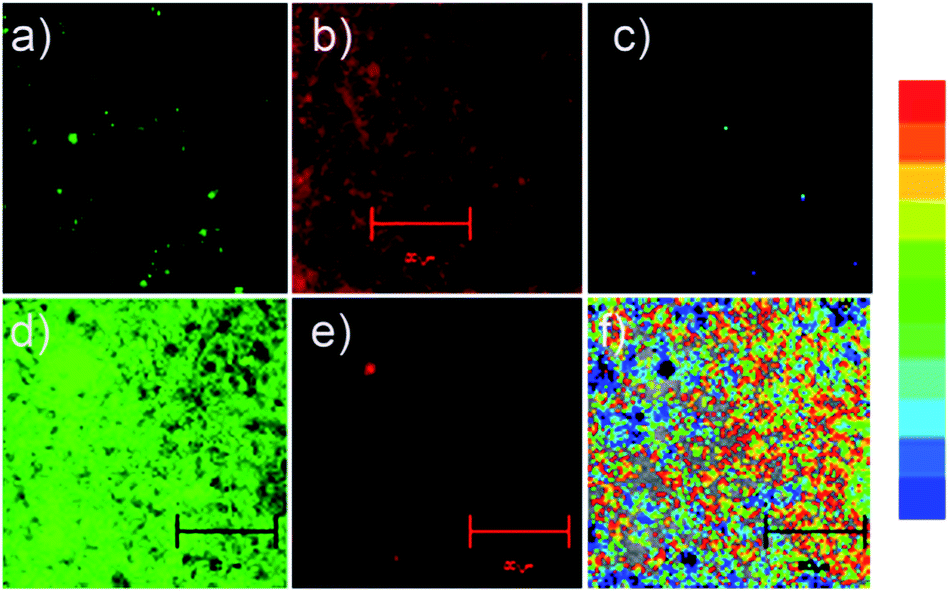 | ||
| Fig. 4 Two-photon imaging of rat liver slices upon excitation at 780 nm with femtosecond pulses: (a–c) liver slice incubated with TR-H2S (5 μM) for 30 min, emission measured at 471–560 nm (a) and 591–704 nm (b); (c) the ratio of (a) and (b); (d–f) liver slice incubated with TR-H2S (5 μM) for 30 min and then further incubated with H2S (100 μM) for 30 min, emission measured at 471–560 nm (d) and 591–704 nm (e); (f) the ratio of (d) and (e). Scale bars: 100 μm. | ||
Conclusions
In summary, we report a FRET approach to fabricate novel small molecule ratiometric TPE fluorescent probes, improving imaging in deep tissues. To prove the concept, a ratiometric TPE fluorescent probe – TR-H2S – for H2S monitoring was developed, which displayed a large emission shift (125 nm), two-well resolved emission bands and a fixed maximum TPE wavelength (donor moieties). Thus TR-H2S can achieve accurate measurement of two band fluorescence with less cross-talk, and has realized H2S detection in live cells and tissues in two-photon ratiometric mode. This strategy provides a new opportunity for biomedical researchers to pursue two-photon ratiometric fluorescent probes with well-resolved emission spectra. Future work, such as two- or more energy donor assisted enhanced two-photon excited fluorescence for ratiometric imaging is in progress.Acknowledgements
This work was financially supported by NSFC (21302050), the Hunan Provincial Natural Science Foundation of China (14JJ2047), the Fundamental Research Funds for the Central Universities, and the Startup Fund (531109020043) from Hunan University.Notes and references
- H. Kobayashi, M. Ogawa, R. Alford, P. L. Choyke and Y. Urano, Chem. Rev., 2010, 110, 2620–2640 CrossRef CAS PubMed.
- K. P. Carter, A. M. Young and A. E. Palmer, Chem. Rev., 2014, 114, 4564–4601 CrossRef CAS PubMed.
- J. Chan, S. C. Dodani and C. J. Chang, Nat. Chem., 2012, 4, 973–984 CrossRef CAS PubMed.
- X. Li, X. Gao, W. Shi and H. Ma, Chem. Rev., 2014, 114, 590–659 CrossRef CAS PubMed.
- D. Kim, H. G. Ryu and K. H. Ahn, Org. Biomol. Chem., 2014, 12, 4550–4566 CAS.
- S. Yao and K. D. Belfield, Eur. J. Org. Chem., 2012, 3199–3217 CrossRef CAS.
- F. Helmchen and W. Denk, Nat. Methods, 2005, 2, 932–940 CrossRef CAS PubMed.
- W. R. Zipfel, R. M. Williams and W. W. Webb, Nat. Biotechnol., 2003, 21, 1369–1377 CrossRef CAS PubMed.
- J. S. K. Min Hee Lee and J. L. Sessler, Chem. Soc. Rev., 2014 10.1039/C4CS00280F.
- S. K. Bae, C. H. Heo, D. J. Choi, D. Sen, E. H. Joe, B. R. Cho and H. M. Kim, J. Am. Chem. Soc., 2013, 135, 9915–9923 CrossRef CAS PubMed.
- Q. Q. Wu, Z. F. Xiao, X. J. Du and Q. H. Song, Chem.–Asian J., 2013, 8, 2564–2568 CrossRef CAS PubMed.
- C. Chung, D. Srikun, C. S. Lim, C. J. Chang and B. R. Cho, Chem. Commun., 2011, 47, 9618–9620 RSC.
- H. J. Kim, C. H. Heo and H. M. Kim, J. Am. Chem. Soc., 2013, 135, 17969–17977 CrossRef CAS PubMed.
- S. K. Bae, C. H. Heo, D. J. Choi, D. Sen, E. H. Joe, B. R. Cho and H. M. Kim, J. Am. Chem. Soc., 2013, 135, 9915–9923 CrossRef CAS PubMed.
- F. Liu, T. Wu, J. F. Cao, S. Cui, Z. G. Yang, X. X. Qiang, S. G. Sun, F. L. Song, J. L. Fan, J. Y. Wang and X. J. Peng, Chem.–Eur. J., 2013, 19, 1548–1553 CrossRef CAS PubMed.
- S. Sumalekshmy, M. M. Henary, N. Siegel, P. V. Lawson, Y. Wu, K. Schmidt, J. L. Bredas, J. W. Perry and C. J. Fahrni, J. Am. Chem. Soc., 2007, 129, 11888–11889 CrossRef CAS PubMed.
- J. Fan, M. Hu, P. Zhan and X. Peng, Chem. Soc. Rev., 2013, 42, 29–43 RSC.
- L. Yuan, W. Lin, K. Zheng and S. Zhu, Acc. Chem. Res., 2013, 46, 1462–1473 CrossRef CAS PubMed.
- W. Xuan, Y. Cao, J. Zhou and W. Wang, Chem. Commun., 2013, 49, 10474–10476 RSC.
- H. Yu, Y. Xiao, H. Guo and X. Qian, Chem.–Eur. J., 2011, 17, 3179–3191 CrossRef CAS PubMed.
- X. Zhang, Y. Xiao and X. Qian, Angew. Chem., Int. Ed., 2008, 47, 8025–8029 CrossRef CAS PubMed.
- A. E. Albers, V. S. Okreglak and C. J. Chang, J. Am. Chem. Soc., 2006, 128, 9640–9641 CrossRef CAS PubMed.
- L. Yuan, W. Lin, Y. Xie, B. Chen and J. Song, Chem.–Eur. J., 2012, 18, 2700–2706 CrossRef CAS PubMed.
- Y. X. Wu, X. B. Zhang, J. B. Li, C. C. Zhang, H. Liang, G. J. Mao, L. Y. Zhou, W. Tan and R. Q. Yu, Anal. Chem., 2014, 86, 10389–10396 CrossRef CAS PubMed.
- D. H. Ma, D. Kim, T. Akisawa, K. H. Lee, K. T. Kim and K. H. Ahn, Chem.–Asian J., 2014 DOI:10.1002/asia.201403073.
- Y. Chen, C. Zhu, J. Cen, J. Li, W. He, Y. Jiao and Z. Guo, Chem. Commun., 2013, 49, 7632–7634 RSC.
- Y. Kurishita, T. Kohira, A. Ojida and I. Hamachi, J. Am. Chem. Soc., 2010, 132, 13290–13299 CrossRef CAS PubMed.
- R. Guliyev, A. Coskun and E. U. Akkaya, J. Am. Chem. Soc., 2009, 131, 9007–9013 CrossRef CAS PubMed.
- J. R. Cox, P. Muller and T. M. Swager, J. Am. Chem. Soc., 2011, 133, 12910–12913 CrossRef CAS PubMed.
- L. Liu, M. Shao, X. Dong, X. Yu, Z. Liu, Z. He and Q. Wang, Anal. Chem., 2008, 80, 7735–7741 CrossRef CAS PubMed.
- D. W. Brousmiche, J. M. Serin, J. M. Frechet, G. S. He, T. C. Lin, S. J. Chung and P. N. Prasad, J. Am. Chem. Soc., 2003, 125, 1448–1449 CrossRef CAS PubMed.
- E. Roussakis, J. A. Spencer, C. P. Lin and S. A. Vinogradov, Anal. Chem., 2014, 86, 5937–5945 CrossRef CAS PubMed.
- L. Liu, G. Wei, Z. Liu, Z. He, S. Xiao and Q. Wang, Bioconjugate Chem., 2008, 19, 574–579 CrossRef CAS PubMed.
- E. W. Seo, J. H. Han, C. H. Heo, J. H. Shin, H. M. Kim and B. R. Cho, Chem.–Eur. J., 2012, 18, 12388–12394 CrossRef CAS PubMed.
- M. Y. Kang, C. S. Lim, H. S. Kim, E. W. Seo, H. M. Kim, O. Kwon and B. R. Cho, Chem.–Eur. J., 2012, 18, 1953–1960 CrossRef CAS PubMed.
- S. L. Gilat, A. Adronov and J. M. J. Frechet, Angew. Chem., Int. Ed., 1999, 38, 1422–1427 CrossRef CAS.
- S. P. Balashov, E. S. Imasheva, J. M. Wang and J. K. Lanyi, Biophys. J., 2008, 95, 2402–2414 CrossRef CAS PubMed.
- J. Liu, Y. Q. Sun, J. Zhang, T. Yang, J. Cao, L. Zhang and W. Guo, Chem.–Eur. J., 2013, 19, 4717–4722 CrossRef CAS PubMed.
- L. Zhou, X. Zhang, Q. Wang, Y. Lv, G. Mao, A. Luo, Y. Wu, Y. Wu, J. Zhang and W. Tan, J. Am. Chem. Soc., 2014, 136, 9838–9841 CrossRef CAS PubMed.
- P. Schwille, U. Haupts, S. Maiti and W. W. Webb, Biophys. J., 1999, 77, 2251–2265 CrossRef CAS.
- H. Peng, W. Chen, Y. Cheng, L. Hakuna, R. Strongin and B. Wang, Sensors, 2012, 12, 15907–15946 CrossRef CAS PubMed.
- Y. Chen, C. Zhu, Z. Yang, J. Chen, Y. He, Y. Jiao, W. He, L. Qiu, J. Cen and Z. Guo, Angew. Chem., Int. Ed., 2013, 52, 1688–1691 CrossRef CAS PubMed.
- F. Yu, P. Li, P. Song, B. Wang, J. Zhao and K. Han, Chem. Commun., 2012, 48, 2852–2854 RSC.
- X. L. Liu, X. J. Du, C. G. Dai and Q. H. Song, J. Org. Chem., 2014, 79, 9481–9489 CrossRef CAS PubMed.
- M. Y. Wu, K. Li, J. T. Hou, Z. Huang and X. Q. Yu, Org. Biomol. Chem., 2012, 10, 8342–8347 CAS.
- L. Zhang, W. Q. Meng, L. Lu, Y. S. Xue, C. Li, F. Zou, Y. Liu and J. Zhao, Sci. Rep., 2014, 4, 5870 Search PubMed.
- J. S. Xu Wang, W. Zhang, X. Ma, J. Lv and B. Tang, Chem. Sci. J., 2013, 4, 2551–2556 RSC.
- L. Zhang, S. Li, M. Hong, Y. Q. Xu, S. S. Wang, Y. Liu, Y. Qian and J. Zhao, Org. Biomol. Chem., 2014, 12, 5115–5125 CAS.
- Q. Q. Wan, Y. C. Song, Z. Li, X. H. Gao and H. M. Ma, Chem. Commun., 2013, 49, 502–504 RSC.
- L. Yuan and Q. P. Zuo, Chem.–Asian J., 2014, 9, 1544–1549 CrossRef CAS PubMed.
- L. Wei, L. Yi, F. Song, C. Wei, B. F. Wang and Z. Xi, Sci. Rep., 2014, 4, 4521 Search PubMed.
- Y. Jiang, Q. Wu and X. Chang, Talanta, 2014, 121, 122–126 CrossRef CAS PubMed.
- Q. Huang, X. F. Yang and H. Li, Dyes Pigm., 2013, 99, 871–877 CrossRef CAS PubMed.
- Z. Xu, L. Xu, J. Zhou, Y. Xu, W. Zhu and X. Qian, Chem. Commun., 2012, 48, 10871–10873 RSC.
- S. Goswami, A. Manna, M. Mondal and D. Sarkar, RSC Adv., 2014, 4, 62639–62643 RSC.
Footnote |
| † Electronic supplementary information (ESI) available: Synthetic procedures and characterization data; additional spectroscopic data. See DOI: 10.1039/c4sc03883e |
| This journal is © The Royal Society of Chemistry 2015 |