 Open Access Article
A far-red emitting probe for unambiguous detection of mobile zinc in acidic vesicles and deep tissue†
Pablo
Rivera-Fuentes
a,
Alexandra T.
Wrobel
a,
Melissa L.
Zastrow
a,
Mustafa
Khan
b,
John
Georgiou
b,
Thomas T.
Luyben
bc,
John C.
Roder
bc,
Kenichi
Okamoto
bc and
Stephen J.
Lippard
*a
aDepartment of Chemistry, Massachusetts Institute of Technology, Cambridge, MA 02139, USA. E-mail: lippard@mit.edu
bLunenfeld-Tanenbaum Research Institute, Mount Sinai Hospital, Toronto, ON M5G 1X5, Canada
cDepartment of Molecular Genetics, Faculty of Medicine, University of Toronto, Toronto, ON M5S 1A8, Canada
First published on 23rd January 2015
Abstract
Imaging mobile zinc in acidic environments remains challenging because most small-molecule optical probes display pH-dependent fluorescence. Here we report a reaction-based sensor that detects mobile zinc unambiguously at low pH. The sensor responds reversibly and with a large dynamic range to exogenously applied Zn2+ in lysosomes of HeLa cells, endogenous Zn2+ in insulin granules of MIN6 cells, and zinc-rich mossy fiber boutons in hippocampal tissue from mice. This long-wavelength probe is compatible with the green-fluorescent protein, enabling multicolor imaging, and facilitates visualization of mossy fiber boutons at depths of >100 μm, as demonstrated by studies in live tissue employing two-photon microscopy.
Introduction
Zinc is an essential trace element that is often found as pools of mobile ions in specific tissues of the body.1 In the brain and pancreas, the highest concentrations of mobile zinc occur in secretory vesicles.2–4 Synaptic vesicles in neurons and insulin granules in pancreatic β-cells store zinc with concentrations in the millimolar range.5,6 In both cases, these zinc ions are secreted together with either glutamate or insulin and elicit distinct autocrine and paracrine effects.4,7,8Secretory vesicles are usually more acidic than the cytosol or the extracellular space. Insulin granules express an ATP-dependent proton pump that acidifies the vesicles to pH 5.5,9 and the pH of resting synaptic vesicles in the hippocampus is 5.7.10 Moreover, the acidity of secretory vesicles changes continuously, reaching neutrality upon exocytosis.10,11 Visualization of vesicular zinc therefore requires probes that are completely impervious to pH changes.
The majority of small-molecule optical probes for mobile zinc comprise a fluorophore and a chelating unit.12–14 In the absence of zinc, lone pairs of tertiary amines in the binding unit quench the fluorescence of the fluorophore via photoinduced electron transfer (PET).15 Upon zinc binding, the energy of the lone pair is decreased and PET becomes unfavorable, restoring the fluorescence of the probe. A limitation of this approach is that protonation of the tertiary amine in the binding unit also induces enhancement of the fluorescence. This pH sensitivity makes most zinc fluorescent sensors less efficient in acidic environments and may introduce uncertainty as to whether the observed signal is a consequence of detection of zinc or a change in pH.
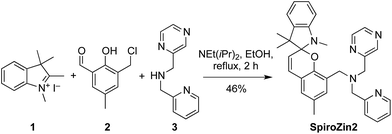
We recently developed SpiroZin1, a reversible, reaction-based fluorescent sensor that is pH-insensitive from pH 3 to 7.16 SpiroZin1 binds zinc with a dissociation constant in the picomolar range, which is too low for most neuroscience applications. Here we report the preparation of SpiroZin2 (Scheme 1), a probe that detects zinc with nanomolar affinity. The utility of the probe is demonstrated in live cells and acute hippocampal tissue slices in studies that significantly enhance the value of the SpiroZin family of mobile zinc sensors.
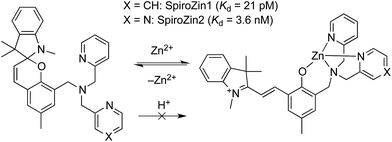 | ||
| Scheme 1 Structure and sensing mechanism of SpiroZin probes. Replacement of a pyridine (X = CH) by a pyrazine ring (X = N) in the metal-chelating unit decreases the zinc binding affinity of the sensor, improving its dynamic range in live cells.17 | ||
Results and discussion
SpiroZin2 was prepared in a one-pot reaction from indolenine 1, cresol derivative 2, and amine 3 (Scheme 2), and was purified by RP-HPLC (for details see the ESI†). Solutions of SpiroZin2 in aqueous buffer (50 mM PIPES, 100 mM KCl, pH 7) are pale yellow and non-fluorescent, indicating that the probe exists in the spirobenzopyran form. Addition of zinc turns the color of the solution to a deep red (λabs = 518 nm, 3.071(1) × 104 cm−1 M−1) with an increase in fluorescence intensity at λmax = 645 nm (Fig. S3†).SpiroZin2 binds zinc with a dissociation constant of 3.6(4) nM. This affinity is weaker compared to that of SpiroZin1 as a consequence of replacing a pyridine ring by a less electron-rich, more weakly binding, pyrazine ring (Fig. S4†).18 The fluorescence of the probe in the absence of zinc did not change significantly over the pH range of 3 to 7, and a large fluorescence enhancement was observed upon addition of zinc to solutions at each of these pH values (Fig. S5†). SpiroZin2 also displayed good selectivity against metal ions such as Na+, K+, Ca2+, and Mg2+, among others (Fig. S6†). The turn-on kinetics were studied using stopped-flow fluorescence spectroscopy and occurred in two steps, with t1/2 fast = 14.4(2) ms and t1/2 slow = 2.92(5) s (Fig. S7†). Upon chelation of zinc with ethylenediamine tetraacetic acid (EDTA), the non-fluorescent spirobenzopyran isomer was restored with t1/2 = 69.4(9) s at 37 °C (Fig. S8†).
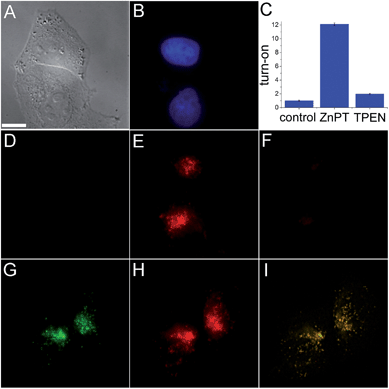
The ability of SpiroZin2 to detect zinc ions in live cells was investigated. HeLa cells treated with 5 μM SpiroZin2 showed essentially no fluorescence in the red channel (Fig. 1D). Addition of 30 μM zinc pyrithione, a cell-permeable zinc complex, led to a 12-fold increase in intracellular red fluorescence (Fig. 1C and E). Treatment of these cells with the intracellular chelator N,N,N′,N′-tetrakis(pyridin-2-ylmethyl)ethane-1,2-diamine (TPEN) decreased the fluorescence almost to background levels (Fig. 1C and F). In live HeLa cells, SpiroZin2 colocalizes with LysoTracker Green® (LTG), which is a commercial dye that stains acidic vesicles (Fig. 1G–I). The green and red signals correlate with a Pearson's correlation coefficient rP = 0.80(2). The Mander's colocalization coefficients19 of the two signals are also close to 1 and the same for the two fluorescent signals (Mgreen = 0.8(1) and Mred = 0.8(1); for the mathematical definition of this coefficient see the ESI†), indicating that SpiroZin2 detects exogenously applied zinc in acidic vesicles. To demonstrate that SpiroZin2 can also detect endogenous zinc in acidic environments, we used MIN6 cells, which are an insulinoma-derived model of pancreatic β-cells.20
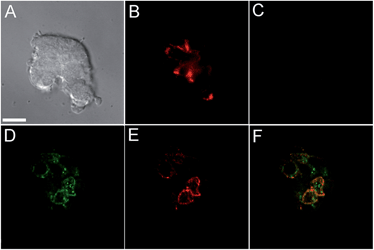
Incubation of MIN6 cells with SpiroZin2 produced red fluorescence in a punctate pattern, especially in the vicinity of the plasma membrane (Fig. 2B and E), consistent with labeling of insulin granules.
Treatment of the cells with TPEN led to disappearance of the fluorescence signal, demonstrating that the sensor detects the presence of endogenous zinc (Fig. 2C). We loaded LTG and SpiroZin2 into MIN6 cells and quantified their colocalization. Whereas LTG stained all acidic vesicles, SpiroZin2 labeled only certain granules (Fig. 2D–F). The Pearson's correlation coefficient of the dyes in MIN6 cells is 0.66(4), which is significantly lower than that observed in HeLa cells (0.8). This smaller correlation coefficient is consistent with the ability of LTG to label both zinc-rich insulin granules and endo/lysosomes, in which the concentration of mobile zinc is low. In contrast, SpiroZin2 gives a fluorescent signal only in vesicles that have a high concentration of endogenous zinc, such as insulin granules, and leaves endo/lysosomes unstained (Fig. 2F). This conclusion is supported by the Mander's coefficients, which show that SpiroZin2 colocalizes strongly with LTG (Mred = 0.8(1)), but LTG colocalizes with SpiroZin2 only moderately (Mgreen = 0.56(6)). Additionally, the intracellular red fluorescence of MIN6 cells loaded with SpiroZin2 decreased significantly upon stimulation of the cells with 50 mM KCl and 20 mM glucose, which is consistent with exocytosis of vesicular zinc and SpiroZin2 (Fig. S9†).
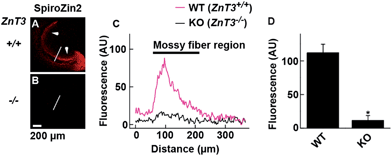
SpiroZin2 displays a large fluorescence enhancement upon detection of zinc using two-photon excitation (Fig. S10†). Although the emission quantum yield of SpiroZin2 is very low (ϕ = 0.001), the relatively large two-photon absorption cross-section (σTPA = 74 GM) of the zinc-bound forms makes this sensor a good probe for two-photon imaging. We exploited these non-linear optical properties to perform two-photon imaging of live brain tissue. Acute hippocampal slices from adult wild-type (WT) mice were incubated with 100 μM SpiroZin2. Two-photon imaging of these slices revealed red fluorescence with a punctate pattern in the cornu ammonis 3 (CA3) stratum lucidum layer in the mossy fiber region (Fig. 3A and C). This staining is similar to that obtained recently using probe 6-CO2H–ZAP4.21 Vesicular zinc in the brain is loaded by the ZnT3 (Slc30A3) transporter and this gene has been successfully knocked out in transgenic mice.22
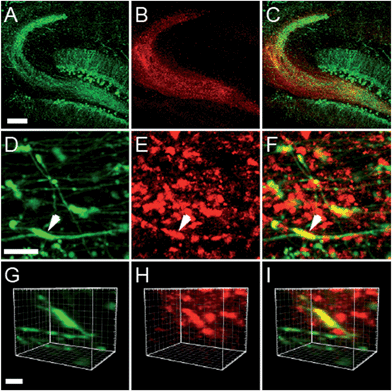
Two-photon imaging of hippocampal tissue from a ZnT3 knockout (Slc30a3−/−) mouse displayed only background fluorescence (Fig. 3B–D), demonstrating that SpiroZin2 detects ZnT3-dependent synaptic zinc in live tissue. The emission of SpiroZin2 in the deep red region of the spectrum enabled us to conduct zinc imaging experiments in Thy1-EGFP (line M) transgenic mice, which express EGFP sparsely in neuronal cells under the control of the Thy1 promoter.23 Acute hippocampal slices of an adult Thy1-EGFP mouse were incubated with 100 μM SpiroZin2 and imaged using two-photon microscopy (Fig. 4). In the green channel, neurons expressing EGFP can be observed in the dentate gyrus granule neurons and their mossy fiber axons (Fig. 4A). In the red channel, fluorescence is detected in the mossy fiber boutons (Fig. 4B), but not in other regions including the cell bodies and dendrites of the dentate gyrus granule neurons (Fig. 4C). Enlarged images of the CA3 region reveal that SpiroZin2 produced a punctate staining pattern, which overlapped with EGFP-labeled mossy fiber boutons (Fig. 4D–F). Higher magnification of three-dimensional images confirmed the colocalized puncta of EGFP and SpiroZin2 (Fig. 4G–I), indicating presynaptic localization of SpiroZin2. Additionally, we co-stained hippocampal slices with SpiroZin2 and the membrane-permeable green fluorescent Zn2+ sensor ZP1, which was used previously to image mobile zinc in mossy fiber boutons.21
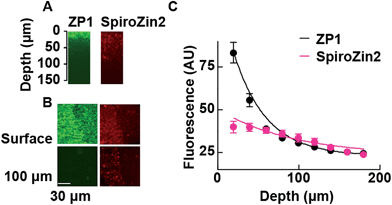
The fluorescent signals of SpiroZin2 and ZP1 correlate in the mossy fiber region and high-magnification images revealed colocalized puncta of SpiroZin2 and ZP1 (Fig. S11†). The addition of the membrane-permeant Zn2+ chelator tris-(2-pyridylmethyl)amine (TPA) reduced the fluorescence intensity of SpiroZin2 puncta, confirming the detection of presynaptic Zn2+.21 We next tested the decay of the detected fluorescence of zinc sensors as a function of depth (z) in hippocampal tissues. We compared SpiroZin2 with ZP1.17 The fluorescence intensity of ZP1 was more than twice as strong as that of SpiroZin2 on the surface of the tissue, but decayed dramatically to a fluorescence level similar to that of SpiroZin2, albeit showing increased out-of-focus fluorescence signals at deeper regions instead of distinct mossy fiber boutons (Fig. 5). In contrast, SpiroZin2 signals were dimmer at the surface, but maintained a fluorescence intensity consisting of focused presynaptic boutons at depths between 50–100 μm. These results demonstrate the advantage of using SpiroZin2 to image Zn2+ in mossy fiber boutons from deep brain regions.
Conclusions
We developed SpiroZin2, a probe with nanomolar binding affinity, pH-insensitivity in the physiological range, far-red fluorescence, and improved performance in live cells and tissues. This sensor accumulates in the endo/lysosomes of HeLa cells and displays a reversible 12-fold fluorescence enhancement in response to exogenously applied Zn2+. This experiment demonstrates that SpiroZin2 is able to detect chelatable zinc in acidic vesicles. In pancreatic MIN6 cells, SpiroZin2 labels zinc-rich granules and does not show fluorescence in other acidic vesicles. The emission of SpiroZin2 increases upon detection of zinc using two-photon excitation, making the probe useful for imaging in live tissue. SpiroZin2 stains the mossy fiber boutons in the CA3 region of WT mouse, but not in hippocampal slices of a ZnT3 knockout (Slc30a3−/−) mouse, confirming that the probe detects presynaptic vesicular zinc. This sensor is also useful for experiments in combination with organisms that express EGFP reporters, providing the opportunity to study the interplay of mobile zinc and synaptic protein function by multicolor imaging. The far-red fluorescence of SpiroZin2 is ideal for imaging zinc in tissue at depths of >100 μm with greater contrast than existing visible-light probes.Acknowledgements
This work was supported by the National Institute of General Medical Sciences [grant GM065519 (to S.J.L.)], the Natural Sciences and Engineering Research Council of Canada discovery Grants program (K.O.), Canadian Institutes of Health Research [grant MOP 111220 (to K.O.)], the Canada Research Chairs Program (K.O.), and the Canada Foundation for Innovation (K.O.). P. R.-F. thanks the Swiss National Science Foundation for a postdoctoral fellowship.Notes and references
- N. W. Solomons, Ann. Nutr. Metab., 2013, 62, 8–17 CrossRef CAS PubMed.
- A. Takeda, M. Nakamura, H. Fujii and H. Tamano, Metallomics, 2013, 5, 417–423 RSC.
- C. J. Frederickson, J.-Y. Koh and A. I. Bush, Nat. Rev. Neurosci., 2005, 6, 449–462 CrossRef CAS PubMed.
- Y. V. Li, Endocrine, 2014, 45, 178–189 CrossRef CAS PubMed.
- C. J. Frederickson, S. W. Suh, D. Silva, C. J. Frederickson and R. B. Thompson, J. Nutr., 2000, 130, 1471S–1483S CAS.
- M. C. Foster, R. D. Leapman, M. X. Li and I. Atwater, Biophys. J., 1993, 64, 525–532 CrossRef CAS.
- K. Tóth, Annu. Rev. Nutr., 2011, 31, 139–153 CrossRef PubMed.
- S. L. Sensi, P. Paoletti, A. I. Bush and I. Sekler, Nat. Rev. Neurosci., 2009, 10, 780–791 CrossRef CAS PubMed.
- J. C. Hutton, Biochem. J., 1982, 204, 171–178 CAS.
- G. Miesenböck, D. A. De Angelis and J. E. Rothman, Nature, 1998, 394, 192–195 CrossRef PubMed.
- M. Ohara-Imaizumi, Y. Nakamichi, T. Tanaka, H. Katsuta, H. Ishida and S. Nagamatsu, Biochem. J., 2002, 363, 73–80 CrossRef CAS.
- K. P. Carter, A. M. Young and A. E. Palmer, Chem. Rev., 2014, 114, 4564–4601 CrossRef CAS PubMed.
- E. L. Que, D. W. Domaille and C. J. Chang, Chem. Rev., 2008, 108, 1517–1549 CrossRef CAS PubMed.
- D. W. Domaille, E. L. Que and C. J. Chang, Nat. Chem. Biol., 2008, 4, 168–175 CrossRef CAS PubMed.
- Z. Liu, W. He and Z. Guo, Chem. Soc. Rev., 2013, 42, 1568–1600 RSC.
- P. Rivera-Fuentes and S. J. Lippard, ChemMedChem, 2014, 9, 1238–1243 CrossRef CAS PubMed.
- S. C. Burdette, G. K. Walkup, B. Spingler, R. Y. Tsien and S. J. Lippard, J. Am. Chem. Soc., 2001, 123, 7831–7841 CrossRef CAS PubMed.
- X.-a. Zhang, D. Hayes, S. J. Smith, S. Friedle and S. J. Lippard, J. Am. Chem. Soc., 2008, 130, 15788–15789 CrossRef CAS PubMed.
- E. M. M. Manders, F. J. Verbeek and J. A. Aten, J. Microsc., 1993, 169, 375–382 CrossRef PubMed.
- J.-I. Miyazaki, K. Araki, E. Yamato, H. Ikegami, T. Asano, Y. Shibasaki, Y. Oka and K.-I. Yamamura, Endocrinology, 1990, 127, 126–132 CrossRef CAS PubMed.
- M. Khan, C. R. Goldsmith, Z. Huang, J. Georgiou, T. T. Luyben, J. C. Roder, S. J. Lippard and K. Okamoto, Proc. Natl. Acad. Sci. U. S. A., 2014, 111, 6786–6791 CrossRef CAS PubMed.
- T. B. Cole, H. J. Wenzel, K. E. Kafer, P. A. Schwartzkroin and R. D. Palmiter, Proc. Natl. Acad. Sci. U. S. A., 1999, 96, 1716–1721 CrossRef CAS.
- G. P. Feng, R. H. Mellor, M. Bernstein, C. Keller-Peck, Q. T. Nguyen, M. Wallace, J. M. Nerbonne, J. W. Lichtman and J. R. Sanes, Neuron, 2000, 28, 41–51 CrossRef CAS.
Footnote |
| † Electronic supplementary information (ESI) available: General methods, synthetic procedures, NMR spectra, kinetic data, pH profile, metal selectivity graph, cell culture and staining protocols, wide-field microscopy experiments, tissue specimen preparation, and two-photon imaging techniques. See DOI: 10.1039/c4sc03388d |
| This journal is © The Royal Society of Chemistry 2015 |

