 Open Access Article
Creative Commons Attribution 3.0 Unported Licence
MM quadruply bonded complexes supported by vinylbenzoate ligands: synthesis, characterization, photophysical properties and application as synthons†
Samantha E.
Brown-Xu
,
Malcolm H.
Chisholm
*,
Christopher B.
Durr
,
Thomas F.
Spilker
and
Philip J.
Young
The Ohio State University, Department of Chemistry and Biochemistry, 100 W. 18th Avenue, Columbus, Ohio 43202, USA. E-mail: Chisholm@chemistry.ohio-state.edu; Tel: +1-614-292-7216
First published on 13th January 2015
Abstract
From the reactions between M2(TiPB)4 compounds and meta and para-vinylbenzoic acids (2 equiv.) in toluene at room temperature the compounds trans-M2(TiPB)2L2, where L = m-vinylbenzoate 1A (M = Mo) and 1B (M = W) and TiPB = 2,4,6-triisopropylbenzoate, and where L = p-vinylbenzoate 2A (M = Mo) and 2B (M = W) have been isolated. Compounds 1A and 2A have been shown to undergo Heck carbon–carbon coupling reactions with phenyliodide to produce trans-Mo2(TiPB)2(O2CC6H4-m-CH![[double bond, length as m-dash]](https://www.rsc.org/images/entities/char_e001.gif) CH–C6H5)2, 3A and trans-Mo2(TiPB)2(O2CC6H4-p-CH
CH–C6H5)2, 3A and trans-Mo2(TiPB)2(O2CC6H4-p-CH![[double bond, length as m-dash]](https://www.rsc.org/images/entities/char_e001.gif) CH–C6H5)2, 4A. The molybdenum compounds 1A and 2A have been structurally characterized by single crystal X-ray crystallography. All the new compounds have been characterized by 1H NMR, IR, UV-visible absorption and emission spectroscopy, high resolution MALDI-TOF MS, fs- and ns-transient absorption spectroscopy and fs-time-resolved IR spectroscopy. Electronic structure calculations employing density functional theory, DFT, and time-dependent DFT have been employed to aid in the interpretation of spectral data. All compounds show intense absorptions in the visible region corresponding to M2δ to Lπ* charge transfer transitions. The lifetimes of the 1MLCT state fall in the range of 1–10 ps and for the molybdenum complexes the T1 states are 3δδ* with lifetimes ∼50 μs while for the tungsten complexes the T1 are 3MLCT with lifetimes in the range of 3–10 ns.
CH–C6H5)2, 4A. The molybdenum compounds 1A and 2A have been structurally characterized by single crystal X-ray crystallography. All the new compounds have been characterized by 1H NMR, IR, UV-visible absorption and emission spectroscopy, high resolution MALDI-TOF MS, fs- and ns-transient absorption spectroscopy and fs-time-resolved IR spectroscopy. Electronic structure calculations employing density functional theory, DFT, and time-dependent DFT have been employed to aid in the interpretation of spectral data. All compounds show intense absorptions in the visible region corresponding to M2δ to Lπ* charge transfer transitions. The lifetimes of the 1MLCT state fall in the range of 1–10 ps and for the molybdenum complexes the T1 states are 3δδ* with lifetimes ∼50 μs while for the tungsten complexes the T1 are 3MLCT with lifetimes in the range of 3–10 ns.
Introduction
The field of organic electronics based on conducting organic polymers is a rapidly developing field embracing both chemistry and materials science. Poly-p-phenylene vinylene (PPV) is one of the most studied conducting organic polymers to date and has been at the center of the development of organic electronics.1–7 Friend and coworkers discovered the polymer light emitting diode with PPV showing yellow-green electroluminescence in 1990.1 The first bulk heterojunction photovoltaic cell was made with PPV derivatives as the light absorbing layer by Heeger3 and Friend8 in 1995. The incorporation of transition metals into PPV derivatives offers the opportunity to couple the properties of the transition metal with those of the polymer and was first achieved with ruthenium and osmium via the Heck reaction and the properties of these complexes have been explored in detail.9 They possess the π–π* transition of the parent polymer and also an MLCT transition from the metal to the bipyridine that it is bound to in the polymer. The luminescence of these systems is dominated by the 3MLCT state traditionally present in metal–pyridyl systems.10 Ruthenium and osmium PPV derivatives were also examined as light emitting layers in polymer light emitting diodes (PLEDs) and it was shown the emission was largely MLCT based. The metal can also be used to toggle between conjugated and nonconjugated organic polymers, where coordination of the metal forces the planarization of the polymer and enhances the conjugation.11With this in mind, it seems appropriate to explore the incorporation of MM quadruply bonded complexes into PPV derivatives by way of carbon–carbon cross coupling reactions, such as the Heck reaction. The use of carbon–carbon cross coupling reactions on the periphery of transition metal complexes has been previously explored;12 however, there is a limited scope of these reactions on MM paddlewheel complexes. Ren and company have shown the Heck reaction can be successfully employed on Ru2 formamidinate compounds to add a styrene functionality. Reactions on the quadruply bonded Mo2 tetracarboxylate complexes have proven more difficult due to the kinetic lability of the carboxylate ligands. The initial example of this has shown that the Sonogashira reaction can be employed on the periphery of MM compounds successfully without compromising the quadruply bonded core.13
We have previously shown that the attachment of π-conjugated organic units such as oligothiophenes via carboxylate units to the MM quadruply bonded centers have intense 1MLCT transitions that may be tuned to span the entire visible region of the spectrum.14 Moreover, the 1MLCT states have relatively long lifetimes, typically in the range of 1–20 ps. In this paper, a series of Mo2 and W2 bis–bis complexes supported by vinylbenzoate ligands have been prepared and their ground state and excited state photophysical properties are explored. It is also shown that the Mo2 complexes are viable synthons for the preparation of higher order extended structures that possess very interesting photophysical properties.
Results and discussion
Synthesis
The synthesis of the new compounds is outlined in Scheme 1. The trans-M2 compounds 1A–2B were prepared by the ligand exchange reaction between M2TiPB4 with the respective carboxylic acid, either 3-vinylbenzoic acid (1) or 4-vinylbenzoic acid (2), where M = Mo (A) or W (B) and TiPB = 2,4,6-triisopropylbenzoate. The reactions were performed in toluene, where the desired product was slightly soluble. The desired product was then isolated by reducing the volume of the solvent in vacuo and precipitation by the addition of hexanes. They are highly colored solids that are yellow (1A), orange (2A), maroon (1B) and blue (2B). The new compounds are air sensitive and soluble in toluene, THF, and DCM. They gave molecular ions in the MALDI-TOF MS and 1H NMR data are consistent with their formulations. Further characterization details are given in the Experimental. The new compounds 1A and 2A were then subjected to further reactions. A Heck cross coupling reaction was successfully performed on both Mo2 complexes with excess iodobenzene in the presence of palladium(II) acetate, Et3N and heat. For 1A, there was no visible color change; however, for 2A, the solution went from orange to red. The products were isolated by filtration of the reaction mixture through a bed of celite. The solvent was then reduced to a minimal amount and hexanes were added to precipitate the product. The desired products were purified further by recrystallization. 3A and 4A gave molecular ions in the MALDI-TOF MS and 1H NMR consistent with their formulations. Further characterization details are given in the Experimental. MALDI-TOF MS and 1H NMR plots can be seen in the ESI.†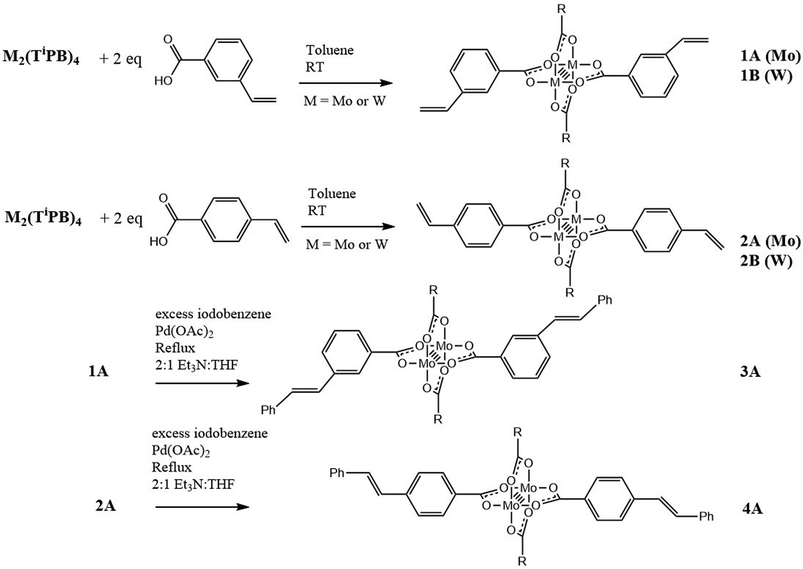 | ||
| Scheme 1 Synthesis of new vinylbenzoate supported M2 complexes, where M = Mo (A) or W (B), and R = 2,4,6-triisopropylphenyl. | ||
Reactions were attempted on the W2 compounds; however, they are more sensitive to oxidation than their Mo2 counterparts and the W2 desired coupled products were not obtained. Further studies pertaining to C–C coupling reactions involving W2-quadruply bonded complexes are underway.
Single crystal X-ray structures
Single crystals suitable for X-ray analysis for 1A and 2A were grown from vapor diffusion of hexanes into a concentrated THF solution. The molecular structures of 1A and 2A are shown in Fig. 1 and 2, respectively. Both structures have a center of inversion and the TiPB units are twisted such that the phenyl rings are out of conjugation with the –CO2 units with dihedral angles of 79.6° and 83.3°, respectively. The vinylphenyl unit, however, is coplanar with its –CO2 unit making it in conjugation with the Mo2 center with dihedral angles of 11.3° and <1° in 1A and 2A, respectively. The angle between the vinyl and phenyl units in 1A is 4.5° and in 2A is <1°. The Mo–Mo and Mo–O bond lengths are ∼2.1 Å and the Mo2(O2CR)4 core is typical for Mo24+ complexes.15 For 2A, the terminal vinyl carbon shows disorder in two positions, but Fig. 2 shows only one position. The axial sites of the MoMo unit are occupied by coordinating THF with a THF–O⋯Mo distance of ∼2.6 Å. A table of select crystallographic information can be found in the ESI.†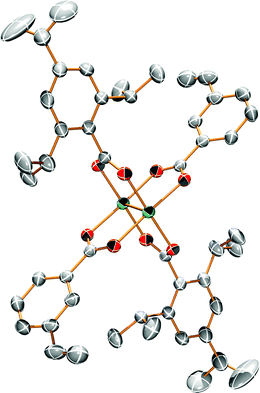 | ||
| Fig. 1 ORTEP structure of Mo2TiPB2(3-vinylbenzoate)2 [1A]. Hydrogens and solvent omitted for clarity. Thermal ellipsoids shown at 50%. | ||
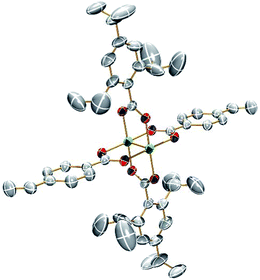 | ||
| Fig. 2 ORTEP structure of Mo2TiPB2(4-vinylbenzoate)2 [2A]. Hydrogens, disorder and solvent omitted for clarity. Thermal ellipsoids shown at 50%. | ||
Electronic structure calculations
In order to assist in the interpretation of the spectral data, electronic structure calculations have been performed on model complexes of the form trans-M2(O2CH)2(vinylbenzoate)2, where TiPB is substituted for formate. Density functional theory (DFT) and time-dependent DFT (TD-DFT) have been employed to this end. The TD-DFT calculations predict these compounds to possess several intense, fully-allowed transitions. There is a metal-to-ligand charge transfer (MLCT) from the M2δ to vinylbenzoate π*, a MLCT from the M2δ to the formate π* and a π–π* transition based on the vinylbenzoate ligands.Calculations were performed on model complexes 1A′, 1B′, 2A′, 2B′, 3A′ and 4A′ where the TiPB moiety has been replaced by a formate to save on computational resources. This is a reasonable assumption because the phenyl ring of the TiPB is twisted ∼90° out of conjugation with respect to the M2 center which effectively removes its contribution to the electronic structure.
The frontier MO energy level diagram for the meta-vinylbenzoate M2 complexes 1A′ and 1B′ is shown in Fig. 3. The HOMO for both compounds is the M2δ orbital with a significant degree of mixing with the ligands. The LUMO for the Mo2 compound is the M2δ*. To higher energy, the LUMO + 1 and LUMO + 2 are the symmetric and anti-symmetric combinations of the ligand π* orbitals, where the anti-symmetric combination has the correct symmetry to mix with the Mo2δ orbital. For the W2 complex, the LUMO is the symmetric π* combination and to higher energy, the anti-symmetric π* orbital is the LUMO + 1 and the M2δ* is the LUMO + 2.
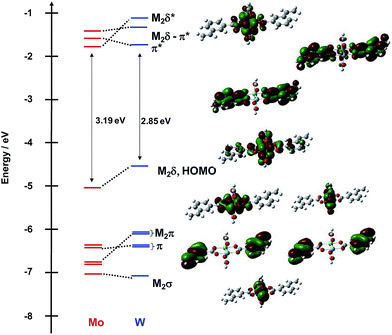 | ||
| Fig. 3 Frontier molecular orbital diagram of model compounds 1A′ and 1B′ with orbital representations of 1B′ made with GaussView 5.0 with an isovalue of 0.02. | ||
Below the M2δ HOMO lie two ligand–π orbitals then two M2π and finally the M2σ for 1A′. For the W2 complex 1B′, the order of the ligand–π and M2π orbitals are reversed. The difference in ordering of the Lπ and M2π orbitals follows from the higher W2- vs. Mo2-based orbitals by ∼0.5 eV. The HOMO–LUMO gap for the tungsten compound tracks with the difference in M2δ orbital energy and is ∼0.5 eV smaller than that in the Mo2 analog.
A similar comparison of the frontier orbitals of 2A′ and 2B′ can be made and is shown in Fig. 4. Qualitatively, the orbitals are similar except for the ligand π orbitals. For this series of complexes, the vinyl substituent is in conjugation with the M2δ and the carboxylate core raises the energy of the occupied ligand π orbitals and lowers the energy of the ligand π* orbitals. In the Mo2 complex, the symmetric π* orbital is lowered below the M2δ* making it the LUMO. This is responsible for the reduced HOMO–LUMO gap in this series of compounds relative to 1A′ and 1B′.
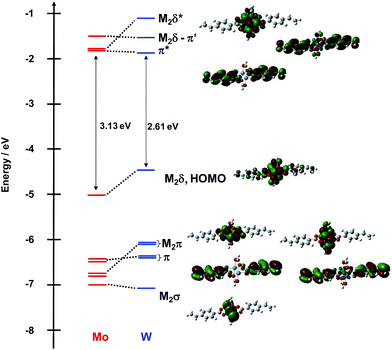 | ||
| Fig. 4 Frontier molecular orbital diagram of model compounds 2A′ and 2B′ with orbital representations of 2B′ made with GaussView 5.0 with an isovalue of 0.02. | ||
The splitting between the two combinations of π* orbitals is a representation of the electronic coupling present and the values for these compounds are listed in Table 1. Between the complexes of the same metal, the splitting does not change significantly; however, upon going from Mo2 to W2, the magnitude of the splitting increases due to the increased electronic coupling from greater mixing of the W2δ orbital with the ligand π*.
| Compound | ΔE/eV |
|---|---|
| 1A′ | 0.25 |
| 1B′ | 0.35 |
| 2A′ | 0.24 |
| 2B′ | 0.33 |
| 3A′ | 0.12 |
| 4A′ | 0.18 |
For compounds 3A′ and 4A′, the frontier MO energy level diagrams are shown in Fig. 5. The MO diagram for compound 4A′ is very similar to its precursor 2A′. The addition of the phenyl unit extends the π-conjugation, raises the energy of the π-orbitals, and lowers the energy of the π* orbitals. This additionally causes the secondary effect of raising the energy of the Mo2δ orbital. Overall, this results in a reduction of the HOMO–LUMO gap to 2.89 eV. The splitting between the two π* combinations is reduced to 0.18 eV.
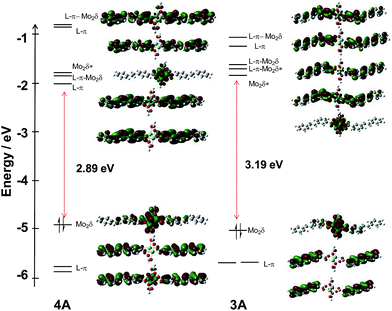 | ||
| Fig. 5 Frontier MO energy level diagram of model compounds 3A′ (right) and 4A′ (left) with orbital representations made with GaussView 5.0 with an isovalue of 0.02. | ||
For compound 3A′, the orbital diagram is more complicated. The HOMO of 3A′ is the Mo2δ with some admixture from the ligands and the LUMO is the Mo2δ* orbital. The π system of the vinylbenzoate ligand has been perturbed relative to the parent compound 1A′. The symmetric and anti-symmetric combinations of the Lπ* are the LUMO + 1 and LUMO + 2, respectively. Upon addition of the phenyl group, there is little energetic modification of the π* orbitals; however, there is a mixing of the Mo2δ* orbital with the symmetric π* combination that is not normally present in M2 tetracarboxylates. Further, there is character from the outer phenyl ring in this orbital, but this does not result in a change in the energy of the orbital. In addition, there are two new π* orbitals to higher energy as a result of the extended ring system in 3A′. Below the HOMO, there is a degenerate pair of ligand π orbitals that are shifted significantly higher relative to 1A′, −5.7 eV vs. −6.5 eV.
Electronic absorption and emission spectroscopy
The electronic absorption spectra of 1A, 1B, 2A, and 2B in THF are shown in Fig. 6. To higher energy, the electronic spectra of all compounds feature a ligand centered transition that is not sensitive to the metal, but is sensitive to the position of the vinyl group, with the para-substitution shifting the absorption to lower energy relative to the meta-substitution. In the Mo2 compounds 1A and 2A, there is a metal-to-ligand charge transfer from the Mo2δ orbital to the TiPB carboxylate at 330 nm. For the W2 compounds 1B and 2B, this transition occurs at 405 nm due to the raised energy of the δ orbital. Further to lower energy is the fully allowed 1MLCT transition from the M2δ orbital to the vinylbenzoate π* orbital. The observed energetic trends in the absorption maxima match those predicted by the TD-DFT calculations for the two ligand sets and two different metal centers. A table comparing the experimental and calculated absorptions can be found in the ESI.†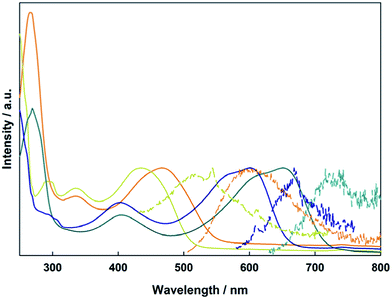 | ||
| Fig. 6 Electronic absorption (solid) and emission (dashed) of compounds 1A (yellow), 1B (blue), 2A (orange), and 2B (green) in THF. | ||
This MLCT transition is sensitive to both the selection of metal and the substitution pattern of the vinyl group on the benzoate ligand. For 1A, 2A, 1B, and 2B it occurs at 437 nm, 468 nm, 601 nm, and 651 nm, respectively. This trend can be easily understood by the locations of the M2δ and vinylbenzoate π* orbitals from the electronic structure calculations. The 1MLCT energy is lower for the W2 compounds (1B and 2B) relative to Mo2 compounds (1A and 2A) due to the raised energy of the W2δ orbital. The compounds with 4-vinylbenzoate (2A and 2B) as the ligand occur at lower energy due to the lower π* orbital relative to 3-vinylbenzoate (1A and 1B).
Also shown in Fig. 6 are the UV-visible emission spectra in THF for the four compounds described above. Upon irradiation into the MLCT absorption, these compounds show fluorescence from their 1MLCT states and the energy of the emission correlates with the energy of the 1MLCT absorption described above. The Mo2 compounds 1A and 2A also show phosphorescence from their lowest energy triplet state centered at 1100 nm, which is typical for Mo2 tetracarboxylates, and corresponds to emission from the 3MoMoδδ* state. Upon cooling to 77 K, the emission notably increases in intensity and a vibronic progression corresponding to the Mo–Mo stretch (∼350 cm−1) becomes visible. Compounds 1B and 2B show broad 1MLCT emissions in the visible and NIR extending to 1200 nm. There is no evidence of any phosphorescence from either W2 complex. The NIR emission data can be seen in the ESI Fig. S1.†
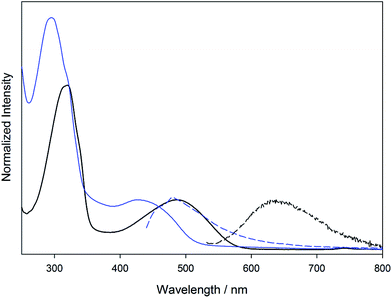
The electronic absorption and emission of 3A and 4A were taken in THF and can be seen in Fig. 7. These compounds show the same gross features as their parent Mo2 compounds 1A and 2A. For 3A, the addition of the phenyl substituent shifts the π–π* absorption to lower energy (295 nm) compared to the parent complex 1A. However, the energy of the 1MLCT absorption remains at almost the same wavelength (430 nm). For 4A, the π–π* absorption (319 nm) is shifted to lower energy than that in 2A (267 nm) and in 3A (295 nm). The 1MLCT energy shifts to lower energy (487 nm) relative to the parent 2A (467 nm) and to the meta-substituted 3A (430 nm).
The change in the energy of the π–π* and MLCT absorptions in 3A and 4A can be understood in terms of their substitution pattern. For 3A, the meta substitution pattern determines the outer phenyl-vinyl moiety is not in conjugation with the carboxylate or the Mo2 center. The π–π* is then located principally on the phenyl-vinyl-phenyl subunit and has no contribution from the carboxylate. The meta-substitution has no effect on the MLCT and therefore it behaves as if the ligand is simply a benzoate. For 4A, the entire ligand phenyl-vinyl-phenyl-CO2 is involved in the π–π* transition making it occur at slightly lower energy than in 3A. Since the substitution pattern is para in 4A, the MLCT spans the entire ligand and not just the simple benzoate as in 3A. This is shown pictorially in Fig. 8 with colored boxes denoting the subunits of the molecule involved in each transition for 3A and 4A.
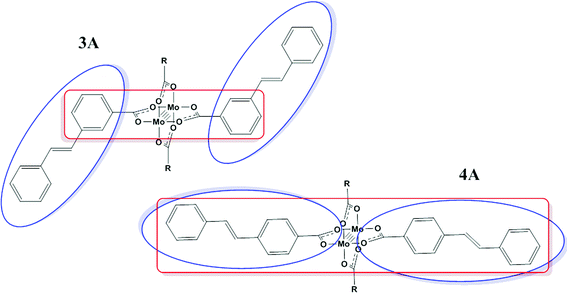 | ||
| Fig. 8 Location of the representative absorption bands π–π* (blue) and MLCT (red) present in 3A and 4A, where R = 2,4,6-triisopropylphenyl. | ||
Both 3A and 4A show emission from their 1MLCT states upon irradiation in THF that correlates energetically with the MLCT absorption (Fig. 7), similar to the emission of the parent compounds 1A and 2A. Both compounds also show emission in the NIR centered around 1100 nm. Upon cooling, vibronic features (∼350 cm−1) become visible and are associated with the Mo–Mo stretch. Combined, this leads to the assignment of 3MoMoδδ* emission as seen in the parent compounds 1A and 2A. The NIR emission spectra can be seen in the ESI Fig. S2.†
Transient absorption spectroscopy
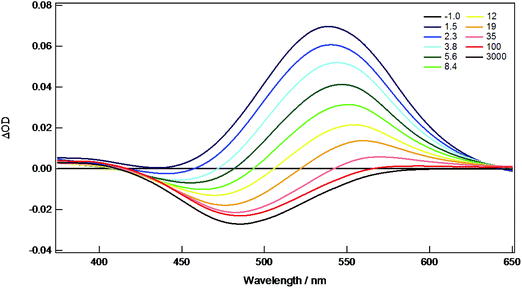
The new compounds 1A, 1B, 2A, 2B, 3A, and 4A were all investigated by nanosecond (ns) and femtosecond (fs) transient absorption (TA) spectroscopy in THF solution to monitor the singlet and triplet states. The fsTA spectra of 4A are shown as representative in Fig. 9. Here, there is a strong absorption centered on 540 nm present from the singlet state that decays within ∼9 ps to the triplet state represented by a persistent bleach at 480 nm that lasts beyond 3 ns. The kinetics of the singlet states were measured for all compounds and the lifetimes fall within 0.5–10 ps, typical for 1MLCT S1 states, and are listed in Table 2. The other TA spectra and kinetics are shown in ESI Fig. S3–S13.†| S1 lifetime | S1 assignment | T1 lifetime | T1 assignment | |
|---|---|---|---|---|
| 1A | 3.0 ps | 1MLCT | 89.5 μs | 3δδ* |
| 1B | 0.5 ps | 1MLCT | 3–10 ns | 3MLCT |
| 2A | 2.4 ps | 1MLCT | 64.3 μs | 3δδ* |
| 2B | 1.7 ps | 1MLCT | ∼30 ns | 3MLCT |
| 3A | 5.7 ps | 1MLCT | 58.1 μs | 3δδ* |
| 4A | 9.2 ps | 1MLCT | 63 μs | 3δδ* |
Estimation of the lifetimes of the triplet states for all compounds were made from the nsTA spectra primarily from the decay of the ground state bleaches. For the molybdenum compounds, the lifetimes are 50–90 μs. Spectra and kinetics are shown in ESI Fig. S14–S21.† This long lifetime coupled with the NIR emission is indicative of a 3MoMoδδ* T1 state. The W2 complexes 1B and 2B show much faster dynamics. For 1B, there is evidence of a long-lived component on the fsTA experiment but no features on the nsTA experiment. This indicates a triplet state with a lifetime of 3–10 ns which is between the resolutions of the two instruments. Compound 2B shows weak features on the nsTA experiment that decay in ∼30 ns. Spectra and kinetics are shown in ESI Fig. S22 and S23.† Previously, the T1 state of W2TiPB4 was determined to be 3WWδδ* with a lifetime of ∼1 μs and phosphorescence from this state was observed around 860 nm.16 The much faster triplet lifetimes of 1B and 2B coupled with the lack of phosphorescence lead to the assignment of a 3MLCT T1 state in the W2 complexes.
Upon examination of the S1 excited state lifetimes, some trends are revealed. The Mo2 complexes, 1A and 2A, show longer-lived S1 states when compared with their W2 counterparts, 1B and 2B. This may be attributed to the heavy atom effect and the larger spin orbit coupling of tungsten as compared to molybdenum. The shorter S1 lifetime of 3A compared with 4A may be a result of the mixing of the Mo2δ* as evidenced by the electronic structure calculations, vida supra, suggesting a more efficient pathway for conversion to the δδ* state.
Time-resolved infrared spectroscopy
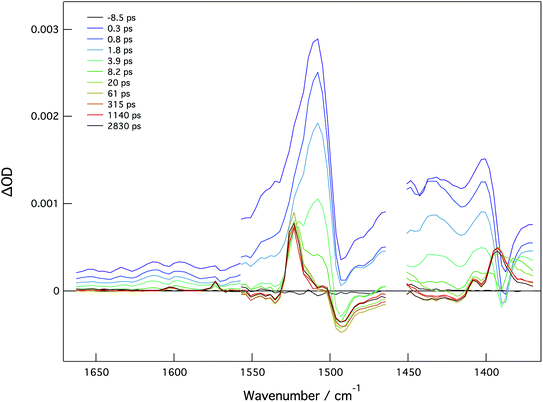
In order to examine charge distribution in the excited states of these molecules, compounds 2A, 2B, and 4A have been studied by fs time resolved infrared (TRIR) spectroscopy. In principle, the vibrational frequency of the vinyl group should be sensitive to the excited state electron distribution and therefore be able to provide insight into charge localization; however, this has not been shown to be the case. With the assistance of the electronic structure calculations employing time-dependent DFT, the dominant features are attributable to the phenyl ring stretches and the carboxylate stretching modes.For 2A, the TRIR spectra are shown in Fig. 10 and the kinetics can be seen in Fig. S24.† Present is a large transient at 1525 cm−1 that has been assigned to phenyl ring stretching mode. This feature decays with a lifetime of 3.5 ps, which is similar to the singlet lifetime found in the fsTA experiment for this compound. At long times, there are features that are associated with the carboxylate stretches and have previously been assigned as characteristic of the 3MoMoδδ* state. Specifically, the band at 1525 cm−1 is assignable to νas(CO2) of the T1 state that, relative to the ground state, has one less electron in the δ orbital which is involved in back-bonding to the CO2π*, thus causing the vibration to increase in energy.17
For 2B, the phenyl stretching mode is present as a transient in the singlet state at 1546 cm−1 and carboxylate stretches appear at 1481 cm−1 and 1405 cm−1 (ESI Fig. S25†). From the decay of these features, the singlet lifetime is estimated to be 2 ps, which is effectively the same lifetime that was determined by fsTA spectroscopy. There are several ligand vibrations at 1532 cm−1, 1503 cm−1, and 1405 cm−1 indicative of a long-lived triplet state as seen in the fsTA. Apparent is the lack of features associated with the δδ* state. This, coupled with the lack of phosphorescence is consistent with a 3MLCT T1 state.
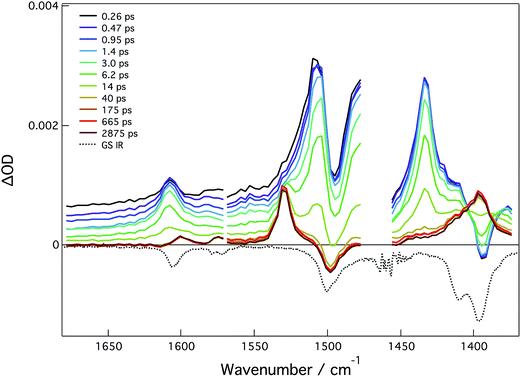
The ground state IR and fsTRIR of compound 4A were taken in THF and are largely dominated by –CO2 and phenyl ring stretching modes, see Fig. 11. In the ground state, the bands at 1607 cm−1 and 1570 cm−1 are assigned to phenyl ring stretching modes. The band at 1495 cm−1 is assigned to the νas(CO2) and the band at 1380 cm−1 to the νs(CO2). Upon excitation, there are four transients, which correspond to the two ν(CO2) stretching modes and the two phenyl ring stretching modes. From these features, the lifetime of the 1MLCT is estimated to be 10 ps, which is in good agreement with the fsTA data (ESI Fig. S26†). At longer times, the characteristic modes of the 3MoMoδδ* state are present indicating this as the T1 state.
The lack of clear vinyl features in the TRIR spectra preclude the assignment of excited state distribution. Instead of a discrete vinyl mode, the C![[double bond, length as m-dash]](https://www.rsc.org/images/entities/char_e001.gif) C stretch couples to the breathing modes of the phenyl rings as would be expected in the quinoidal form of the ligand in 4A, Fig. 12.
C stretch couples to the breathing modes of the phenyl rings as would be expected in the quinoidal form of the ligand in 4A, Fig. 12.
Previously, metal complexes bearing trans-stilbene or derivatives of trans-stilbene as ligands have been shown to undergo cis/trans isomerization upon photoexcitation. The complexes, fac-Re(CO)3(bpy)(X), where X = 1,2-bis(4-pyridyl)ethylene [bpe] or 4-styrylpyridine [stpy], were shown to undergo photoisomerization.18 These complexes were excited at 313 nm into a transition with IL and MLCT character, where photoisomerization then took place with quantum yields in the range of 0.003–0.46 depending upon the solvent. It was proposed that this isomerization occurs through a 3p* intermediate, where the olefin is twisted.19 In a related case, the bpe ligand was used to bridge two Re centers or Re and Os together in complexes of the form, [(CO)3(phen)Re(trans-bpe)Re(phen)(CO)3]2+ and [(phen)Re(CO)3(trans-bpe)Os(trpy)(bpy)]3+ respectively.20 In the bis Re case, photoisomerization occurred despite the bulky groups on either end of the bpe ligand. Conversely, no photoisomerization was observed for the mixed metal Re/Os which was attributed to a low lying MLCT state of the osmium unit that quenches the chemical reaction.
In this regard, it is worth exploring the potential for isomerization in 4A. After photoexcitation, we observe rapid internal conversion (<1 ps) to the 1MLCT S1 state, where the excited electron resides in a π* orbital and the hole remains on the Mo2δ orbital. This MLCT state lies lower in energy than the π–π* states responsible for isomerization thereby preventing photoisomerization from occurring similar to that seen in the mixed Re/Os case discussed above.
Conclusions
Several new vinylbenzoate supported M2 bis–bis complexes were prepared including two compounds, 3A and 4A, by the Heck cross coupling reactions involving 1A and 2A, respectively. Based on this work the prospect of performing carbon–carbon cross coupling reactions on the periphery of M2 complexes in the preparation of extended structures containing M2 quadruply bonded units looks promising. The photophysical properties of the new compounds have been explored, but the vinyl groups did not prove to be viable IR reporters of excited localization or delocalization across the M2 center. Alternatively, the use of C![[triple bond, length as m-dash]](https://www.rsc.org/images/entities/char_e002.gif) X functionalities, where X = N, O, or CR, has proved largely successful in the determination of charge localization or delocalization in M2 complexes.13,21,22
X functionalities, where X = N, O, or CR, has proved largely successful in the determination of charge localization or delocalization in M2 complexes.13,21,22
Experimental section
General methods
All reactions were performed under 1 atm of UHP argon using standard Schlenk or glovebox techniques. Solvents were dried and distilled from the appropriate drying agents and then degassed prior to use. Solvents were stored over 4 Å molecular sieves in flasks with Kontes tops. Manipulations of the studied compounds were performed under nitrogen inside a glovebox or under argon on a Schlenk line.NMR spectra were recorded on a 400 MHz Bruker DPX Advance 400 spectrometer or a 500 MHz DPX Advance 500 spectrometer. All 1H NMR chemical shifts are in parts per million (ppm) relative to the protio impurity in THF-d8 at 1.73 ppm.
High resolution matrix-assisted laser desorption ionization time-of-flight (MALDI-TOF) mass spectra were obtained on a Bruker Microflex mass spectrometer for 1A and 2A and calibrated using an internal standard. All other samples were analyzed on a Bruker ultrafleXtreme mass spectrometer run in positive mode. The measurements for 1B, 2B, 3A, and 4A were standardized using 9 peptides with molecular weights ranging from 750 g mol−1 to 3100 g mol−1. These peptides were supported in a matrix of HCCA. Dithranol was used as the matrix. Samples were prepared by adding a solution of the matrix to the solid sample. This was then spotted on the plate for analysis. Also, the observed isotope pattern for each sample has been correlated to the predicted pattern based on the given formulation.
3-Vinylbenzoic acid and 4-vinylbenzoic acid were purchased from Alfa Aesar and used as received. Mo2TiPB4 and W2TiPB4 were synthesized from known procedures.16,23 Iodobenzene and palladium(II) acetate were purchased from Sigma Aldrich. Iodobenzene was degassed by freeze–pump–thaw and stored over 4 Å molecular sieves in a Kontes top flask under argon.
Electronic structure calculations
Density functional theory was used to perform electronic structure calculations on model complexes utilizing the Gaussian 09 suite of programs.24 The Becke three parameter correlation functional combined with the Lee, Yang, and Parr exchange functional was employed (B3LYP).25,26 Model complexes were optimized in the gas phase to a minimum as confirmed by the lack of imaginary frequencies in a vibrational analysis. For C, H, and O the 6-31g* basis set was used. For Mo and W, the Stuttgart/Dresden energy-consistent pseudopotential (SDD) was used to represent the core orbitals and the SDD basis set.27Formate was used instead of TiPB in order to simplify the calculations and save on computational resources. This substitution allows the complexes to obtain an idealized symmetry higher than that with TiPB. The complexes were idealized to the highest symmetry possible while still containing an inversion center. A correction factor of 0.96 was applied to the calculated vibrational frequencies to correlate them with experimentally observed frequencies.
Visualizations of the molecular orbitals was performed with GaussView 5.0 with an isovalue of 0.02.
Electronic absorption and emission
Steady-state electronic absorption and UV-visible emission measurements were carried out with 1.0 × 1.0 cm quartz cuvettes equipped with Kontes stopcocks. Electronic absorption spectra at room temperature were recorded using a Perkin-Elmer Lambda 900 spectrometer in THF solution.Fluorescence measurements were made on a SPEX Fluoromax-2 spectrofluorometer in the UV-visible region in THF solution. The compounds were irradiated into their MLCT absorption bands. Emission measurements in the near-infrared region were performed in J. Young NMR tubes at room temperature and 77 K in 2-methyl THF. Spectra were recorded on a home-built instrument equipped with a germanium detector. Samples were irradiated into their MLCT bands. On the NIR setup, this was done with either 405 nm (1A–4A) or 658 nm (1B, 2B). Samples were prepared with an absorbance of <0.3.
Crystallographic information
Single crystals of 1A and 2A were isolated as yellow and orange blocks, respectively, and handled under a pool of fluorinated oil. Examination of the diffraction pattern was done on a Nonius Kappa CCD diffractometer with Mo Kα radiation. All work was done at 150 K using an Oxford Cryosystems Cryostream Cooler. Data integration was done with Denzo, and scaling and merging of the data was done with Scalepack.28The structures were solved by the direct methods program in SHELXS-13.29 Full-matrix least-squares refinements based on F2 were performed in SHELXL-13,29 as incorporated in the WinGX package.30 For each methyl group, the hydrogen atoms were added at calculated positions using a riding model with U(H) = 1.5Ueq (bonded carbon atom). The rest of the hydrogen atoms were included in the model at calculated positions using a riding model with U(H) = 1.2Ueq (bonded atom). Neutral atom scattering factors were used and include terms for anomalous dispersion.31 One isopropyl group in the TiPB moiety of 1A was disordered over two locations. This disorder was modeled using similarity restraints as well as rigid bond restraints to ensure reasonable bond lengths and anisotropic displacement parameters. The occupancy of these two parts was allowed to refine on a free variable leading to an occupancy of ∼54% in the major component.
Compound 2A had disorder in the p-vinyl moiety. This disorder was handled similarly to that in 1A and the occupancy of the major component refined to be ∼50%. After final refinement of 2A several residual ‘Q’ peaks remained in the difference map and were unable to be adequately modeled as solvent. To remove this electron density the SQUEEZE32 protocol of the PLATON33 suite of programs was used to exclude 45 electrons from a void of 250 Å3. This electron density likely corresponds to disordered hexanes used in crystallization of 2A.†
Time-resolved spectroscopy
Nanosecond TA was performed on samples in 1 × 1 cm square quartz cuvettes with Kontes stopcocks.34 Measurements were made on a home-built instrument pumped by a frequency-doubled (532 nm) or frequency tripled (355 nm) Spectra-Physics GCR-150 Nd:YAG laser (fwhm ≈ 8 ns, ∼5 mJ per pulse). The power at the sample was set to 100 mW Signal from a Hamamatsu R928 photomultiplier tube was processed with a Tektronics 400 MHz oscilloscope (TDS 380). For 1A, 1B, 2B, and 3A the samples were excited with 355 nm and for 2A and 4A the samples were excited at 532 nm with laser power at the sample of 100 mW.Femtosecond transient absorption experiments were performed with a Ti:sapphire and regenerative amplifier combination (1 kHz, 50 fs full width at half-maximum) that has been previously described.35 Samples were prepared with absorbances of ∼0.3–0.8 in a 1.0 mm quartz cuvette with Kontes top. Excitation power at the sample was 1–2 μJ. Spectra collected underwent wavelength calibration and group velocity dispersion corrections.
Time-resolved infrared36 spectroscopy experiments, previously described, were performed with a Ti:sapphire and regenerative amplifier combination (1 kHz, 50 fs fwhm). Samples of 2A, 2B and 4A were prepared with an absorbance of ∼1 at λmax in THF solution. A PerkinElmer semi-demountable cell with a 0.1 mm Teflon spacer between 4 mm CaF2 windows was used to provide an airtight sample chamber. The compounds 2A, 2B, and 4A were excited with a laser power of ∼1 μJ at 515 nm, 515 nm and 675 nm, respectively.
In general, kinetics were fit to a sum of exponential decay terms, S(t) = ∑iAi![[thin space (1/6-em)]](https://www.rsc.org/images/entities/char_2009.gif) exp(−1/τi) + C, using Igor Pro 6.0 or SigmaPlot 12.0, where Ai is the amplitude, τ is the lifetime, and C is an offset. Error bars for the lifetimes are reported as standard errors of the exponential fits.
exp(−1/τi) + C, using Igor Pro 6.0 or SigmaPlot 12.0, where Ai is the amplitude, τ is the lifetime, and C is an offset. Error bars for the lifetimes are reported as standard errors of the exponential fits.
Synthesis
Mo2(TiPB)2(3VB)2 [1A]. Mo2TiPB4 [520 mg, 0.440 mmol] and 3-vinylbenzoic acid [130 mg, 0.878 mmol] were added to a Schlenk flask and toluene [40 mL] was added. The flask stirred for 3 days after which a yellow precipitate had formed. The solvent was reduced in vacuo to 5 mL and hexanes [30 mL] added to fully precipitate the product. The yellow solid was then filtered and washed with further hexanes [2 × 30 mL] and dried under vacuum [325 mg, 75%]. 1H NMR (THF-d8): δH (400 MHz) 8.43 (s, 2H), 8.26 (d, 2H, JHH = 8 Hz), 7.67 (d, 2H, JHH = 8 Hz), 7.54 (t, 2H, JHH = 8 Hz), 6.99 (d, 2H, JHH = 8 Hz), 6.88 (dd, 2H, JHH = 11 Hz, 17 Hz), 5.89 (d, 2H, JHH = 11 Hz), 5.31 (d, 2H, JHH = 11 Hz), 3.04 (sep, 4H, JHH = 6.9 Hz), 2.87 (sep, 2H, JHH = 7.7 Hz), 1.23 (d, 12H, JHH = 7.7 Hz), 1.02 (d, 24H, JHH = 6.9 Hz). MALDI-TOF calculated monoisotopic MW for C50H60Mo2O8: 981. Found: 981.6 (M+). UV-vis (THF): 437 nm, 337 nm, 296 nm.W2(TiPB)2(3VB)2 [1B]. W2TiPB4 [245 mg, 0.184 mmol] and 3-vinylbenzoic acid [51 mg, 0.331 mmol] were weighed out and added to a Schlenk flask. Toluene [15 mL] was added and the reaction stirred for 5 days. The solvent was then removed in vacuo and the residue suspended in hexanes [15 mL]. This was then filtered and washed further with hexanes [2 × 30 mL]. The desired product was then isolated as a maroon powder after drying under vacuum [148 mg, 70%]. 1H NMR (THF-d8): δH (400 MHz) 8.22 (s, 2H), 8.05 (d, 2H, JHH = 8 Hz), 7.52 (t, 2H, JHH = 8 Hz), 7.44 (d, 2H, JHH = 8 Hz), 6.98 (s, 4H, JHH = 8 Hz), 6.84 (dd, 2H, JHH = 11 Hz, 17 Hz), 5.89 (d, 2H, JHH = 11 Hz), 5.30 (d, 2H, JHH = 17 Hz), 2.84 (m, 6H), 1.21 (d, 12H, JHH = 7 Hz), 0.97 (d, 24H, JHH = 7.5 Hz). MALDI-TOF calculated monoisotopic MW for C50H60W2O8: 1156.33. Found: 1156.55 (M+). UV-vis (THF): 601 nm, 563 nm, 401 nm.
Mo2(TiPB)2(4VB)2 [2A]. Mo2TiPB4 [405 mg, 0.343 mmol] and 4-vinylbenzoic acid [102 mg, 0.689 mmol] were added to a Schlenk flask. Toluene [30 mL] was added and the flask stirred for 3 days after which, an orange precipitate had formed. The solvent was reduced in vacuo to 5 mL toluene and hexanes [30 mL] was added to fully precipitate the product. The product was then filtered and washed with hexanes [2 × 30 mL] then dried under vacuum to leave an orange powder [270 mg, 80%]. 1H NMR (THF-d8): δH (400 MHz) 8.33 (d, 4H, 8.8 Hz), 7.65 (d, 4H, JHH = 8.8 Hz), 6.99 (s, 4H), 6.88 (dd, 2H, JHH = 11.5 Hz, 17.2 Hz), 5.89 (d, 2H, JHH = 11.2 Hz), 5.36 (d, 2H, JHH = 17.5 Hz), 3.04 (sep, 4H, JHH = 7.0 Hz), 2.87 (sep, 2H, JHH = 7.2 Hz), 1.23 (d, 12H, JHH = 6.8 Hz), 1.03 (d, 24H, JHH = 6.8 Hz). MALDI-TOF calculated monoisotopic MW for C50H60Mo2O8: 981. Found: 981.6 (M+). UV-vis (THF): 467 nm, 335 nm, 267 nm.
W2(TiPB)2(4VB)2 [2B]. W2TiPB4 [255 mg, 0.180 mmol] and 4-vinylbenzoic acid [49 mg, 0.368 mmol] were weighed out and added to a Schlenk flask. To this was added 15 mL of toluene and the flask stirred for 5 days. Upon mixing, a blue solution and blue precipitate formed. The solvent was removed in vacuo and the residue stirred in hexanes, filtered and washed with further hexanes [2 × 30 mL]. The blue solid was then dried under vacuum [169 mg, 69%]. 1H NMR (THF-d8): δH (400 MHz) 8.10 (d, 4H, 7 Hz), 7.65 (d, 4H, JHH = 7 Hz), 6.98 (s, 4H), 6.89 (dd, 2H, JHH = 11.1 Hz, 17.7 Hz), 5.82 (d, 2H, JHH = 17.2 Hz), 5.36 (d, 2H, JHH = 11.2 Hz), 2.84 (m, 6H), 0.97 (d, 24H, JHH = 7 Hz). MALDI-TOF calculated monoisotopic MW for C50H60W2O8: 1156.33. Found: 1156.57 (M+). UV-vis (THF): 652 nm, 605 nm, 405 nm, 269 nm.
Mo2(TiPB)2(3VB-Ph)2 [3A]. Mo2(TiPB)2(3VB)2 [ 100 mg, 0.101 mmol], and palladium(II) acetate [2 mg, 0.009 mmol] were added to a Kontes top flask and dissolved in THF [5 mL]. To this was added iodobenzene [312 mg, 1.53 mmol] in THF [3 mL] and Et3N [3 mL]. The flask was sealed and then heated to 75 °C for 72 hours after which the yellow color became more intense. The solution was filtered through a bed of celite and the solvent removed in vacuo. The residue was then washed with hexanes [2 × 10 mL], dissolved in a minimum amount of THF [2 mL] and the product precipitated as a yellow powder with hexanes [10 mL]. The yellow powder was then filtered and dried under vacuum, [80 mg, 70%]. 1H NMR (THF-d8): δH (500 MHz) 8.560 (s, 2H), 8.27 (d, 2H, JHH = 7.6 Hz), 7.82 (d, 2H, JHH = 7.7 Hz), 7.58 (m, 6H), 7.29–7.36 (m, 8H), 7.23 (t, 2H, JHH = 7.3 Hz), 6.99 (s, 4H), 3.06 (sep, 4H, JHH = 6.9 Hz), 2.86 (sep, 2H, JHH = 6.9 Hz), 1.20 (d, 12H, JHH = 6.9 Hz), 1.05 (d, 24H, JHH = 6.9 Hz). MALDI-TOF calculated monoisotopic MW for C62H68Mo2O8: 1133.30. Found: 1133.53 (M+). UV-vis (THF): 427 nm, 318 nm (sh), 295 nm.
Mo2(TiPB)2(4VB-Ph)2 [4A]. Mo2(TiPB)2(4VB)2 [200 mg, 0.202 mmol], and palladium(II) acetate [10 mg, 0.045 mmol] were added to a Kontes top flask and dissolved in THF [5 mL]. To this was added iodobenzene [680 mg, 3.33 mmol] in THF [5 mL] and Et3N [6 mL]. The flask was sealed and then heated to 65 °C for 4 days after which the orange color became more intense. The solution was evaporated to dryness in vacuo and the residue dissolved in THF [10 mL]. This was filtered through a bed of celite and the solvent removed in vacuo. The residue then stirred in hexanes [10 mL] for 24 hours, filtered, and washed further with hexanes [3 × 20 mL]. Further purification involved recrystallization by vapor diffusion of hexanes into a THF solution. The orange powder was then dried under vacuum [175 mg, 75%]. 1H NMR (THF-d8): δH (500 MHz) 8.36 (d, 4H, JHH = 8.1 Hz), 7.77 (d, 4H, JHH = 8.2 Hz), 7.62 (d, 4H, JHH = 8.0 Hz), 7.36 (m, 8H), 7.25 (t, 2H, JHH = 6.7 Hz), 6.99 (s, 4H), 3.05 (sep, 4H, JHH = 6.7 Hz), 2.86 (sep, 4H, JHH = 6.9 Hz), 1.22 (d, 12H, JHH = 6.8 Hz), 1.04 (d, 24H, JHH = 6.9 Hz) MALDI-TOF calculated monoisotopic MW for C62H68Mo2O8: 1133.30. Found: 1133.55 (M+). UV-vis (THF): 486 nm, 318 nm.
Acknowledgements
We thank the National Science Foundation for funding on grant numbers CHE-1266298 and CHE-0957191 and the Ohio Supercomputer Center for computational resources. We are grateful to Professor Terry L. Gustafson and the Ohio State University Center for Chemical and Biophysical Dynamics for use of the laser systems and to Professor Claudia Turro for use of instrumentation and helpful discussions. S. E. Brown-Xu acknowledges support from the NSF GRFP. The authors thank William T. Kender for obtaining the MALDI data. The MALDI for the W2 compounds and the Mo2 coupled products was supported by NIH Award Numbers 1 S10 RR025660-01A1 and P30 CA016058. We also thank the reviewers for their careful reading of the manuscript.Notes and references
- J. H. Burroughes, D. D. C. Bradley, A. R. Brown, R. N. Marks, K. Mackay, R. H. Friend, P. L. Burns and A. B. Holmes, Nature, 1990, 347, 539–541 CrossRef CAS.
- D. Braun and A. J. Heeger, Thin Solid Films, 1992, 216, 96–98 CrossRef CAS.
- G. Yu, J. Gao, J. C. Hummelen, F. Wudl and A. J. Heeger, Science, 1995, 270, 1789–1791 CAS.
- F. Hide, M. A. DÍaz-GarcÍa, B. J. Schwartz and A. J. Heeger, Acc. Chem. Res., 1997, 30, 430–436 CrossRef CAS.
- P. F. Barbara, A. J. Gesquiere, S.-J. Park and Y. J. Lee, Acc. Chem. Res., 2005, 38, 602–610 CrossRef CAS PubMed.
- J. R. Sheats, Y.-L. Chang, D. B. Roitman and A. Stocking, Acc. Chem. Res., 1999, 32, 193–200 CrossRef CAS.
- H. Bässler and B. Schweitzer, Acc. Chem. Res., 1999, 32, 173–182 CrossRef.
- J. J. M. Halls, C. A. Walsh, N. C. Greenham, E. A. Marseglia, R. H. Friend, S. C. Moratti and A. B. Holmes, Nature, 1995, 376, 498–500 CrossRef CAS.
- Z. Peng and L. Yu, J. Am. Chem. Soc., 1996, 118, 3777–3778 CrossRef CAS.
- C. T. Wong and W. K. Chan, Adv. Mater., 1999, 11, 455–459 CrossRef CAS.
- Y. Liu, Y. Li and K. S. Schanze, J. Photochem. Photobiol., C, 2002, 3, 1–23 CrossRef CAS.
- T. Ren, Chem. Rev., 2008, 108, 4185–4207 CrossRef CAS PubMed.
- S. E. Brown-Xu, M. H. Chisholm, C. B. Durr and T. F. Spilker, J. Am. Chem. Soc., 2013, 135, 8254–8259 CrossRef CAS PubMed.
- G. T. Burdzinski, M. H. Chisholm, P.-T. Chou, Y.-H. Chou, F. Feil, J. C. Gallucci, Y. Ghosh, T. L. Gustafson, M.-L. Ho, Y. Liu, R. Ramnauth and C. Turro, Proc. Natl. Acad. Sci. U. S. A., 2008, 105, 15247–15252 CrossRef CAS PubMed.
- F. Albert Cotton, R. A. Walton, and C. A. Murillo, Multiple bonds between metal atoms, Oxford, Oxford, 3rd edn, 2005 Search PubMed.
- B. G. Alberding, M. H. Chisholm, Y.-H. Chou, J. C. Gallucci, Y. Ghosh, T. L. Gustafson, N. J. Patmore, C. R. Reed and C. Turro, Inorg. Chem., 2009, 48, 4394–4399 CrossRef CAS PubMed.
- B. G. Alberding, M. H. Chisholm and T. L. Gustafson, Inorg. Chem., 2011, 51, 491–498 CrossRef PubMed.
- A. S. Polo, M. K. Itokazu, K. M. Frin, A. O. de Toledo Patrocínio and N. Y. Murakami Iha, Coord. Chem. Rev., 2006, 250, 1669–1680 CrossRef CAS.
- D. M. Dattelbaum, M. K. Itokazu, N. Y. Murakami Iha and T. J. Meyer, J. Phys. Chem. A, 2003, 107, 4092–4095 CrossRef CAS.
- M. K. Itokazu, A. S. Polo and N. Y. M. Iha, J. Photochem. Photobiol., A, 2003, 160, 27–32 CrossRef CAS.
- B. G. Alberding, M. H. Chisholm, J. C. Gallucci, Y. Ghosh and T. L. Gustafson, Proc. Natl. Acad. Sci. U. S. A., 2011, 108, 8152–8156 CrossRef CAS PubMed.
- S. E. Brown-Xu, M. H. Chisholm, C. B. Durr, S. A. Lewis, T. F. Spilker and P. J. Young, Inorg. Chem., 2014, 53, 637–644 CrossRef CAS PubMed.
- F. A. Cotton, L. M. Daniels, E. A. Hillard and C. A. Murillo, Inorg. Chem., 2002, 41, 1639–1644 CrossRef CAS PubMed.
- M. J. Frisch, G. W. Trucks, H. B. Schlegel, G. E. Scuseria, M. A. Robb, J. R. Cheeseman, G. Scalmani, V. Barone, B. Mennucci, G. A. Petersson, H. Nakatsuji, M. Caricato, X. Li, H. P. Hratchian, A. F. Izmaylov, J. Bloino, G. Zheng, J. L. Sonnenberg, M. Hada, M. Ehara, K. Toyota, R. Fukuda, J. Hasegawa, M. Ishida, T. Nakajima, Y. Honda, O. Kitao, H. Nakai, T. Vreven, J. A. Montgomery Jr, J. E. Peralta, F. Ogliaro, M. Bearpark, J. J. Heyd, E. Brothers, K. N. Kudin, V. N. Staroverov, R. Kobayashi, J. Normand, K. Raghavachari, A. Rendell, J. C. Burant, S. S. Iyengar, J. Tomasi, M. Cossi, N. Rega, J. M. Millam, M. Klene, J. E. Knox, J. B. Cross, V. Bakken, C. Adamo, J. Jaramillo, R. Gomperts, R. E. Stratmann, O. Yazyev, A. J. Austin, R. Cammi, C. Pomelli, J. W. Ochterski, R. L. Martin, K. Morokuma, V. G. Zakrzewski, G. A. Voth, P. Salvador, J. J. Dannenberg, S. Dapprich, A. D. Daniels, Ö. Farkas, J. B. Foresman, J. V. Ortiz, J. Cioslowski and D. J. Fox, Gaussian 09, Revision A.1, Gaussian, Inc., Wallingford CT, 2009 Search PubMed.
- B. Miehlich, A. Savin, H. Stoll and H. Preuss, Chem. Phys. Lett., 1989, 157, 200–206 CrossRef CAS.
- C. Lee, W. Yang and R. G. Parr, Phys. Rev. B: Condens. Matter Mater. Phys., 1988, 37, 785–789 CrossRef CAS.
- M. H. Chisholm, J. S. D'Acchioli and C. M. Hadad, J. Cluster Sci., 2006, 18, 27–49 CrossRef.
- Z. Otwinowski and W. Minor, Methods in Enzymology, Vol. 276: Macromolecular Crystallography, Part A, Academic Press, 1997 Search PubMed.
- G. Sheldrick, Acta Crystallogr., Sect. A: Found. Crystallogr., 2008, 64, 112–122 CrossRef CAS PubMed.
- L. Farrugia, J. Appl. Crystallogr., 1999, 32, 837–838 CrossRef CAS.
- A. J. C. Wilson and V. Geist, International Tables for Crystallography, Volume C, Kluwer Academic Publishers, Dordrecht, 1992 Search PubMed.
- P. Van Der Sluis and A. L. Spek, Acta Crystallogr., Sect. A: Found. Crystallogr., 1990, 46, 194–201 CrossRef.
- A. L. Spek, Acta Crystallogr., Sect. A: Found. Crystallogr., 1990, 46, C34 Search PubMed.
- M. J. Byrnes, M. H. Chisholm, J. A. Gallucci, Y. Liu, R. Ramnauth and C. Turro, J. Am. Chem. Soc., 2005, 127, 17343–17352 CrossRef CAS PubMed.
- G. Burdzinski, J. C. Hackett, J. Wang, T. L. Gustafson, C. M. Hadad and M. S. Platz, J. Am. Chem. Soc., 2006, 128, 13402–13411 CrossRef CAS PubMed.
- J. Wang, G. Burdzinski, J. Kubicki and M. S. Platz, J. Am. Chem. Soc., 2008, 130, 11195–11209 CrossRef CAS PubMed.
Footnote |
| † Electronic supplementary information (ESI) available: Transient absorption plots and kinetics, time resolved IR plots, NIR emission. CCDC 1015787 and 1015788. For ESI and crystallographic data in CIF or other electronic format see DOI: 10.1039/c4sc02542c |
| This journal is © The Royal Society of Chemistry 2015 |

