
Assessing changes in high school students' conceptual understanding through concept maps before and after the computer-based predict–observe–explain (CB-POE) tasks on acid–base chemistry at the secondary level
Fatma
Yaman
*a and
Alipaşa
Ayas
b
aBozok University – Faculty of education, Science education department, Yozgat 66100, Turkey. E-mail: fatma.yaman@bozok.edu.tr
bBilkent University – Faculty of education, Department of Curriculum and Instruction, Ankara, Turkey
First published on 22nd July 2015
Abstract
Although concept maps have been used as alternative assessment methods in education, there has been an ongoing debate on how to evaluate students' concept maps. This study discusses how to evaluate students' concept maps as an assessment tool before and after 15 computer-based Predict–Observe–Explain (CB-POE) tasks related to acid–base chemistry. 12 high school students participated in this study. Students' concept maps were evaluated taking into account three parts: qualitative, quantitative and representational level. The results gathered from the quantitative analysis of the pre and post concept maps were analyzed using SPSS 17.0. The results showed that there is a significant difference between students' pre and post concept map scores (z = 3.05; p < 0.05). From the qualitative analysis of the concept maps, the majority of the students constructed their pre and post concept maps non-hierarchically; while they drew more interconnected concept maps after the CB-POE tasks. Regarding their representational level, the students used the macroscopic level more often than microscopic and symbolic levels in both their pre and post concept maps. Nonetheless, they increased the number of macroscopic, microscopic and symbolic level representations in their post concept maps. The paper concludes with suggestions and implications for educators and researchers to improve the quality of concept map evaluation.
Introduction
Concept maps are two dimensional graphical representations that display concepts and describe the relationship among the concepts. They have been used for several purposes in science education. One of the purposes is for assessment (Novak and Gowin, 1984; Markham et al., 1994; Ruiz-Primo and Shavelson, 1996; Kinchin et al., 2000; Martin et al., 2000; Kaya, 2008). Assessment is a key process that includes examining students' ideas and conceptual understanding of any topic and/or teaching–learning environment (Heron, 1981; Driver and Scott, 1996). In traditional education systems, open/close-ended questions and multiple choice tests are most commonly used to assess students' understanding (Kala et al., 2013). However, understanding is very sophisticated and it cannot be assessed by using a single test score. Also, a person's understanding cannot be adequately interpreted by taking into account a single statistical data. There has been low reliability in selection type tests, including the multiple-choice tests, because of the chance factor and there are difficulties in assessing open-ended questions because of deviations from objectivity (Linn and Gronlund, 2000).With concept map analysis, these difficulties and limitations can be overcome. At the same time, detailed information about students' knowledge structure and conceptual understanding can be better acquired. However, using concept maps as an assessment method revealed questions on how best to analyze them. Although concept maps have been analyzed both quantitatively and qualitatively, researchers generally prefer to use quantitative analysis. On the other hand, some researchers argue that using quantitative analysis omits important information and data (Kinchin et al., 2000). Moreover, others indicate that qualitative concept map analysis reveals more cognitive change than the quantitative analysis (Özgün-Koca and Şen, 2004).
Assessing students' concept maps either quantitatively or qualitatively may reveal some problems since they have different purposes. If researchers or teachers use only quantitative analysis, this means that they want to examine developments on pupils' learning process. If they use only qualitative analysis, they want to examine pupils' learning difficulties, knowledge and opinions related to a certain topic (Şen and Aykutlu, 2008). Teachers and researchers may limit their understanding if they use only one type of analysis. Research has shown that there are few studies combining qualitative and quantitative methods (Şen and Özgün-Koca, 2003; Bak Kibar et al., 2013). It is known that conceptual understanding is related to the macroscopic, microscopic and symbolic levels of representations in chemistry, and that students have difficulties in transitions between these levels (Nakhleh and Krajcik, 1994; Ardac and Akaygun, 2004). However, there has been limited research on how to evaluate students' representational level in concept maps. This study offers a new approach to analyze students' concept maps in addition to qualitative and quantitative analysis, the researchers propose concept map analysis related to macroscopic, microscopic and symbolic levels of representations, which has not been reported in the literature yet. Thus, the purpose of this study is to evaluate Turkish high school students' conceptual understanding of acid–base chemistry in terms of quantitative, qualitative and representational level analysis, using concept maps before and after they conduct 15 computer based POE (CB-POE) tasks.
The research questions that guide this study are as follows:
1. How can students' pre and post concept maps be used as an assessment tool to describe changes in conceptual understanding of acid–base chemistry before and after the CB-POE tasks?
2. What type of representational level do high school students use while constructing their concept maps?
3. What types of concept map structure do high school students choose when they construct concept maps related to acid–base chemistry?
Theoretical background
Concept mapping
Concept maps are a graphical tool and a portrayal of a mental model. It gives students an opportunity to organize their knowledge systematically and reflect on their understanding of a topic, including their experiences, beliefs and perceptions. Organization of knowledge can facilitate learning by assisting memory search and aiding recall. Thus, constructing concept maps has benefits both to students and teachers since they recognize new relationships and new meanings, which they did not consciously hold before making concept maps (Kinchin et al., 2000; Vanides et al., 2005).Since individuals construct and reconstruct the meaning of the phenomena they have observed all their lives, knowledge is created rather than discovered according to a constructivist view of learning. Concept mapping is compatible with this point of view and it best describes our perspective in this study (Hinton and Nakhleh, 1999); this study investigates the assessment of students' understanding and examines the development of students' conceptual understanding and their macroscopic, microscopic and symbolic representations of acids and bases.
Multiple representations (macro, micro and symbolic representations) in chemical education
Learning chemistry involves understanding phenomena with representations, and one of the reasons that students have difficulties in understanding the chemical phenomena is related to those representational systems (Johnstone, 1993). Understanding a concept requires individuals to organize knowledge as a propositional network, linking together various related sub-concepts and constructing cross-links between these sub-concepts (Novak and Gowin, 1984). To be able to organize and display chemical knowledge, students should represent it using one or more representational systems (Bodner, 1992).There are three representational systems that have been used with several terms in the chemical education literature. The first is referred to as the “macro level, macroscopic level, macroscopic system, macroscopic world”; the second is referred to as the “sub-micro level, microscopic level, submicro level, submicroscopic level, molecular world, atomic world”; finally the third is referred to as the “symbolic level, symbolic world, symbolic system, algebraic system” (Gilbert and Treagust, 2009). In this study, we used the “the macroscopic, microscopic and symbolic levels” terms. In this context, the macroscopic level is described as visible, tangible phenomena in the everyday life of learners' experiences. These phenomena include color changes, pH of a solution and so on; for example, acid tastes sour, bases have a pH > 7, and acid turns to red with blue litmus paper. The microscopic level is described as atoms, molecules and ions; for example, acids donate hydrogen ions or bases are proton acceptors. The symbolic level is described as chemical symbols, equations, stoichiometry and mathematical operation; for example, H2SO4, NaOH or a pH graph (Johnstone, 1993; Nakhleh and Krajcik, 1994; Chandrasegaran et al., 2008; Gilbert and Treagust, 2009).
Since conceptual understanding is closely related to macroscopic, microscopic and symbolic levels, it is important to help students see the connections among the three levels (Gabel, 1999). However, students are not often able to translate one given representation level to another because of insufficient conceptual knowledge (Keig and Rubba, 1993). Students are expected to think at the molecular level and explain the changes at the macroscopic level taking into account the attractions between atoms and molecules. Research has shown that students have difficulties in understanding the phenomena at the molecular level even though they are encouraged to think at the microscopic level (Ben-Zvi et al., 1986; Nakhleh and Krajcik, 1994; Treagust and Chandrasegaran, 2009). Furthermore, it is reported that even though students write the correct equations, symbols and formulas, they have difficulties in explaining their meaning (Nurrenbern and Pickering, 1987; Smith and Metz, 1996). Therefore, teachers should provide opportunities for students in the classrooms to use these representational levels and develop an assessment to reveal students' representational levels (Hinton and Nakhleh, 1999). In this context, we explained a different assessment method for concept map analysis in terms of representational levels.
Evaluating concept maps
Concept maps can be evaluated qualitatively and quantitatively. Research has shown that there are different ways of analyzing concept maps quantitatively. There are three important scoring methods for concept maps: (i) holistic scoring method (McClure et al., 1999), (ii) relational scoring method (Mcclure and Bell, 1990; McClure et al., 1999; Vanides et al., 2005), and (iii) structural scoring method (Novak and Gowin, 1984; Martin et al., 2000).In the holistic scoring method, students' overall understandings of the concepts represented by the map are examined and each map is assigned a score on a scale from 1 to 10. McClure et al. (1999) reported that while the instructions for holistic scoring are simple, the actual scoring task might be cognitively complex. Besides, they revealed that the holistic structural method requires broad subjective assessment of complex structure that may be difficult for the teacher to explain or justify to other concerned individuals.
The relational scoring method (Mcclure and Bell, 1990; McClure et al., 1999) focuses on propositions and considers the accuracy of labels and directions of the arrows in the concept map. Vanides et al. (2005) used a four-level rubric to evaluate the quality of the propositions in the relational scoring method. Lopez et al. (2014) investigated the influence of prior science achievement and ethnicity on students' knowledge structure using Vanides et al. (2005)'s proposition scoring system. Scoring propositions provided them quantitative information about the accuracy of students' knowledge structure. Kaya (2008) categorized propositions into three sub-criteria as valid, unclear and incorrect to determine the accuracy of the propositions. All these studies showed that scoring propositions in concept maps are valid and reliable to describe students' conceptual understanding, meaningful learning and knowledge structure.
In our study, we scored students' propositions to evaluate their conceptual understanding and meaningful learning. Therefore, we used a method that has not been apparent in the literature by categorizing the propositions into five categories: ‘sound understanding,’ ‘partial understanding,’ ‘and misconception,’ ‘wrong understanding,’ and ‘blank’ and awarded each a score of 4 to 0, respectively.
The structural scoring method is based on the scoring protocol devised by Novak and Gowin (1984). This method focuses on four components: propositions, hierarchy levels, cross-links and examples. A group of researchers used Novak and Gowin, (1984)'s structural scoring system (Markham et al., 1994; Martin et al., 2000) with some changes. In Martin et al.'s system, there are six criteria including concepts, relationships, branching, hierarchy, cross-links, and interconnectedness. Markham et al. (1994), on the other hand, added two criteria, concepts and branching, to Novak and Gowin's model. Subsequent quantitative analyses were based on minor modifications of the scoring component such as the number of valid links and cross-links, the number of branching, hierarchy and so on (Kinchin et al., 2000; Kaya, 2008; Nakiboğlu and Ertem, 2010). The scoring components of the students' concept map have sometimes been done in comparison with an expert or a criterion map (Ruiz-Primo and Shavelson, 1996). In our study, we used Novak and Gowin, (1984), Martin et al., (2000) and Markham et al. (1994)'s scoring methods with minor modifications to determine the students' conceptual understanding and meaningful learning.
Qualitative analysis of the concept maps generally relies on a structural framework. For example, Kinchin et al. (2000) investigated students' concept maps qualitatively by taking into account the map structure referred to as spoke, chain and net. The spoke of the concept map is a radial structure and in this type of concept map there is a main concept and the other concepts are directly linked to this core concept without cross-links or linking with each other. The chain concept map has a linear structure in which each concept links to the above and the below concept. The net concept map has an integrated and hierarchical network that shows a deep understanding on the topic being investigated. The researchers also used a comparison table for analysis. They indicated that while the spoke and chain concept map structure shows a small or narrow world view that describes the conceptual development of individuals, the net concept map structure shows a larger world view and meaningful learning. Lopez et al. (2014) used a similar concept map structure to examine ethnically diverse students' holistic map scores to determine whether they show qualitatively distinct structures overall. Vanides et al. (2005) investigated how researchers can know if students develop a comprehensive scientific understanding of important concepts and if it is possible to produce a snapshot of this understanding. Their study recommended several factors to evaluate concept maps, including the complexity of the map, the existence of the most important propositions, and the quality of the propositions. The researchers determined five different concept map structures including linear, circular, hub or spoke, tree and network to examine the complexity of the concept maps. They argued that one can understand if students are highly proficient or not by observing their concept map structures. The study indicated that while novice or low level students prefer to construct linear, circular, spoke or tree concept map structures, high proficiency students constructed a highly interconnected map as net. Özgün-Koca and Şen (2004) developed a process for qualitative analysis of a concept map. They stated that the analysis provided them deep and valuable information about the cognitive structure of the participants, and quality of the relationships of the links and labels that participants stated in their maps.
In our study, we examined students' knowledge structure taking into account the map structure they constructed. Therefore, we informed students about three map structures including hierarchical, non-hierarchical (net) and chain concept maps. We also evaluated students' conceptual understanding by considering representational levels, which has not been apparent in the literature before.
Methods
The sample
The participants of the study comprised of 12 Turkish high school students (10 female and 2 male). Their age ranged from 16 to 17 years coming from middle-class socio-economic status families. The students were in the 11th grade in the science branch of high school. A purposeful random sampling was employed, since it was not possible to include all students in the class for a detailed investigation. The sample represented low, medium and high levels of achievement groups in the class based on their chemistry scores earned during the previous semester.Research design
A pre and post test design was used in this study. Concept maps were used as data collection tools before and after the 15 CB-POE tasks that were used for the acid–base topic as a part of the regular secondary chemistry curriculum. The students had constructed their pre concept maps two weeks before the CB-POE tasks were implemented. Before students constructed their pre concept maps, they had been introduced to concept maps using three regular classroom hours, 45 min each. The students constructed their post concept maps two weeks after they completed the tasks; it took one regular classroom hour. The 15 CB-POE tasks were implemented to students during regular classroom hours that took place over a 5 week period. The classroom instruction included two 45 min periods per week. Construct-a-map type concept maps, in which students construct a concept map using concepts and links without a limitation, were used to assess students' conceptual understanding. We used this type of concept map technique because it is more sensitive to gathering students' understanding and knowledge structure.Brief description of instructional intervention (CB-POE)
15 CB-POE tasks were developed for the study. The materials included five digital video clips, seven simulations, and three animations that were embedded in the POE strategy. We chose acid–base chemistry as the domain of the study. Topics included definitions of acids and bases; acidic, basic, amphoteric and neutral properties of oxides; general properties of acids and bases including the effects of acids and bases to metals, neutralization, indicators, conductivity, the effect of acids to carbonated compounds; ionization of water, concept of pH and pOH; strength; titration, hydrolysis; and buffer solutions. Whilst creating the 15 CB-POE tasks, we took into consideration students' misconceptions, examples of acids and bases from everyday life, and the sub-topics that students have difficulties in understanding. Furthermore, we took into account the macroscopic (MAL), microscopic (MIL) and symbolic levels (SYL) of representations of the phenomenon of interest. For instance, we used digital video clips to remedy the students' misconception such as “acids melt metals” (Nakhleh and Krajcik, 1994), “acids burn and melt everything” (Demircioğlu et al., 2005) or “strong acids can react with all metals to form H2 gas” (Özmen et al., 2009). We also used simulations to remedy misconceptions such as “the concentration and the strength of an acid are the same” (Ross and Munby, 1991; Demircioğlu et al., 2005) because we determined that addressing this misconception requires representation at the microscopic level. Generally, in the CB-POE tasks, macroscopic events were provided with digital video clips, while the microscopic events were provided with simulations.Data collection
Concept maps were used as a means of collecting the data before and after the implementation of 15 CB-POE tasks. The students were introduced to the concept maps in three steps. In the first step, they were given explanatory information about concept mapping. This step included explanations of the components of the concept maps such as concepts, central concept, hierarchy, cross-link, example, linking words, phrases and lines. After that, a concept map regarding the most known topic was constructed with students. In the second step, students were introduced to different types of concept map structure involving hierarchic, non-hierarchic (network), and chain. Next, students were requested to construct a concept map about any topic they wanted. After constructing the concept maps, students' concept maps were collected for investigation. In the final step, students' concepts maps were distributed to them for feedback. Therefore, students were able to see their mistakes and deficiencies. After completing the introduction of concept maps to students, they were asked to construct a concept map related to acid–base chemistry. All these processes were completed in two weeks before the implementation of the CB-POE tasks and it took three regular classroom hours. While constructing the concept maps, students used their own concept list. No additional concepts were given to the students since the aim was to reveal students' own concepts related to acid–base chemistry. After two weeks, the students completed all of the CB-POE tasks and they were asked to construct a new concept map as a post implementation activity using their own concepts. Construction of post concept maps took one regular classroom hour.Data analysis procedure
In this study, concept maps have been used to assess high school students' conceptual understanding of acid–base chemistry before and after the implementation of 15 CB-POE tasks. The next section explains how differences in mean scores of all criteria analysis were used as a part of the structural scoring method for the pre and post concept maps and were statistically analyzed using the Wilcoxon Signed Rank test.Assessing high school students' concept maps
Students' pre and post concept maps were assessed in three stages including quantitative, qualitative and representational level analysis. In the first stage, students' maps were analyzed quantitatively. We refer to this as “criteria analysis.” The six criteria, including “concepts, propositions, hierarchies, cross-links, examples and degree of interconnectedness,” were used for analyzing students' maps. The criteria of “concepts”, “hierarchy” and “examples” in the maps were awarded as indicated in the literature (Novak and Gowin, 1984; Markham et al., 1994; Martin et al., 2000). The propositions established between two concepts were analyzed into five categories including sound understanding, partial understanding, misconception, wrong understanding, and blank (Abraham et al., 1994). Mcclure and Bell's (1990) categories of propositions, the relationship between concepts, the accuracy of the label and the direction of the arrow were taken into consideration, but their scoring system was not used in this study. Some minor modifications were made related to the criteria of cross-link and interconnectedness beyond the studies reported in the literature (Novak and Gowin, 1984; Martin et al., 2000). Furthermore, when analyzing students' pre and post concept maps, colors were used to indicate each criterion. As seen in Fig. 1 and 2, green indicated the concepts, red indicated the propositions, orange indicated the cross-links, and pink indicated the examples. Valid concepts, proposition, and example were shown with the symbol √, while invalid concepts, proposition (wrong understanding), and example were shown with the symbol X. The partial understanding proposition was shown with the symbol ; misconceptions were shown with the symbol XX and blank was indicated with the symbol –. The scoring system for the criteria analysis and the color coding for each criteria are shown in Table 1. The Table also describes the first stage of analyzing the maps.
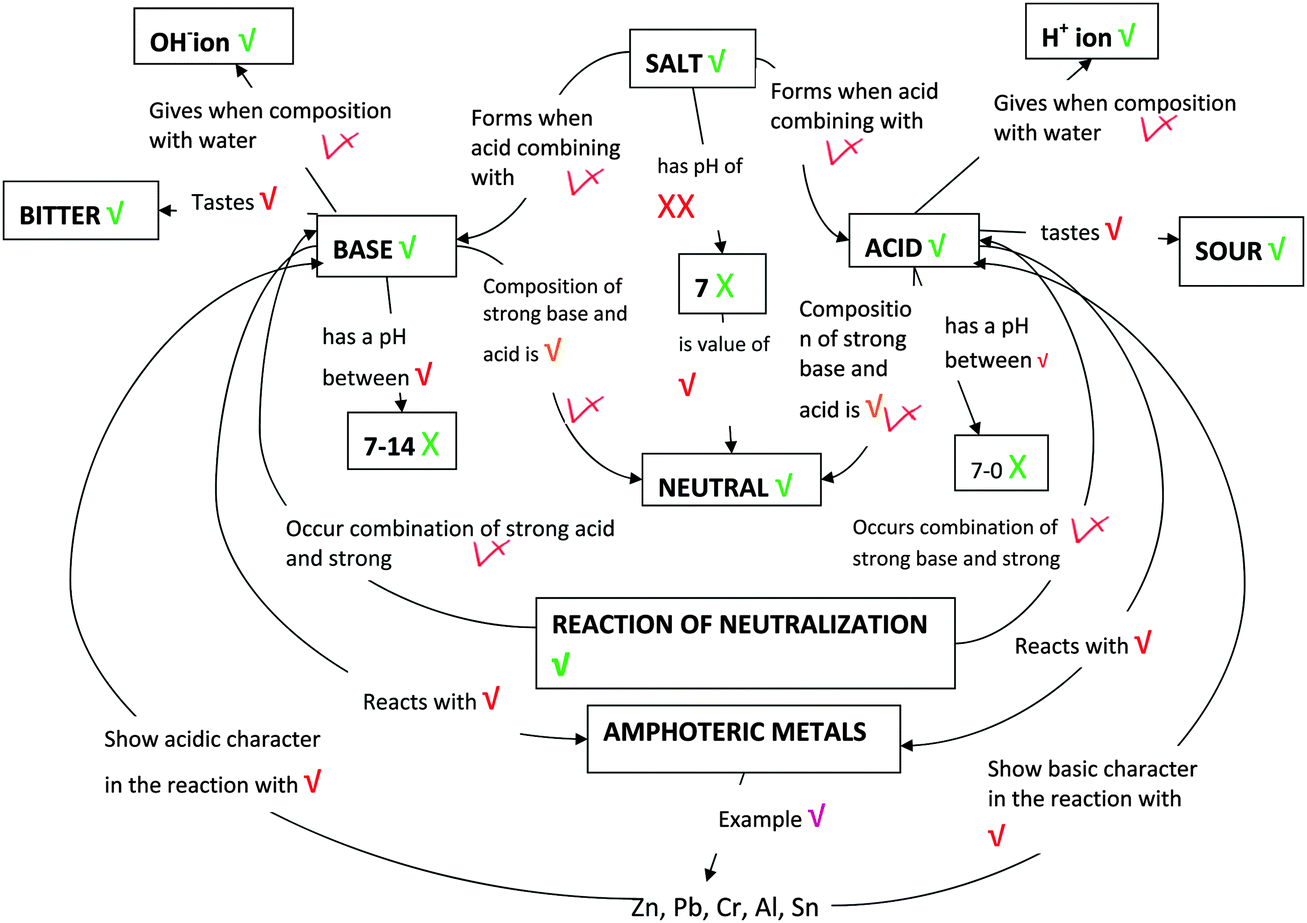 | ||
| Fig. 1 One of the students' (T11 coded) pre concept map for the CB-POE tasks for acid–base chemistry. | ||
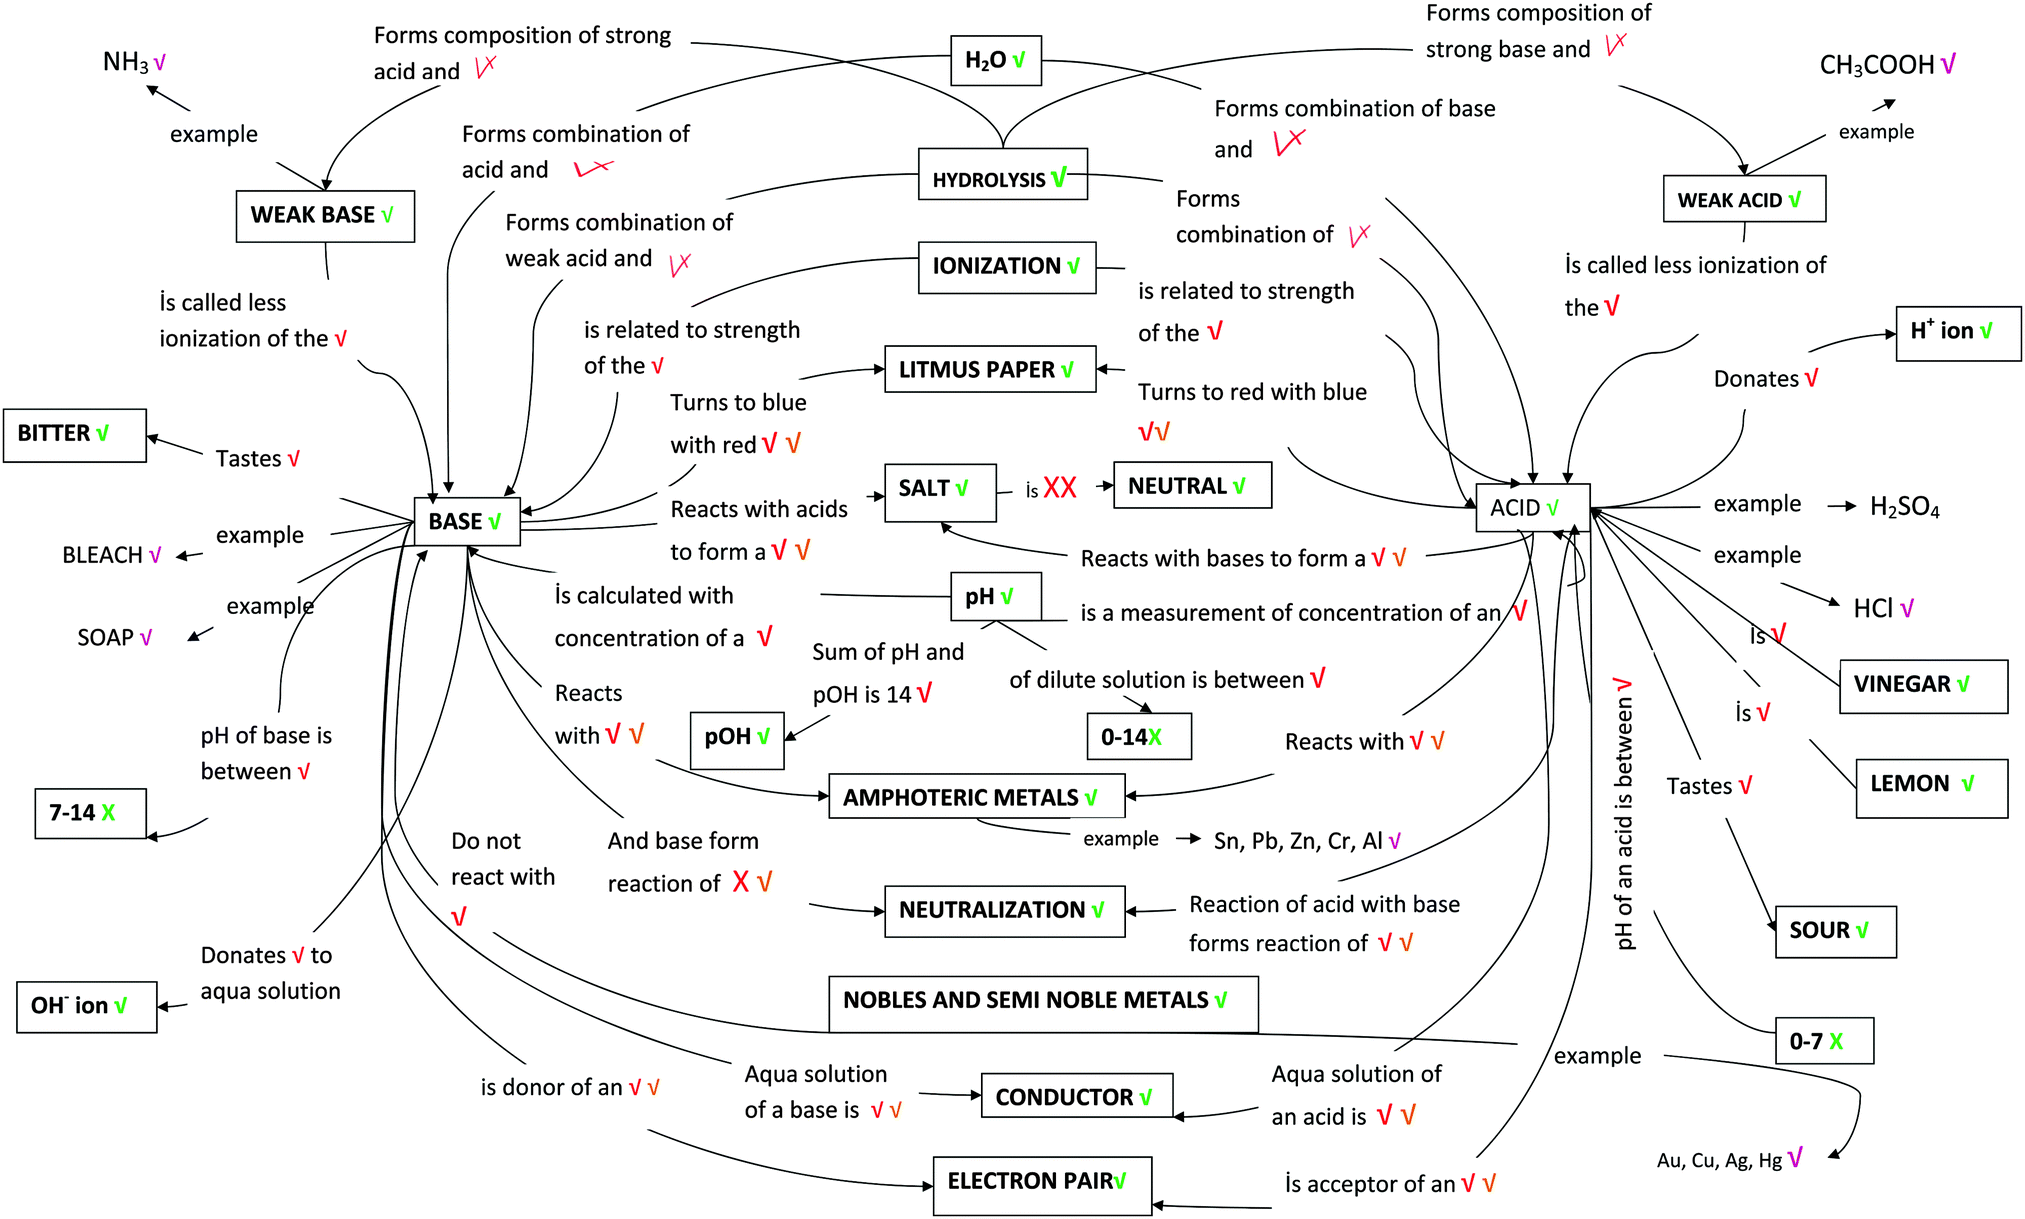 | ||
| Fig. 2 The same student's (T11 coded) post concept map for the CB-POE tasks for acid–base chemistry. | ||
| Criteria | Sub-criteria | Decision of the criteria | Points |
|---|---|---|---|
| The number of concept | Valid concept | If the concept is related to acid–base chemistry, the concept is counted as valid. It is awarded 1 point and indicated as  |
1 |
| Invalid concept | If the concept is not related to acid–base chemistry or it is not a concept, then it is counted as invalid and indicated as  |
0 | |
| The number of proposition | Valid (sound understanding) proposition | If the relationship between two concepts exists, the direction of the arrow indicates a causal relationship and the proposition established between the two concepts is scientifically true. Consequently, the proposition is counted as a valid proposition. It is awarded 4 points and indicated as  |
4 |
| Partial valid (partial understanding) proposition | If the relationship between two concepts exists, the direction of the arrow indicates a causal relationship and the proposition established between two concepts is scientifically true, but only includes some part of the truth, then the proposition is counted as a partially valid proposition. It is awarded 3 points and indicated as  |
3 | |
| Misconception | If the relationship between two concepts exists, the direction of the arrow indicates a causal relationship and the proposition established between two concepts includes propositions which are quite resistant to change and continue to exist despite the instruction and they are different than the scientifically accepted one, then the proposition is considered as a misconception. It is awarded 2 points and indicated as  |
2 | |
| Invalid (wrong understanding) proposition | If the relationship between two concepts exists, the direction of the arrow indicates a causal relationship and the proposition established between two concepts is not scientifically true, or is incorrect/irrelevant/unrelated or is not a logical connection, then the proposition is considered an invalid proposition. It is awarded 1 point and indicated as  |
1 | |
| Blank | If the relationship between two concepts exists, the direction of the arrow indicates a causal relationship, but there is no explanation on the link. Then it is considered as blank, and awarded 0 points and indicated as  |
0 | |
| The number of cross-links | Valid cross-link with valid proposition | If the cross-link and the proposition on this cross-link is valid, it is awarded 10 points and indicated as   |
10 |
| Valid cross-link with partial valid proposition | If the cross-link established between two concepts is valid, but the proposition on the arrow is partially correct, then this is awarded 5 points and indicated as   |
5 | |
| Valid cross-link with misconception proposition | If the cross-link is valid, but the proposition includes misconceptions, then this cross-link is awarded 2 points and indicated as   |
2 | |
| Valid cross-link with invalid proposition | If the cross-link is valid, but the proposition is invalid, then this cross-link is awarded 1 point and indicated as   |
1 | |
| Valid cross-link with blank | If the cross-link established between two concepts is valid, but there is no proposition on the link, then this cross-link is awarded 1 point and indicated as   |
1 | |
| Invalid cross-link | If the cross-link is invalid, the link is awarded 0 points and indicated as  |
0 | |
| The number of hierarchy | Valid hierarchy | If the concepts are constructed from most general to most specific in a hierarchy, then this concept map is awarded 5 points for including the hierarchy. | 5 |
| Invalid hierarchy | If there is a hierarchy in the concept map, but the concept is not constructed from most general to most specific, then this hierarchy is considered an invalid hierarchy. | 0 | |
| The number of example | Valid example | If the example given to the concepts is true. It is indicated as  |
1 |
| Invalid example | If the example given to the concepts is not true. It is indicated as  |
0 | |
| The value of interconnectedness | Valid cross-link with valid proposition | Calculate using formula “[(valid cross-link × 10)/(valid concept × 1)] × 100” | |
| Valid cross-link with partial valid proposition | Calculate using formula “[(valid cross-link × 5)/(valid concept × 1)] × 100” | ||
| Valid cross-link with misconception proposition | Calculate using formula “[(valid cross-link × 2)/(valid concept × 1)] × 100” | ||
| Valid cross-link with invalid proposition; or valid cross-link with blank | Calculate using formula “[(valid cross-link × 1)/(valid concept × 1)] × 100” | ||
According to these criteria analysis, we can calculate a student's concept map score as follows:
Total score: [(valid concept × 1 point)] + [(valid proposition × 4 point) + (partial proposition × 3 points) + (misconception × 2 points) + (invalid proposition × 1 point)] + [(valid cross-link with valid proposition × 10 points) + (valid-cross-link with partial proposition × 5 point) + (valid-cross-link with invalid proposition × 1 point) + (valid-cross-link with blank × 1 point)] + [(valid hierarchy × 5 point)] + [(the number of valid example × 1 point)].
Fig. 1 and 2 illustrate two examples of analysis for one students' concept map using these scoring protocol and symbols. While Fig. 1 shows the student's (student T11, in analysis students were coded as “T”) pre concept map, Fig. 2 shows the same student's post concept map. The student's criteria analysis is shown in Table 2, in detail.
| Criteria and sub-criteria | Fig. 1 | Fig. 2 | Example for Fig. 1 | Example for Fig. 2 | |
|---|---|---|---|---|---|
| Number of concepts | V (shown as  ) ) |
10 | 23 | ||
INV (shown as  ) ) |
3 | 3 | 7–0, 7, and 7–14 were not considered valid concepts since these were not concepts, but numbers. | 7–0, 7, and 7–14 | |
| Number of propositions | SU (shown as  ) ) |
9 | 28 | Acid tastes sour; base reacts with amphoteric metals. “acid” and “sour” are two valid concepts and “tastes” is an appropriate linking word. Besides, the direction of the arrow is appropriate, which is towards acid to sour. We stated this proposition as “acid tastes sour”. It is a valid proposition; therefore, it is awarded 4 points. | Weak base is called less ionization of the base, acid turns to red with blue litmus paper |
PU (shown as  ) ) |
8 | 6 | Reaction of neutralization occurs by combination of an acid and base; salt forms when acid combines with base | H2O forms a combination of acid and base | |
MS (shown as  ), ), |
1 | 1 | Salts has pH of 7 | Salt is neutral | |
WU (shown as  ) ) |
— | 1 | — | Base and base form reaction of neutralization | |
| Number of cross-link | V&SU shown as   |
— | 6 | — | Base reacts with acids to form a salt” and “acid reacts with bases to form a salt” are two cross-links with valid propositions. Since the same idea was explained, they were counted as one cross-link with valid proposition. The student did 11 valid cross-links with valid propositions which 10 of 11 propositions explained the same idea. Therefore, it counted as 6 valid cross-links (half of the ten valid crosslink with valid propositions and the other separate valid crosslink with valid proposition). |
V&PU Shown as   |
1 | — | Composition of strong base and acid is neutral. The student did two valid cross-links with partial valid proposition (as shown   ) in her pre concept map; however, they were counted as one cross-link since the same idea was explained (Nakhleh and Krajcik, 1994) ) in her pre concept map; however, they were counted as one cross-link since the same idea was explained (Nakhleh and Krajcik, 1994) |
||
V&WU shown as   |
— | 1 | — | ||
| V&B | — | — | |||
| Number of example | V (shown as  ) ) |
1 | 8 | Zn | NH3, bleach, soap, CH3COOH |
| INV | — | — | — | — | |
| Total | (10 × 1) + (9 × 4) + (8 × 3) + (1 × 2) + (1 × 5) + (1 × 1) = 78. | (23 × 1) + (28 × 4) + (6 × 3) + (1 × 2) + (1 × 1) + (6× 10) + (1 × 1) + (8 × 1) = 225 points | |||
Following is a discussion of criteria of interconnectedness, which expresses the ratio of the “cross-link” to “concept scores” or “cross-link/concepts × 100” in percentage, and shows the differences between rote and meaningful learning (Martin et al., 2000; Kaya, 2008). To be able to calculate the student's interconnectedness value, we needed to know the number of cross-links established and the number of the valid concepts. As stated above, the number of the valid-cross links with partial understanding is one and the student has 10 valid concepts. Therefore, the student's total score for interconnectedness was calculated to be [(1 × 5)/(10 × 1)] × 100 = 50.0.
In Fig. 2, the student constructed 11 cross-links. This student has six valid cross-links with valid propositions and one valid cross-link with an invalid proposition. Therefore, the same student's total interconnectedness value was calculated as follows:
Total value of interconnectedness = [(valid cross-link with valid proposition × 10)/(valid concept × 1)] × 100 + [(valid cross-link with invalid proposition × 2)/(valid concept × 1)] × 100
Total score of interconnectedness = (6 × 10/23) × 100 + (1 × 1/23) × 100 = 265.217
In the second stage, the students' propositions stated in the concept maps were analyzed taking into account the macroscopic, microscopic, and symbolic levels. If a student's proposition includes everyday life, laboratory studies, or concrete, visible or observable events, this student's proposition is classified as the macroscopic level (MAL) (Johnstone, 1991; 1993; 2000; Nakhleh and Krajcik, 1994). For instance,

If a student's proposition involves atoms, molecules and ions, then this proposition is classified as the microscopic level (MIL) (Johnstone, 1991; 1993; 2000; Nakhleh and Krajcik, 1994). For instance,
A student's proposition is classified as a symbolic level (SYL), if the map includes chemical reactions symbolized by equations, diagrams, and molecular structure drawings (Johnstone, 1991; 1993; 2000; Nakhleh and Krajcik, 1994). For instance, NH3 is an example of weak base.
When the pre-concept map shown in Fig. 1 is further investigated, it can be seen that the student stated 18 propositions, two of which were in MIL, two of which were in SYL, and the rest in MAL. The propositions, “Acid gives H+ ions when composition with water” and “Base gives OH− ions when composition with water” are examples of MIL. The proposition “Zn, Pb, Cr, Al, Sn show basic character when react with acids” is an example of SYL. Based on our criteria we categorized this proposition as SYL. However, in the literature, it is indicated that the symbolic level mediates between the macroscopic and microscopic levels in teaching and learning chemistry. Besides, it is argued that the use of chemical symbols can be ambiguous and misinterpreted since the same representations can stand for either the macroscopic or microscopic levels (Taber, 2009). The propositions “Acid tastes sour” and “Acids reacts with amphoteric metals” were examples of MAL. In the post concept map, the student stated 37 propositions; four of them were MIL (e.g., Acid donates H+ ions; Base is donor of an electron pair), eight were SYL (e.g., NH3 is an example of weak base, NaOH is an example of base; CH3COOH is an example of weak acid; Au, Cu, Ag are example of noble and semi-noble metals), and the rest were in MAL (e.g., base turns to blue with red litmus paper; acid reacts with base to form a salt; acid has a pH < 7; ionization is related to the strength of a base; total of pH and pOH is 14).
The last stage of concept map evaluation includes qualitative analysis. Students' maps were classified as hierarchic, non-hierarchic or chain. This classification enabled us to see what structural knowledge students had about acid–base chemistry. We argued that if students construct highly interconnected maps, such as network or hierarchical with a considerable number of links and cross-links, these students are experts and highly proficient students. On the other hand, if students construct a chain concept map that has a simple structure, we say that these students are novice. Table 3 provides some information related to the structures, the types, and the explanations of concept maps.
| The structure of concept map | Explanation | The type of concept map |
|---|---|---|
| Hierarchic | Hierarchic concept map shows the relationship of a set of concepts under a comprehensive concept. In this type of map, concepts are arranged starting from most comprehensive to less comprehensive. Students may or may not construct cross-links among the concepts. (Novak and Gowin, 1984). |
|
| Non-hierarchic (network) | It enables the students to build their concept maps as networks. The most general concept is in the middle of the map. The other concepts are connected to the most general concept directly or indirectly. Students may or may not construct cross-links among the concepts (Ruiz-Primo and Shavelson, 1996; Kinchin et al., 2000; Kaya, 2003). |

|
| Chain | Chain concept maps have a linear structure where each concept is linked only to another concept that is above or below. In other words, the concepts follow each other from the top to the bottom with propositions. If several concepts are linked to each other immediately in a linear structure and there is no cross-link among these concepts, this type of concept map is considered a chain concept map (Kinchin et al., 2000; Kaya, 2003). |
|
The criteria used to analyze students' pre and post concept maps were determined by a panel of five experts from the field of chemistry education, including the researchers of this study. The researchers of this article determined the analysis of the representational levels, concept map structures, and the scoring system. One of the researchers of this article along with three other researchers who have experience with concept map analysis and chemistry education analyzed the four concept maps. A document explaining the scoring system, structure and multi representational level analysis was given to these three other researchers before the meeting. The explanation included a section for scoring the propositions, structure, and representational analysis. After each researcher scored the concept maps, any disagreements were resolved by discussions.
Brief details of the ethical safeguards
To be able to perform this study, the authors of this study received legal permission from National Education Directorate of province of Trabzon, which is directly connected to the ministry of National Education of Turkey (MEB). The students' participation was voluntary, their consent was received after they were informed about what they would be asked to do when and under what circumstances. They were made aware that their names would never be announced when the research data are published. The students were asked to construct a concept map exercise to enhance their self-confidence to undertake such tasks (Taber, 2014).Findings
Findings related to the first research question
The findings related to students' pre and post concept maps are given in Table 4, which relate to the first research question. As shown in Table 4, the numbers of valid concepts in the post concept maps were generally higher than those in students' pre concept maps. Only two students (T5 and T11) wrote invalid concepts in both their pre and post concept maps. The table also shares that except for one student, all students increased their number of propositions, indicating a sound understanding category in their post concept maps when compared to the same criterion for the pre concept maps. Furthermore, there was a decrease in the number of propositions under the wrong understanding category in their post concept maps. Regarding misconceptions, some students did not write any in either their pre or post concept maps. On the other hand, T2, T8, and T9 did have misconceptions in their pre concept maps and had none in their post concept maps. T6 and T7 had less misconception in their post concept maps. The table also shows that most students increased the number of cross-links in their post concept maps when compared to pre concept maps. However, two students (T3 and T12) did not draw any cross-links in either their pre and post concept maps. Moreover, except for one student (T5), none of the students constructed hierarchical concept maps. Table 4 also shows that although there is an increase in terms of the number of example given in the post concept maps, the minority of the students used examples in their concept maps. When we investigated the number of interconnectedness in the students' concept maps, we saw that only two students (T3 and T12) did not have any interconnectedness score because they did not construct any cross-links in their pre and post concept maps.| S | C | |||||||||||||||||||||||||||||||||||
|---|---|---|---|---|---|---|---|---|---|---|---|---|---|---|---|---|---|---|---|---|---|---|---|---|---|---|---|---|---|---|---|---|---|---|---|---|
| Number of concepts | Number of propositions | Number of cross-links | Number of hierarchy | Number of examples | The value of interconnectedness | Total score | ||||||||||||||||||||||||||||||
| Pre | Post | Pre | Post | Pre | Post | Pre | Post | Pre | Post | Pre | Post | Pre | Post | |||||||||||||||||||||||
| V | INV | V | INV | SU | PU | MS | WU | B | SU | PU | MS | WU | B | V&SU | V&PU | V&MS | V&WU | V&B | V&SU | V&PU | V&MS | V&WU | V&B | V | INV | V | INV | V | INV | V | INV | |||||
| S: students; C: criteria; V: valid; INV: invalid; SU: sound understanding; PU: partial understanding; MS: misconception; WU: wrong understanding; B: blank; V&SU: valid cross-link with sound understanding proposition; V&PU: valid cross-link with partial understanding proposition; V&MS: valid cross-link with misconception proposition; V&WU: valid cross-link with wrong understanding proposition; V&B: valid cross-link with blank. | ||||||||||||||||||||||||||||||||||||
| T1 | 6 | 0 | 13 | 0 | 8 | 0 | 0 | 0 | 0 | 16 | 0 | 0 | 0 | 0 | 0 | 0 | 0 | 0 | 0 | 1 | 0 | 0 | 0 | 0 | 0 | 0 | 0 | 0 | 0 | 0 | 0 | 0 | 0 | 76.92 | 38 | 87 |
| T2 | 10 | 0 | 15 | 0 | 8 | 0 | 1 | 1 | 0 | 14 | 0 | 0 | 1 | 0 | 0 | 0 | 0 | 0 | 0 | 1 | 0 | 0 | 0 | 0 | 0 | 0 | 0 | 0 | 0 | 0 | 0 | 0 | 0 | 66.7 | 45 | 82 |
| T3 | 8 | 0 | 10 | 0 | 4 | 6 | 0 | 0 | 0 | 6 | 8 | 0 | 0 | 0 | 0 | 0 | 0 | 0 | 0 | 0 | 0 | 0 | 0 | 0 | 0 | 0 | 0 | 0 | 0 | 0 | 0 | 0 | 0 | 0 | 42 | 58 |
| T4 | 9 | 1 | 11 | 0 | 6 | 6 | 0 | 1 | 0 | 10 | 4 | 2 | 0 | 0 | 1 | 0 | 0 | 0 | 0 | 2 | 0 | 0 | 0 | 0 | 0 | 0 | 0 | 0 | 0 | 0 | 0 | 0 | 111 | 181.8 | 62 | 87 |
| T5 | 5 | 1 | 11 | 1 | 7 | 0 | 0 | 0 | 0 | 11 | 2 | 0 | 1 | 0 | 2 | 0 | 0 | 0 | 0 | 5 | 0 | 0 | 0 | 0 | 1 | 0 | 1 | 0 | 0 | 0 | 0 | 0 | 400 | 454.5 | 58 | 117 |
| T6 | 16 | 0 | 18 | 0 | 13 | 0 | 2 | 2 | 2 | 20 | 0 | 1 | 0 | 0 | 2 | 0 | 0 | 1 | 0 | 5 | 0 | 0 | 0 | 0 | 0 | 0 | 0 | 0 | 2 | 0 | 2 | 0 | 137.5 | 277.8 | 98 | 152 |
| T7 | 21 | 0 | 17 | 0 | 10 | 5 | 2 | 1 | 3 | 12 | 3 | 1 | 0 | 1 | 2 | 1 | 0 | 0 | 0 | 4 | 0 | 0 | 0 | 0 | 0 | 0 | 0 | 0 | 0 | 0 | 2 | 0 | 119 | 235.3 | 106 | 118 |
| T8 | 10 | 0 | 12 | 0 | 7 | 1 | 2 | 0 | 0 | 13 | 1 | 0 | 0 | 0 | 1 | 0 | 0 | 0 | 0 | 2 | 0 | 0 | 0 | 0 | 0 | 0 | 0 | 0 | 0 | 0 | 0 | 0 | 100 | 166.7 | 55 | 87 |
| T9 | 12 | 0 | 14 | 0 | 12 | 2 | 1 | 4 | 0 | 18 | 2 | 0 | 0 | 0 | 1 | 0 | 0 | 0 | 0 | 7 | 0 | 0 | 0 | 0 | 0 | 0 | 0 | 0 | 0 | 0 | 0 | 0 | 83 | 500 | 82 | 162 |
| T10 | 7 | 0 | 20 | 0 | 8 | 0 | 0 | 0 | 0 | 19 | 0 | 1 | 0 | 0 | 0 | 0 | 0 | 0 | 0 | 2 | 0 | 0 | 0 | 0 | 0 | 0 | 0 | 0 | 0 | 0 | 0 | 0 | 0 | 100 | 39 | 118 |
| T11 | 10 | 3 | 23 | 3 | 9 | 8 | 1 | 0 | 0 | 28 | 6 | 1 | 0 | 1 | 1 | 0 | 0 | 0 | 0 | 6 | 0 | 0 | 1 | 0 | 0 | 0 | 0 | 0 | 1 | 0 | 8 | 0 | 50 | 265.2 | 78 | 225 |
| T12 | 8 | 0 | 10 | 0 | 6 | 0 | 0 | 0 | 2 | 5 | 2 | 0 | 3 | 0 | 0 | 0 | 0 | 0 | 0 | 0 | 0 | 0 | 0 | 0 | 0 | 0 | 0 | 0 | 0 | 0 | 0 | 0 | 0 | 0 | 32 | 39 |
When teachers analyze the propositions in students' concept map, they can reveal students' level of understanding. For example, if a student draws a link between two unrelated concepts, this may expose the student's alternative or misconception. If a student misses a link between two closely related concepts, this may reveal that the student has not yet developed a strong understanding between the concepts. Likewise, if a student draws a link between two related concepts properly, this may reveal that the student has a sound understanding and scientific knowledge. In this study, when students' propositions in their post concept maps were investigated, we understood that students' sound understanding category increased while their misconceptions, wrong understandings, and blank proposition categories decreased. This may show that students wrote more scientific and valid propositions in their post concept maps. When students' misconceptions were investigated, we understood that their misconceptions were generally related to acids, pH of salts, pH and pOH.
“pH of salt is 7, acid is caustic, acid made something redness, salt is neutral, acid composes H2 gas when react with metals, salt is 7, acid makes something irritant, pOH shows the degree of alkalinity, pH shows the degree of acidity, salt has a pH of 7” Pre concept map
“pH of salt is 7, Salt is neutral, acid is irritant, acid is caustic” Post concept map
When teachers want to learn how their students' conceptual understandings have improved over time, they can use concept maps on repeated occasions. Therefore, we also used the Wilcoxon Signed Rank test to calculate whether there are any significant differences between students' pre and post concept maps scores. Table 5 shows the results.
The results show that there is a significant difference between students' pre and post concept map scores (z = 3.05, p < 0.05). When we consider the mean rank and the sum of the rank, the differences observed are in favor of the post test scores. This result may indicate that the quality of students' propositions improved during the instruction. Therefore, taking into consideration students' concept maps can help teachers observe students' learning deficiencies and improve the instruction.
Findings related to the second research question
Table 6 shows students' total propositions and their classification in terms of representational levels. Furthermore, their propositions in the pre and post concept maps were categorized into macroscopic, microscopic and symbolic levels.| Students | Total propositions | Macroscopic level (MAL) | Microscopic level (MIL) | Symbolic level (SYL) | ||||
|---|---|---|---|---|---|---|---|---|
| Pre | Post | Pre | Post | Pre | Post | Pre | Post | |
| T1 | 8 | 16 | 8 | 12 | 0 | 1 | 0 | 3 |
| T2 | 10 | 15 | 8 | 11 | 2 | 2 | 0 | 2 |
| T3 | 10 | 14 | 7 | 12 | 0 | 0 | 3 | 2 |
| T4 | 13 | 16 | 9 | 13 | 2 | 0 | 2 | 3 |
| T5 | 7 | 14 | 5 | 7 | 2 | 4 | 0 | 3 |
| T6 | 19 | 21 | 12 | 16 | 2 | 3 | 3 | 2 |
| T7 | 21 | 17 | 19 | 11 | 0 | 4 | 2 | 2 |
| T8 | 10 | 14 | 10 | 12 | 0 | 1 | 0 | 1 |
| T9 | 19 | 20 | 12 | 16 | 0 | 2 | 7 | 2 |
| T10 | 8 | 20 | 6 | 18 | 0 | 0 | 2 | 2 |
| T11 | 18 | 37 | 13 | 25 | 2 | 4 | 3 | 8 |
| T12 | 8 | 10 | 7 | 7 | 1 | 0 | 0 | 3 |
| Av. | 12.58 | 17.8 | 9.6 | 13.3 | 0.92 | 1.75 | 1.83 | 2.75 |
As indicated in Table 6, students generally used more propositions in their post concept maps compared to their pre concept maps. Students' macroscopic, microscopic, and symbolic levels increased, especially in their post concept maps. Despite this increase in the number of all representational levels in post concept maps, the number of MAL is higher than the other representational level both for both pre and post concept maps.
When students' pre and post concept maps were investigated in terms of macroscopic, microscopic and symbolic levels, students preferred to indicate general properties of acid and bases. These properties include taste, changing the color of litmus paper, and pH value. In the pre concept maps, they described salts as a result of reaction between acids or bases at the macroscopic level, they indicated Arrhenius's acid–base definition at the microscopic level, and they gave a chemical formula of the amphoteric metals at the symbolic level. The following shows some students' propositions categorized as MAL, MIL and SYL representations in their pre concept maps, respectively:
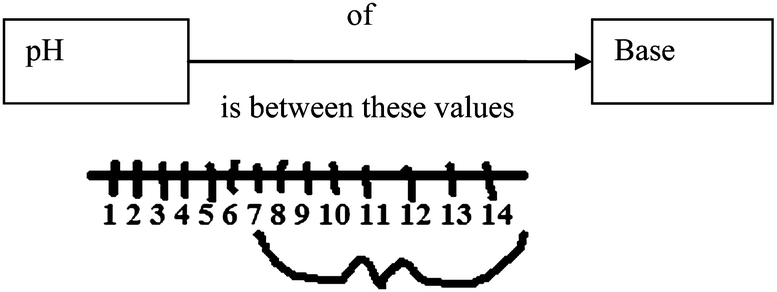
“Acids react with bases; acids turn to red with litmus paper; acid has a pH < 7; base has a pH > 7; acid tastes sour; base tastes bitter; aqua solution of acids conduct electric current” is a (MAL)
“If acid dissolve in water, it gives H+ ion; if base dissolve in water, it gives OH− ion” is a (MIL)
“Zn, Sn, Al, Pb, Cr, Sn are examples of amphoteric acids” is a (SYL)
However, on their post concept maps they preferred to state the following properties:
• buffer, titration, end point, and acid–base reactions on MAL
• reaction between an ion and water for describing hydrolysis concepts, acid–base definitions of Bronsted–Lowry and Lewis as well Arrhenius on MIL
• chemical formulas for acid and bases on SYL in addition to their propositions indicated in their pre concept maps
The following propositions were considered as MAL, MIL, and SYL in their post concept maps, respectively:
“Application of neutralization in a lab is called titration; if you add certain amount of acid or base to the buffer, solution of pH doesn't change; when you drop indicator like red cabbage, the point at which the indicator shift its color is called end point; combination of weak acid and its salts is called buffer; weak base and its conjugate acid form buffer; weak acid and its conjugate base from buffer; the point in a titration at which the indicator changes color is called end point of a indicator” is a (MAL)
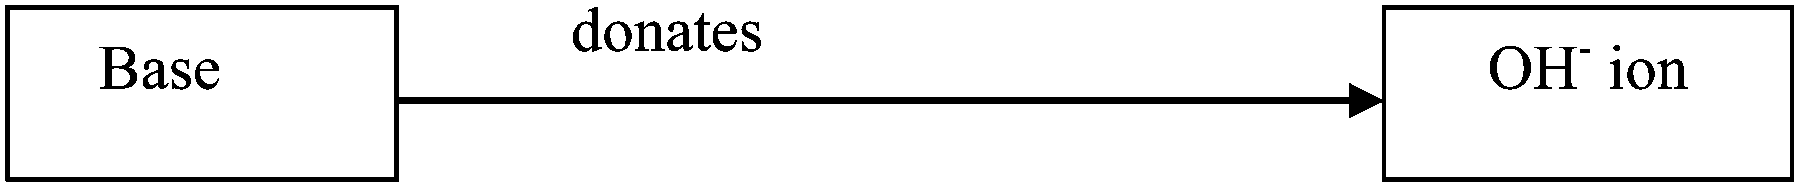
“It is called hydrolysis when salt ionizes in water, one of its ion form H3O+ or OH− ions with water; reaction between an ion and water is referred to hydrolysis; acid is acceptor of an electron pair; acids donate H+ ion to the aqua solutions; acid is a proton donor; base is a proton acceptor” is a (MIL)
“Acid does not react with Cu, Hg, and Ag; HCl is an example of acid; NaOH is an example of base” is a (SYL)
The result of this analysis shows that students who use different levels of representations were able to develop mental pictures of microscopic levels of acids and bases, to transfer one level of representation to another, and to create symbolic representations of observed acid and bases. Therefore, these results may show that students promoted their conceptual understanding of the chemical concepts being studied.
Findings related to the third research question
Data gathered related to the third research question come from the third stage of the analysis of students' pre and post concept maps. This stage includes qualitative analysis. For this part, students' concept maps were analyzed according to hierarchic, non-hierarchic, and chain structures to be able to investigate the complexity of the map and the holistic structure of the concept maps. Determining the complexity of the concept map is very easy and informative. Teachers can evaluate it by observing students' concept maps to see whether they constructed complex networks or simple structures. When students develop progressively sophisticated understanding in a domain, their knowledge is structured and integrated. In this context, since more complex and integrated structures are related to deeper understanding, expert and highly proficient students tend to create highly interconnected and complex maps such as networks and very connected hierarchical concept maps. On the other hand, novice students tend to create simple structures such as chain, linear, spoke concept maps.When students' concept maps were analyzed in terms of the map structure, we determined that except for student T5, all students preferred to construct non-hierarchic (network) concept maps. In other words, 11 students constructed non-hierarchic concept maps and 1 student (T5 coded) constructed hierarchic concept maps. We may conclude that their knowledge structure is not hierarchically constructed. When students' number of valid proposition cross-links and examples were investigated as shown in Table 4, the conclusion is that students constructed highly interconnected and complex maps in their post concept maps. This may show that students improved their understanding, had a larger world view, and experienced more meaningful learning. Only two students could not draw interconnected concept maps since they could not create any cross-links in their pre and post concept maps. This may show that these students did not achieve the expected meaningful learning. Furthermore, none of the students drew chain concept maps. This shows that these students did not have a narrow world view about acid–base chemistry before beginning the CB-POE tasks and after completing it. Therefore, they may not be considered novice students even though they did not construct highly connected concept maps.
Discussion, conclusion and implications
In this study, concept maps have been used as an assessment tool for before and after 15 CB-POE tasks. Qualitative, quantitative and representational procedures were used to investigate students' conceptual understanding. While looking at the findings related to the first research question, students' concept map scores revealed significant differences in favor of students' post concept map scores (z = 3.05, p < 0.05). We speculate this result as students having more sophisticated and interconnected conceptual understanding in post concept maps. We may say that these students have a deeper conceptual understanding. In this study, assessing students' pre and post concept maps offered a valid and reliable approach for describing change in students' conceptual understanding. Research has shown similar results when concept maps were used as assessment methods before and after instruction (Kaya, 2008).The second stage of analyzing concept maps included representational level analyses of the propositions. Representational level analysis revealed that students generally categorized properties of acid and bases, and reactions on MAL, symbols of acids and bases on SYL, and definitions of acid and bases on MIL in their pre and post concept maps. Therefore, the results of this analysis showed that majority of the students increased their macroscopic, microscopic and symbolic levels in their post concept maps. Students generally wrote their propositions in macroscopic levels when compared to the microscopic and symbolic levels. Even though the students increased their microscopic, macroscopic and symbolic levels in their post concept maps, their dominant representational level is still the macroscopic level. This may be because the structure of concept maps makes it challenging to indicate symbolic and microscopic levels. In general, studies have shown that students construct most of their understanding in chemistry using macroscopic representations (Nakhleh and Krajcik, 1994). This might result from students' prior knowledge of chemistry being based on their everyday experiences, which are at the macroscopic level (Treagust and Chandrasegaran, 2009).
The construction of a concept map reveals the perception of the map's creator. Therefore, the map reflects the learner's experiences, belief and biases in addition to representation and the organization of ideas about a topic (Kinchin et al. 2000). When students' concept maps were analyzed qualitatively, only one student preferred to use hierarchic concept maps in pre and post concept maps; the others constructed non-hierarchic (network) concept maps. Since the majority of the students constructed their concept maps as a network, it can be concluded that students are not familiar with constructing hierarchical concept maps. Students might find it difficult to construct a map that goes from general concepts to more specific ones (Bak Kibar et al., 2013). Furthermore, in the literature it is reported that while students construct their concept maps, they prefer to use non-hierarchic structures rather than hierarchic ones (Novak and Gowin, 1984; Ruiz-Primo and Shavelson, 1996; Ebeneezer and Haggerty, 1999; Kaya, 2003; Kaya, 2008; Bak Kibar et al., 2013). Besides, all students except two drew more interconnected and complex concept maps after experiencing the CB-POE tasks. We argue that the majority of the students achieved meaningful learning and they are experts (Kinchin et al., 2000; Vanides et al., 2005). On the other hand, students did not prefer to construct a chain structure in their pre and post concept maps, this result might provide evidence that students' knowledge about acid–base chemistry was not at the introductory level. This is not unexpected since acid, base and salt concepts are usually introduced in the middle school at 8th grade science classes (Demircioğlu, 2003).
As a result, the assessment methods used in this study provided rich data in terms of representational level, the criteria, and the structural context. Concept maps were constructed for acid–base chemistry. Therefore, teachers and researchers can use this kind of rubric in other chemistry topics as well as in other science curricula. In this study, students chose their concepts for their maps. We chose this method because we did not want to limit the students thinking. It might be a good idea to provide students with a list of concepts and then, if students want, they can add more concepts that they think are related. Moreover, another stage can be added to analysis of concept maps. For this stage an expert concept map can be constructed and then it can be searched how many concepts students used and can be used in a given concept map list when compared with the expert concept maps.
In the light of the findings of this study, teachers should be taught how to evaluate concepts to assess student learning. Teachers should consider the time when the students construct their concept maps. Furthermore, students can be taught to use their maps for self-assessments and peer-assessments (Kaya, 2008). Students may also be taught different types of concept maps such as circular, hub or spoke, and tree (Vanides et al., 2005) as well as hierarchical, net and chain concept maps.
References
- Abraham M. R., Williamson V. M. and Westbrook S. L., (1994), A cross-age study of the understanding of five chemistry concepts, J. Res. Sci. Teach., 31, 147–165.
- Ardac D. and Akaygun S., (2004), Effectiveness of multimedia-based instruction that emphasizes molecular representations on students' understanding of chemical change, J. Res. Sci. Teach., 41(4), 317–337.
- Bak Kibar Z., Yaman F. and Ayas A., (2013), Assessing prospective chemistry teachers' understanding of gases through qualitative and quantitative analyses of their concept maps, Chem. Educ. Res. Pract., 14(4), 542–554.
- Ben-Zvi R., Eylon B. and Silberstein J., (1986), Is an Atom of Copper Malleable? J. Chem. Educ., 63(1), 64–66.
- Bodner G. M., (1992), Refocusing the general chemistry curriculum, J. Chem. Educ., 69, 186–190.
- Chandrasegaran A. L., Treagust D. F. and Mocerino, M., (2008), An Evaluation of a Teaching Intervention to Promote Students' Ability to Use Multiple Levels of Representation When Describing and Explaining Chemical Reactions, Res. Sci. Educ., 38, 237–248. DOI: http://10.1007/s11165-007-9046-9.
- Demircioğlu G., (2003), Preparation and implementation of guide materials concerning the unit Acids and Bases at Lycee II level, PhD Thesis, Trabzon, Turkey: Karadeniz Technical University.
- Demircioğlu G, Ayas A. and Demircioğlu H., (2005), Conceptual Change Achieved Through A New Teaching Program on Acids and Bases, Chem. Educ. Res. Pract., 6(1), 36–51.
- Driver R. and Scott P., (1996), Curriculum development as research: a constructivist approach to science curriculum development and teaching, in Treagust D. F., Duit R., and Fraser B. J. (ed.), Improving teaching and learning in Science and mathematics, New York and London: Teachers College Press, pp. 94–108.
- Ebeneezer J. V. and Haggerty S. M., (1999), Becoming a Secondary School Science Teacher, Upper Saddle River, NJ: Merrill.
- Gabel D., (1999), Improving teaching and learning through chemistry education research: a look to the future, J. Chem. Educ., 76(4), 548–554.
- Gilbert J. K. and Treagust D., (2009), Introduction: macro, submicro and symbolic representations and the relationship between them: key models in chemical education, in Gilbert J. K. and Treagust D. (ed.), Multiple representations in chemical education, The Netherlands: Springer, pp. 1–8.
- Heron J., (1981), Assessment revisited, in Boud D. J. (ed.), Developing student autonomy in learning, London: Kogan Page, pp. 55–68.
- Hinton M. E. and Nakhleh M. B., (1999), Students' microscopic, macroscopic, and symbolic representations of chemical reactions, Chem. Educ., 4, 158–167.
- Johnstone A. H., (1991), Why is science difficult to learn? Things are seldom like they seem, J. Comput. Assist. Learn., 7, 75–83.
- Johnstone A. H., (1993), The development of chemistry teaching: a changing response to changing demand, J. Chem. Educ., 70(9), 701–705.
- Johnstone A. H., (2000), Teaching of chemistry: logical or psychological? Chem. Educ.: Res. Pract. Eur., 1(1), 9–15.
- Kala N., Yaman F. and Ayas A., (2013), The Effectiveness Of Predict–Observe–Explain Technique In Probing Students' Understanding about acid–base chemistry: a case for the concepts of pH, pOH and Strenght, Int. J. Sci. Math. Educ., 11(3), 555–574.
- Kaya O. N., (2003), Concept Mapping in Science Education, Pamukkale University Journal of Education, 13, 70–79.
- Kaya O. N., (2008), A Student-centred Approach: Assessing the Changes in Prospective Science Teachers' Conceptual Understanding by Concept Mapping in a General Chemistry Laboratory, Res. Sci. Educ., 38, 91–110.
- Keig P. F. and Rubba P. A., (1993), Translations of the representations of the structure of matter and its relationship to reasoning, gender, spatial reasoning, and specific prior knowledge, J. Res. Sci. Teach., 30(8), 883–903.
- Kinchin I. M., Hay D. B. and Adams A., (2000), How a qualitative approach to concept map analysis can be used to aid learning by illustrating patterns of conceptual development, Educ. Res., 42(1), 43–57.
- Linn R. L. and Gronlund N. E., (2000), Measurement and Assessment in Teaching, Merill: Columbus, Ohio.
- Lopez E. J., Shavelson R. J., Nandagopal K., Szu E. and Penn J., (2014), Ethnically diverse students' knowledge structures in first-semester organic chemistry, J. Res. Sci. Teach., 51(6), 741–758.
- Markham K. M., Mintzes J. I. and Jones M. G., (1994), The concept map as a research and evalution tool: further evidence of validity, J. Res. Sci. Teach., 31(1), 91–101.
- Martin L. B., Mintzes J. J. and Clavijo E. H. (2000). Restructuring knowledge in biology: cognitive processes and metacognitive reflections. International Journal of Science Education, 22(3), 303–323.
- Mcclure J. R. and Bell P. E., (1990), Effects Of An Environmental Education Related STS Approach nstruction On Cognitive Structures of Pre Service Science Teachers, University Park, PA: Pennsylvania State University, (ERIC Document Reproduction Services No. ED 341 582).
- Mcclure J. R., Sonak B. and Suen H. K., (1999), Concept map assessment of classroom learning: reliability, validity and logistical practicality. J. Res. Sci. Teach., 36(4), 475–192.
- Nakhleh M. B. and Krajcik J. S., (1994), Influence of levels of information as presented by different technologies on students' understanding of acid, base, and pH concepts, J. Res. Sci. Teach., 31(10), 1077–1096.
- Nakiboğlu C. and Ertem H., (2010), Comparison of the structural, relational and proposition accuracy scoring results of concept maps about atom, J. Turk. Sci. Educ., 7(3), 78–85.
- Novak J. D. and Gowin D. B., (1984), Learning how to learn, New York, NY: Cambridge University Press.
- Nurrenbern S. C. and Pickering M., (1987), Concept Learning versus Problem Solving: is there a difference? J. Chem. Educ., 64(6), 508–510.
- Özgün-Koca S. A. and Şen A. G., (2004), The development of a qualitative analyzing method for concept maps, Hacettepe University Journal of Education, 37, 265–173.
- Özmen H., Demircioğlu G. and Coll R. K., (2009), A comparative study of the effects of a concept mapping enhanced laboratory experience on Turkish high school students' understanding of acid- base chemistry, Int. J. Sci. Math. Educ., 7, 1–24.
- Ross B. and Munby H., (1991), Concept Mapping and Misconceptions: A Study of High-School Students' Understandings of Acids and Bases, Int. J. Sci. Educ., 13(1), 11–23.
- Ruiz-Primo M. A. and Shavelson R. J., (1996), Problems and issues in the use of concept maps in science assessment, J. Res. Sci. Teach., 33(6), 569–600.
- Şen A. I. and Aykutlu I., (2008), Using concept maps as an alternative evaluation tool for students' conceptions of electric current, Egit Arast., 31, 75–92.
- Şen A. and Özgün-Koca S. A. (2003), Using and comparing qualitative and quantitative methods in concept map analysis, Çukurova University Journal of Education, 2, 1–9.
- Smith K. J. and Metz P. A., (1996), Evaluating student understanding of solution chemistry through microscopic representations, J. Chem. Educ., 73, 233–235.
- Taber K. S., (2009), Learning at the symbolic level, in Gilbert J. K. and Treagust D. (ed.), Multiple representations in chemical education, The Netherlands: Springer, pp. 75–105.
- Taber K. S., (2014), Ethical considerations of chemistry education research involving “human subjects”, Chem. Educ. Res. Pract., 15, 109–113.
- Treagust D. F. and Chandrasegaran A., (2009), The Efficacy of an Alternative Instructional Programme Designed to Enhance Secondary Students' Competence in the Triplet Relationship, in Gilbert J. and Treagust D. (ed.), Multiple Representations in Chemical Education, The Netherlands: Springer, pp. 151–168.
- Vanides J., Yin Y., Tomita M. and Ruiz-Primo M. A., (2005), Using concept map in the science classroom, National Science Teachers Association (NSTA) (Reprinted With Permission From Science Scope, 28(8), 27–30).
| This journal is © The Royal Society of Chemistry 2015 |