F. A. Redeker,
H. Beckers and
S. Riedel*
Institut für Chemie und Biochemie – Anorganische Chemie, Freie Universität Berlin, Fabeckstrasse 34-36, 14195 Berlin, Germany. E-mail: s.riedel@fu-berlin.de
First published on 1st December 2015
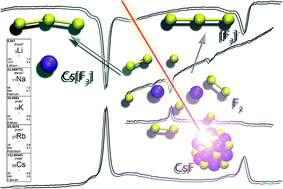
IR laser ablation was used for the systematic matrix-isolation investigation of reaction products of alkali metal fluorides and fluorine. New insights about periodic trends in the reaction behaviour of alkali metals and the formation as well as the photochemistry of alkali metal trifluorides are presented. New bands were found for the antisymmetric stretches of CsF3 and [F3]− in solid krypton and nitrogen, and for the combination bands (νas + νs) of CsF3 and [F3]− in solid krypton and argon.
Iodine and bromine compounds dominate the field of polyhalogen anions, while only two polychlorides [Cl3]− and [Cl3⋯Cl2]− have been structurally characterized. Very recently a 2D structure of a polychloride network has been discovered.9 Beyond these heavier polyhalides which have been characterized by single crystal X-ray diffraction the characterization of polyfluorides is so far only possible in the gas phase or under cryogenic conditions in rare gas matrices. So far, only two polyfluorides, the trifluoride [F3]− and the pentafluoride [F5]−, have been prepared and characterized. The [F3]− was first observed as an ion pair complex MF3 (M = K, Rb, Cs) under cryogenic conditions in solid argon.10–12 An isolated [F3]− anion was for the first time observed in the gas phase by mass spectrometry13,14 and later found to be formed during condensation from a plasma of laser ablated metals and fluorine at 4 K in solid neon and argon.15 While [F4]2− has not been observed, yet, [F5]− was very recently isolated in neon matrices at 4 K.12
As mentioned earlier the polyfluorides can be prepared (a) by thermal evaporation of alkali metal fluorides like CsF, RbF, (b) from the neat metal like potassium using a Knudsen cell, or (c) by laser ablation of neat metals. Both latter techniques need an excess of elemental fluorine. The first technique is not only difficult to implement, it does not allow for the formation of free F− either, as the energy provided by the Knudsen cell is not high enough.
Therefore only ion-paired complexes can be observed while the second method leads to the formation of free polyfluorides like [F3]− and [F5]−.
In the present investigation we successfully and for the first time used the laser-ablation technique for the ablation of salts. Our setup was using a pulsed focused IR laser for the vaporisation of alkali metal fluorides, as it provides enough energy for the formation of free F− and therefore isolated polyfluoride monoanions. This method turned out in general to be a suitable and easy to implement method for the ablation of salts into the gas phase. These experiments revealed new insights about matrix isolated alkali metal polyfluorides of the whole alkali metal series and the free polyfluoride [F3]−, which are herein discussed and reported.
In the present work infrared (IR) laser ablation was applied to vaporize alkali metal fluorides, using a pulsed Nd:YAG laser. Although alkali fluorides are transparent for light of the wavelength λ = 1064 nm it is indeed possible to use a focused Nd:YAG laser for the IR ablation. The mechanisms that lead to the ablation of transparent materials with light of energy lower than the band gap can be explained by two effects.16,17 First, the band gap can be overcome by a multiphoton excitation. The other phenomena that increase the absorption of transparent materials are impurities and/or crystallographic imperfections, i.e. defects which lead to the formation of colour centres. The latter is assumed to be the main driving force as it forms localized electronic states inside the band gap resulting in a resonant enhancement of absorption by several orders of magnitude. Given that the targets used in this work are pellets of previously ground material (see Experimental section), defects might be the leading factor in the observed ablation. Using an optically polished NaF single crystal target did not lead to ablation of sodium fluoride but instead of the aluminium target holder.
Fig. 1 shows transmittance spectra of the reaction products of MF (M = K, Rb, Cs) with fluorine in solid neon. The band at 561 cm−1 that appeared in all three spectra could be identified as the antisymmetric stretching vibration (νas) band of the respective metal trifluoride ion pair M+[F3]− which has already been reported to be formed when vaporized potassium or caesium fluoride react with fluorine.12
The weaker band at 524 cm−1 that also appeared in all three spectra could be assigned to the antisymmetric stretching vibration (νas) of the free trifluoride [F3]− anion isolated in solid neon. The free trifluoride anion has already been reported to be formed in a similar setup, where transition metals were used as targets for laser ablation. In experiments where alkali fluorides were vaporized in a Knudsen cell, the free trifluoride anion has never been observed so far due to a lack of free fluoride anions in the gas phase. The fact that free [F3]− occurs in the present work indicates the presence of free F− anions in the laser-ablation plasma of the alkali metal fluoride pellets. The band positions and relative intensities of the observed polyfluoride bands are listed in Table 1.
Alkali Fluoride | MF3 | Intensitya | Free [F3]− | Intensitya |
---|---|---|---|---|
a Intensities obtained by integration of band areas (transmittance) and related to the band intensity observed for CsF3 in argon (see Table 2).b n.o.: not observed. | ||||
LiFb | n.o. | n.o. | n.o. | n.o. |
NaFb | n.o. | n.o. | n.o. | n.o. |
KF | 561.2 | 0.8 | 524.6 | 0.1 |
RbF | 561.2 | 2.4 | 524.6 | 0.3 |
CsF | 561.2 | 3.3 | 524.3 | 0.5 |
The corresponding difference spectra (b) in Fig. 1 show to what extend the matrix changes when irradiated with light of the wavelength λ = 455 nm. Bands pointing upwards indicate depletion of the corresponding molecular species. In all three cases the antisymmetric band of the M+[F3]− (M = K, Rb, Cs) ion pairs as well as the free [F3]− anion vanished during irradiation with this blue light. The assumption that [F3]− absorbs blue light would suggest a yellow colour for this species. However, it seems more likely that fluorine is cleaved photolytically and the fluorine radicals react with [F3]−.
Changing the matrix host gas from neon to argon shifts the corresponding bands to lower wavenumbers. Fig. 2 shows the 500–580 cm−1 region of the transmittance spectra of the reaction products of IR laser ablated MF (M = Li, Na, K) with fluorine in solid argon. In contrast to the experiments in solid neon, the spectra obtained with LiF and NaF show a band in this area. The band at 510 cm−1 that appears in each of the spectra is due to the antisymmetric stretching frequency of the free trifluoride monoanion as reported already in 2010.15
The ion pair M+[F3]− is not observed in any of these spectra, although K+[F3]− was observed in neon. The relative intensities displayed in Table 2 are generally higher than those in neon (Table 1), which indicates that the formation of the free [F3]− anion is favoured in argon. An explanation, why the ion pair is not formed with lower alkali metals could be that LiF and NaF show stronger coulomb interactions. The formation of the free polyfluorides is then only possible in cases where the cation and anion separation in the gas phase is large enough so that no interaction can occur.
Alkali fluoride | MF3 | Intensitya | Free [F3]− | Intensitya |
---|---|---|---|---|
a Intensities obtained by integration of band areas (transmittance) and related to the band intensity observed for CsF3 in argon.b n.o.: not observed. | ||||
LiFb | n.o. | n.o. | 510.2 | 2.4 |
NaFb | n.o. | n.o. | 510.3 | 1.3 |
KF | n.o. | n.o. | 510.4 | 2.8 |
RbF | 549.2 | 17.9 | 510.7 | 5.3 |
CsF | 549.9 | 100.0 | 510.6 | 25.5 |
Fig. 3 shows the spectral region 500–580 cm−1 of the transmittance spectra of the reaction products of laser ablated rubidium and caesium fluoride with fluorine in solid argon. These spectra show two large bands in this region. The smaller band at 510 cm−1 can be assigned to νas of [F3]−, see above. The larger band at around 550 cm−1 is known as νas of the ion pair M+[F3]− in argon.10,11 The intense νas(Rb+[F3]−) and the even more intense νas(Cs+[F3]−) support the assumption that higher alkali metal cations can form more stable ion pairs with [F3]− than the lower ones. However, not only more ion pairs were observed for the higher alkali metal fluorides but also larger amounts of free [F3]− anions. This can be explained with the decreasing coulomb interaction in the direction of higher alkali metal fluorides allowing for easier formation of free F− in the plasma, see also the paragraph above.
Table 2 shows the band positions of the antisymmetric vibrations of the observed polyfluorides and their relative intensities obtained by integration of transmittance band areas for the matrix-isolation experiments in solid argon. Both spectra b shown in Fig. 2 and 3 are difference spectra obtained after irradiation with light of a wavelength λ > 220 nm. In contrast to the experiments in neon, the bands were not easily destroyed by irradiation with blue light (λ = 455 nm), which supports the hypothesis that the photolysis in neon is due to a secondary effect and could therefore mean that fluorine radicals cannot migrate through the argon matrix as easily as in neon. The disappearance of the bands after irradiation with light of higher frequency is considered to be due to direct photolysis.
As shown above and in agreement with our understanding of chemical bond, the largest amount of polyfluorides have been prepared by laser ablation of caesium fluoride. The matrix-isolation experiments with caesium fluoride in argon yielded such intense bands for the antisymmetric stretching vibrations of the ion pair Cs+[F3]− and free [F3]− that combination bands appeared in the area between 890 and 930 cm−1. The transmittance spectrum of the reaction products of CsF and F2 (6%) in solid argon as well as the difference spectrum after irradiation (λ = 266 nm) are shown in Fig. 4, the positions and relative intensities of the bands are listed in Table 3.
Vibration | CsF3 | Intensitya | Free [F3]− | Intensitya |
---|---|---|---|---|
a Intensities obtained by integration of band areas (transmittance) and related to the band intensity observed for CsF3 in argon.b Raman band.11c Predicted from the observed combination band νas + νs.d CCSD(T)(anharm.)/def2-QZVPP.9e CCSD(T)(anharm.)/aug-cc-pVQZ.15 | ||||
Argon | ||||
νas | 549.9 | 100.0 | 510.6 | 25.5 |
νs | 389b | — | 396 ± 5c | — |
νas + νs | 923.4 | 2.5 | 892.0 | 0.5 |
![]() |
||||
Krypton | ||||
νas | 546.5 | 107.6 | 511.7 + 508.8 | 27.8 |
νs | 388 ± 5c | — | 394 ± 5c | — |
νas + νs | 919.0 | 2.0 | 888.8 | 0.8 |
![]() |
||||
Nitrogen | ||||
νas | 551.0 | 17.2 | 517.3 | 2.4 |
![]() |
||||
Calculated | ||||
νas | 568.2d | — | 523.4e | — |
νs | 388.2d | — | 397.0e | — |
The stronger band at 923 cm−1 can be assigned to the νas + νs combination band of the Cs+[F3]− ion pair as this is in good agreement with the sum of the fundamentals νas + νs = 549.9 + 389 = 938.9 cm−1. The previously reported Raman band assigned by Ault et al. to the νs band at 461 cm−1 has to be reassigned to the weaker band shown in the same spectrum at 389 cm−1,11 which agrees very well with our predicted band. The observed combination band is shifted by 15 cm−1 towards lower wavenumbers due to anharmonicity. The newly assigned Raman band of Cs+[F3]− is in excellent agreement with the recently calculated value of 388.2 cm−1 at the CCSD(T)/def2-QZVPP level.12 The simultaneous disappearance of the two bands at 550 cm−1 and 923 cm−1 during irradiation (λ = 266 nm) is an additional proof for those two bands belonging to the same molecular species, see Fig. 4.
The weaker band at 892 cm−1 also disappears after irradiation with light of the wavelength λ = 266 nm as does the band at 510 cm−1. Taking this into account, the band at 892 cm−1 can be assigned to the combination band νas + νs of the free [F3]− anion, especially because of the good correlation of the intensity ratios of the two fundamental bands in comparison with the two combination bands. Based on the newly observed combination band taking the anharmonicity x13 into account, the symmetric stretching band νs of the free [F3]− anion can be predicted to appear at around νs = (νas + νs) − νas + x13 = 892.0 − 510.6 + 15 = 396.4 cm−1 which would be consistent with the calculated value of 397.0 cm−1 at CCSD(T)/aug-cc-pVQZ level.15
Fig. 5 shows transmittance spectra of the reaction products of IR laser ablated CsF with F2 (6%) in solid argon after deposition (a) and difference spectra after annealing to 13 K (b), 15 K (c), 17 K (d), 19 K (e), 21 K (f), 23 K (g), and 25 K (h). Difference spectra at each annealing temperature were obtained by using the preceding low temperature spectrum at 5 K, respectively.
The upwards pointing bands at 550 cm−1 in the higher temperature difference spectra (b–h) in Fig. 5 clearly indicate the decomposition of the ion pair Cs+[F3]− at 13–25 K. The difference spectra recorded after recooling to 5 K (b–h) show downwards pointing bands at 550 cm−1 which is indicative for a reformation of the ion-pair complex Cs+[F3]− during recooling. This observation suggests that Cs+[F3]− exists in a reversible equilibrium with CsF and F2 at temperatures below 25 K.
![]() | (1) |
During annealing small amounts of F2 are constantly withdrawn from the equilibrium which leads to decreasing band intensities in the 5 K spectra. This loss of F2 is probably due to inhomogeneous heating of the matrix window as the measured temperature does not perfectly represent the temperature at any part of the matrix. Annealing at temperatures higher than 25 K lead to complete evaporation of F2 resulting in an irreversible decomposition of the ion pair complex.
We also repeated the annealing experiments in krypton matrices showing the same effects as described above, see Fig. S1 in ESI.† In krypton complete decomposition of Cs+[F3]− starts at 20 K. In Fig. S2† it can be seen that the combination band νas + νs at 919 cm−1 shows the same reversible thermal behaviour as the νas of the Cs+[F3]− in krypton. This supports again our assignment of this band to a combination band. The band shows a small red-shift of 3 cm−1 if compared with the argon matrix.
The combination band of [F3]− at 889 cm−1 appears 3 cm−1 lower than the νas + νs combination in argon. Using the observed values of νas + νs Cs+[F3]− and νas + νs [F3]− and the respective antisymmetric stretching vibrations in solid krypton, the corresponding symmetric stretching vibrations can be predicted to appear around νs(CsF3) = 919.0 − 546.5 + 15 = 387.5 cm−1 and νs([F3]−) = 888.8 − (511.7 + 508.8/2) + 15 = 393.6 cm−1, taking anharmonicity into account. Their positions as well as the predicted Raman bands for the symmetrical stretching modes in solid krypton are listed in Table 3. Fig. S3† shows the transmittance spectrum of the reaction products of IR laser ablated CsF and F2 (6%) in solid nitrogen. The bands at 551 cm−1 and 517 cm−1 vanish during irradiation (λ > 220 nm) and can be assigned to the antisymmetric stretching frequencies of Cs+[F3]− and [F3]−, respectively. In contrast to the experiments in argon and krypton, but analogue to the experiment with neon, the yields of the polyfluorides were not high enough for combination bands to be observed.
Beyond these observations, it should be mentioned, that other metal fluorine species such as the star like CsF5 which has recently been predicted based on quantum-chemical calculations have not been observed in the present work.18
Footnote |
† Electronic supplementary information (ESI) available. See DOI: 10.1039/c5ra24227d |
This journal is © The Royal Society of Chemistry 2015 |