Synergistic effect between eosin Y and rhodamine B on a photoelectrode coated with Pt nanoparticle-decorated graphene

Wenjiu Wanga, Shi-Zhao Kang*a, Dong Wangb, Xiangqing Lia, Lixia Qina and Jin Mu*a
aSchool of Chemical and Environmental Engineering, Shanghai Institute of Technology, 100 Haiquan Road, Shanghai 201418, China. E-mail: kangsz@sit.edu.cn; Fax: +86 21 60873061; Tel: +86 21 60873061
bKey Laboratory of Molecular Nanostructure and Nanotechnology, Institute of Chemistry, Chinese Academy of Sciences, Bejing National Laboratory for Molecular Sciences, Beijing 100190, China

Received 16th November 2015 , Accepted 24th November 2015

First published on 7th December 2015


Abstract

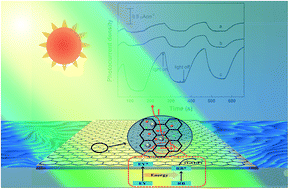
In the present work, a photoelectrochemical system containing eosin Y, rhodamine B and graphene loaded with Pt nanoparticles was fabricated. The synergistic effect between eosin Y and rhodamine B was explored using photoelectrochemical techniques. The results show that there exists an obvious synergistic effect between eosin Y and rhodamine B in the as-fabricated photoelectrochemical system. Compared with the photoelectrochemical systems containing only eosin Y or rhodamine B, the photoelectrochemical system containing eosin Y and rhodamine B exhibits higher photoelectrochemical response. When graphene loaded with Pt nanoparticles is cosensitized by eosin Y and rhodamine B, the photocurrent is about 71% higher than the sum of the photocurrents of the photoelectrochemical system containing eosin Y and the photoelectrochemical system containing rhodamine B. This synergistic effect may be ascribed to the energy transfer from eosin Y to rhodamine B under irradiation. Herein, the Pt nanoparticles play an important role in the photovoltaic performance. The synergistic effect between eosin Y and rhodamine B cannot be observed if the Pt nanoparticles are absent. Moreover, the synergistic effect was investigated as a function of pH, content of Pt, molar ratio of eosin Y to rhodamine B, and total concentration of eosin Y and rhodamine B, respectively.

1. Introduction

During the past few decades, renewable energy sources have been paid more and more attention due to the energy crisis and environmental concerns. Among the renewable energy sources reported, solar energy is regarded as one of the most promising candidates owing to availability, eco-friendliness and lower cost. The idea is to capture solar energy and turn it into electric power or chemical fuels, such as hydrogen.1 Followed this idea, a lot of efforts have been devoted to the development of solar cell materials and photocatalysts. And a series of efficient solar cell materials and photocatalysts have been reported, such as TiO2,2,3 ZrO2,4 ZnO,5 SrTiO3,6 Ta2O5,7 Sr2M2O7 (M = Nb, Ta),8,9 ATaO3 (A = Li, Na, and K)10 and so on. Nevertheless, the energy conversion efficiency of the solar energy materials need be further enhanced under visible irradiation from the practical point of view. Therefore, the approach to solar cell materials and photocatalysts which can be capable of efficiently using visible light has become a hot topic in the field of solar energy materials. In this respect, dye sensitization is one of the most efficient ways to extend the light absorption of the solar energy materials to the visible region. For example, when Ti-MCM41 zeolite is sensitized by eosin Y, it can exhibit high photocatalytic activity for hydrogen evolution under visible irradiation. The apparent quantum efficiency can be up to 12.01%.11 Stalder et al. reported that the power conversion efficiencies of the TiO2-based solar cell can be up to 6.4% under simulated sunlight irradiation using donor-acceptor-donor oligothiophene as a sensitizer.12 Recently, the cosensitization strategy using two kinds of dyes have attracted more and more interest because of very high energy conversion efficiency and broad light response region. Numerous excellent cosensitization systems including TiO2–porphyrin/tertiary arylamine compound,13 TiO2–black dye/deoxycholic acid,14 TiO2–ruthenium-based metal ligand complexes/zinc naphthalocyanine-based dye,15 graphene/Pt–eosin Y/rose bengal16 and TiO2–zinc phthalocyanine/ascorbic acid agents17 were fabricated. Therein, eosin Y (EY) and rhodamine B (RB) are common sensitizors,18–20 and the energy conversion efficiency of the solar energy materials would be significantly enhanced when they are cosensitized by EY and RB. For example, a high quantum yield up to 37.3% can be achieved under visible irradiation (520 nm and 550 nm) when the photocatalytic system containing graphene, Pt, EY and RB is used for H2 evolution from water.16 The results reported previously indicate that this dramatic photocatalytic activity might be ascribed to the synergistic effect between EY and RB. However, the synergistic effect between EY and RB is not discussed systematically in the previous papers. It is still unclear so far that this synergistic effect ought to be attributed to the energy transfer or the electron interaction between EY and RB. Therefore, it is meaningful to explore the synergistic effect between EY and RB in detail, which should contribute to better understanding of the multiple dyes cosensitization mechanism.

On the other hand, graphene as a two-dimensional nanomaterial has been regarded as an ideal candidate and widely applied in the fields of solar cells and photocatalysis due to dramatic optical transmittance, large specific surface area and excellent electron transport property.21–24 Particularly, when graphene is combined with dyes, the solar energy conversion systems containing graphene and dyes can often display very attractive high energy conversion efficiency. For example, Kong et al. prepared a photocatalytic system containing eosin Y, NiSx and graphene. The as-prepared photocatalytic system possesses very high photocatalytic activity for hydrogen evolution under visible light irradiation. The highest quantum efficiency is up to 32.5% at 430 nm.25 When the graphene loaded with Pt is sensitized by porphyrin, the rate of H2 evolution is up to 1.05 mmol g−1 h−1 under UV-vis light irradiation.26 However, most of the studies are focused on the applications of mono-dye-sensitized graphene in the field of the solar energy conversion. There are few papers on the multi-dye-sensitized graphene so far. It is well known that well-understood intermolecular interaction between or among the dyes is a key when an efficient cosensitization system is designed for light-driven H2 evolution from water. Thus, it is worthy to discuss the synergistic effect between EY and RB on graphene.

In this work, we fabricated a photoelectrochemical system containing EY, RB and the graphene loaded with Pt nanoparticles. And the photoelectrochemical behavior of EY and RB was investigated to discuss the synergistic effect between EY and RB. Moreover, the synergistic effect was systematically studied as a function of pH, content of Pt, molar ratio of eosin Y to rhodamine B, and total concentration of eosin Y and rhodamine B, respectively. Finally, the cosensitization mechanism was preliminarily discussed.

2. Experimental

2.1 Materials

Hydrogen hexachloroplatinate(IV) hydrate (H2PtCl6·nH2O n = 5.5) was purchased from Sinopharm Chemical Reagent Co., Ltd. Rhodamine B (C28H31ClN2O3) and eosin Y (C20H6Br4Na2O5) (Chart 1) were purchased from Sinopharm Chemical Reagent Co.,Ltd. All of other reagents (A.R.) were commercial available and used without further purification. Deionized water was used as solvent.
image file: c5ra24178b-c1.tif
Chart 1 Structures of eosin Y and rhodamine B.

2.2 Fabrication of electrodes coated with the Pt nanoparticles decorated graphene

Graphene oxide (GO) was prepared according to the procedure reported in ref. 27.27 In a typical preparation process of the electrodes coated with the Pt nanoparticles decorated graphene (rGO–Pt), H2PtCl6 aqueous solution (0.675 mL, 0.019 mol L−1) was added into a beaker containing GO aqueous suspension (50 mL, 1 mg mL−1). After stirred overnight at room temperature, the suspension (0.5 mL) was coated on the surface of a clean FTO substrate (1 × 3 cm), and then naturally dried in ambient condition. Subsequently, this FTO substrate was irradiated for 3 h using a 300 W Xe lamp with an optical filter (λ < 420 nm) as a light source. The resulting product is an electrode coated with the Pt nanoparticles decorated graphene. In order to describe conveniently, the as-prepared electrodes are abbreviated to rGO–x%Pt, in which x% is the mass percent of Pt.

2.3 Photoelectrochemical measurements

The photoelectrochemical systems used were rGO–Pt sensitized with EY, rGO–Pt sensitized with RB and rGO–Pt cosensitized with eosin Y and rhodamine B, respectively. In the case of cosensitization, the mixed dye consisted of eosin Y and rhodamine B is abbreviated to ER (m[thin space (1/6-em)]:[thin space (1/6-em)]n), in which m[thin space (1/6-em)]:[thin space (1/6-em)]n is the molar ratio of EY to RB.

The photoelectrochemical behavior of the samples was recorded using a CHI660E electrochemical system (Shanghai Chenhua Instruments, China) in a conventional three-electrode cell. The FTO substrate coated with the Pt nanoparticles decorated graphene was used as a working electrode. An Ag/AgCl electrode and a platinum electrode were used as the reference electrode and the counter electrode, respectively. The supporting electrolyte was the mixture of triethanolamine (TEOA, 15 vol%) and Na2SO4 (0.1 mol L−1). A 300 W xenon lamp with an optical cutoff filter (λ ≥ 420 nm) was utilized as a light source. The distance between the lamp and the reactor was 1 cm. Nitrogen was utilized for deaeration.

2.4 Characterization

X-ray photoelectron spectroscopy (XPS) analysis was carried out using a Thermo Fisher ESCALAB 250Xi X-ray photoelectron spectrometer equipped with a monochromatic Al (Kα) source (USA). Raman spectra were measured on an inVia-Reflex Micro-Raman spectroscopy system with a 532 nm DPSS laser (UK). UV-vis spectra were measured with a Tianmei UV 1000 spectrophotometer (China). Fluorescent spectra were recorded on a Hitachi F-4600 fluorescence spectrophotometer (Japan). Time-resolved fluorescent spectra were measured with an Edinburgh Instrument FLS920P spectrometer (UK) using the time correlated single-photon-counting technique. Zeta potential was recorded with a POWEREACH JS94H2 zeta potential analyzer (China). The field emission scanning electron microscope (FESEM) images and the energy dispersive spectrum (EDS) mappings of Pt and C were recorded with a Hitachi S-4800 (Japan) field emission scanning electron microscope (FESEM). The high resolution transmission electron microscope (HRTEM) images were taken on a JEOL JEM-2100 transmission electron microscope (Japan).

3. Results and discussion

3.1 Characterization of rGO–Pt

Fig. 1A shows the UV-vis spectra of the FTO substrates coated with the H2PtCl6 adsorbed GO (GO–Pt) and the Pt nanoparticles decorated graphene. As can be seen from Fig. 1A, GO–Pt possesses an absorption band around 226 nm and a shoulder at 300 nm (curve a), corresponding to the π–π* transition of aromatic C[double bond, length as m-dash]C and the n–π* transition of the C[double bond, length as m-dash]O bond of GO, respectively.28,29 In contrast, rGO–Pt exhibits a relatively broad absorption band around 243 nm (curve b). And the absorption band red-shifts 17 nm in comparison with that of GO–Pt. Moreover, we can also observe from curve b that the shoulder at 300 nm disappears. These phenomena ought be ascribed to restoration of the π-conjugated network and disappearance of the oxygen-containing groups of GO.30 Moreover, as can be seen from ESI Fig. S1, the absorption band of rGO–Pt gradually shifts to longer wavelength with the irradiation time increasing. The shift rises up to a plateau after about 3 h, suggesting that the photoreduction is basically complete. Therefore, it can be deduced that the initial GO coated on the FTO substrate is transformed into reduced graphene oxide (RGO) after photoreduction for 3 h.
image file: c5ra24178b-f1.tif
Fig. 1 (A) UV-vis spectra of GO–Pt (a) and rGO–5%Pt (b); (B) high-resolution XPS spectrum of Pt 4f of rGO–5%Pt.

In order to further determine restoration of the π-conjugated network, the Raman spectra of GO–Pt and rGO–Pt were measured and shown in ESI Fig. S2. As can be seen from Fig. S2, GO–Pt (curve a) displays two obvious Raman peaks at 1356 cm−1 and 1604 cm−1, corresponding to the D band and G band of GO, respectively.26 Similarly, we can also observe the Raman peaks at about 1356 cm−1 and 1604 cm−1 from the Raman spectrum of rGO–Pt (curve b), respectively. These Raman peaks can be ascribed to the D band and G band of RGO.26 In addition, the intensity ratio of the D band to G band (ID/IG) increases from 0.77 to 0.85 after photoreduction. It is well-known that the increased ratio of ID/IG is powerful evidence to confirm the transformation of GO to RGO.31 Therefore, combined with the results of UV-vis spectra, it can be concluded that the GO is successfully reduced to the RGO in the photoreduction process.

Fig. 1B shows the high-resolution XPS spectrum of Pt 4f of rGO–Pt. From Fig. 1B, it can be found that there exist two XPS peaks at around 70.83 eV and 74.13 eV, respectively. The XPS peak at 70.83 eV may be assigned to Pt 4f 7/2 of metallic Pt. Likewise, the XPS peak at 74.13 eV may be attributed to Pt 4f 5/2 of metallic Pt.32,33 Therefore, we can deduce that not only GO can be reduced to RGO, but H2PtCl6 can also be reduced to metallic Pt in the photoreduction process. The as-prepared rGO–Pt consists of RGO and Pt0. In addition, compared with the binding energy of Pt 4f 7/2 of metallic Pt (71.2 eV),33 the XPS peak of rGO–Pt obviously shifts to lower binding energy. A local increase of the electron density on Pt may be responsible for this negative shift.33 This phenomenon implies that there exists some strong interaction between Pt and RGO.

Fig. 2 shows the FESEM images, the EDS-mappings and the TEM images of rGO–Pt. It can be seen in Fig. 2a that the surface of rGO–Pt is uniform, and there exists some folded material on the surface. The void spaces and cracks cannot be found from Fig. 2a. The SEM image with high magnification (Fig. 2b) further indicates the drapes observed in Fig. 2a might be ascribed to pucker of nanosheets, suggesting the presence of RGO. The elemental mapping image of C (Fig. 2c) shows that the distribution of C is homogeneous on the surface of FTO substrate. These results confirm that the surface of FTO substrate is uniformly covered by the RGO loaded with Pt to form a high quality thin film.


image file: c5ra24178b-f2.tif
Fig. 2 FESEM images of rGO–5%Pt (a, b); elemental mapping images of C (c) and Pt (d) corresponding to (b); TEM image (e) and HRTEM image (f) of rGO–5%Pt.

From the TEM image of rGO–Pt (Fig. 2e), we can clearly observe the presence of RGO, and many black particles with the mean diameter of approximate 2.0 nm distributed throughout the RGO nanosheet. Because the Pt atoms are heavier than the C atoms, the Pt-rich areas on the RGO nanosheet will exhibit relatively blacker images. Therefore, it can be assumed that the black particles are the Pt nanoparticles loaded on the RGO nanosheets. The high-resolution TEM (HRTEM) image (Fig. 2f) reveals that there exist some lattice fringes in the black areas distributed on the RGO nanosheet. The spacing between two conjoint planes is about 0.225 nm, corresponding to the (111) plane of face-centered cubic Pt (JCPDS no. 882343).34 Moreover, it can be also found from the elemental mapping of Pt (Fig. 2d) that Pt is uniformly distributed on the surface of RGO nanosheet. Based on these experimental results, we can conclude that the Pt nanoparticles have been directly and homogeneously decorated on the RGO nanosheets. A high quality electrode modified with the Pt nanoparticles decorated RGO has been successfully fabricated through the procedure described above.

3.2 Photoelectrochemical behavior of rGO–Pt cosensitized with ER

Fig. 3 shows the transient photocurrent time profiles of rGO–Pt sensitized with EY, RB or ER. For comparison, the transient photocurrent time profiles of RGO sensitized with EY, RB or ER are also shown in Fig. 3. As can be seen from Fig. 3A, rGO–Pt cosensitized with ER exhibits an obviously higher photoelectrochemical response in comparison with those of both rGO–Pt sensitized with EY and rGO–Pt sensitized with RB. Furthermore, we can clearly observe from Fig. 3B that there exists significant synergistic effect between EY and RB on the RGO loaded with Pt nanoparticles. The photoelectrochemical response of rGO–Pt is 0.96 μA cm−2 in the solution of ER (total concentration 1 × 10⁻⁴ mol L−1, the molar ratio of EY to RB 1[thin space (1/6-em)]:[thin space (1/6-em)]1). On the contrary, the photocurrents of rGO–Pt in the EY solution (5 × 10⁻⁵ mol L−1) and the solution of RB (5 × 10⁻⁵ mol L−1) are only 0.24 μA cm−2 and 0.32 μA cm−2, respectively. The photoelectrochemical response of rGO–Pt cosensitized with ER is about 71% higher than the sum of the responses of the photoelectrochemical systems using individual dye. These results indicate that it may be a useful tool for improvement in the energy conversion efficiency to take advantage of the cosensitization effect of EY and RB.
image file: c5ra24178b-f3.tif
Fig. 3 (A) Transient photocurrent–time curves of EY (a), RB (b), and ER (1[thin space (1/6-em)]:[thin space (1/6-em)]1) (c) sensitized rGO–5%Pt, dye concentration: EY 1 × 10⁻⁴ mol L−1, RB 1 × 10⁻⁴ mol L−1, ER (1[thin space (1/6-em)]:[thin space (1/6-em)]1) 1 × 10⁻⁴ mol L−1; (B) transient photocurrent–time curves of EY (a), RB (b), and ER (1[thin space (1/6-em)]:[thin space (1/6-em)]1) (c) sensitized rGO–5%Pt, dye concentration: EY 5 × 10⁻⁵ mol L−1, RB 5 × 10⁻⁵ mol L−1, ER (1[thin space (1/6-em)]:[thin space (1/6-em)]1) 1 × 10⁻⁴ mol L−1; (C) transient photocurrent–time curves of EY (a), RB (b), and ER (1[thin space (1/6-em)]:[thin space (1/6-em)]1) (c) sensitized RGO, dye concentration: EY 5 × 10⁻⁵ mol L−1, RB 5 × 10⁻⁵ mol L−1, ER (1[thin space (1/6-em)]:[thin space (1/6-em)]1) 1 × 10⁻⁴ mol L−1 (electrolytes: mixed aqueous solution containing TEOA (15 vol%) and Na2SO4 (0.1 mol L−1), pH 7).

In order to deeply understand the significant synergistic effect between EY and RB, the absorption spectra of EY, RB and ER aqueous solutions which contained TEOA (15 vol%) and Na2SO4 (0.1 mol L−1) were measured at pH 7, respectively (Fig. 4A). As can be seen from Fig. 4A, the absorption spectrum of EY (curve a) possesses a characteristic absorption band at 519 nm. And the maximum absorption of RB (curve b) appears at 556 nm. These absorption bands may be attributed to the π–π* transitions of the conjugated molecules.35 In addition, it can be found that there exist the shoulder bands at about 485 nm and 515 nm in the spectra of EY and RB, respectively, which are characteristics of the aggregated xanthene dye molecules.35,36 On the contrary, ER shows relatively strong absorption band which consists of two absorption peaks centered at around 519 nm and 556 nm. The control experimental results (Fig. S3) indicate that if the total concentration of ER is constant, the absorption at 519 nm gradually decreases while the absorption at 556 nm increases with the content of EY decreasing. Thus, it can be deduced that the absorption peak at 519 nm should be ascribed to the π–π* transition of EY, and the peak at 556 nm should be from the π–π* transition of RB. Notably, it is interested that the absorption peaks of ER does not present any shift in comparison with those of the individual dyes. The absorption spectrum of ER is almost the superposition of the spectra of the individual dyes in brief, implying that there may exist no electron transfer between EY and RB.


image file: c5ra24178b-f4.tif
Fig. 4 (A) UV-vis spectra of EY (a), RB (b) and ER (1[thin space (1/6-em)]:[thin space (1/6-em)]1) (c) (dye concentration: EY 1 × 10⁻⁵ mol L−1, RB 1 × 10⁻⁵ mol L−1, ER (1[thin space (1/6-em)]:[thin space (1/6-em)]1) 2 × 10⁻⁵ mol L−1; TEOA concentration: 15 vol%; Na2SO4 concentration 0.1 mol L−1; pH 7); (B) UV-vis spectra of EY (a), RB (b), and ER (1[thin space (1/6-em)]:[thin space (1/6-em)]1) (c) adsorbed on rGO–5%Pt; (C) UV-vis spectra of EY (a), RB (b), and ER (1[thin space (1/6-em)]:[thin space (1/6-em)]1) (c) adsorbed on RGO.

Fig. 4B shows the UV-vis spectra of the EY adsorbed rGO–Pt, the RB adsorbed rGO–Pt and the ER adsorbed rGO–Pt. Likewise, the UV-vis spectra of the EY adsorbed RGO, the RB adsorbed RGO and the ER adsorbed RGO are also shown in Fig. 4C. From Fig. 4B, it can be found that when EY is adsorbed on the surface of rGO–Pt, an obvious red-shift is caused. The absorption peak of EY red shifts from 519 nm to 532 nm compared with that of EY aqueous solution. This phenomenon indicates that some J-aggregate-like stacked structures of EY are formed on the surface of rGO–Pt, implying that the EY molecules orientate themselves in a titled conformation.37 Similarly, a red-shift from 556 nm to 580 nm can be observed when RB is adsorbed on rGO–Pt, indicating the formation of J-type aggregation of RB on rGO–Pt. Moreover, the absorption peak of EY adsorbed on rGO–Pt is much weaker than that of RB, which shows that RB is adsorbed more easily on the surface of rGO–Pt than EY. One possible explanation is that RB possesses some positive charges while EY possesses some negative charges. There exists strong electrostatic attraction between RB and RGO with negative charge. On the contrary, the interaction between EY molecules and RGO is electrostatic repulsion. As a result, compared with RB, the adsorption of EY on the surface of rGO–Pt is relatively more difficult. In addition, we can also find from Fig. 4B that the UV-vis spectrum of the ER adsorbed rGO–Pt is similar to that of the RB adsorbed rGO–Pt. The absorption peak at 578 nm ascribed to RB in the cosensitizer absorbed on rGO–Pt slightly blue shifts by 2 nm with respect to that of RB absorbed on rGO–Pt. The shoulder band at around 532 nm is relatively obvious, and the height is about 60 percent of that of the peak at 578 nm. On the contrary, the height of the shoulder peak of RB absorbed on rGO–Pt is 50 percent of that of the peak at 580 nm. These phenomena suggest that EY and RB can be co-adsorbed on rGO–Pt and the dye molecules orientate themselves in a titled conformation. And, similar to ER in solution, there may also exist no electron transfer between EY and RB on the surface of rGO–Pt.

Fig. 5A shows the fluorescence spectra of EY, RB and ER excited at 446 nm. Meanwhile, Fig. 5B shows the fluorescence spectra of EY, RB and ER excited at 503 nm. As can be seen from Fig. 5A, EY (curve a) and RB (curve b) exhibit intensive emission peaks located at 551 nm and 593 nm, respectively. Relatively, ER (curve c) exhibits two emission peaks at 540 nm and 593 nm. The emission peak at 540 nm would be assigned as the emission of EY in the mixed dye while the peak at 593 nm would be the emission of RB. It is worth to note that the emission of EY blue shifts by 11 nm and is markedly quenched when EY is mixed with RB. In contrast, the emission peak of RB obviously become stronger due to introduction of EY, and no shift due to EY can be observed. On the other hand, when the excitation wavelength is 503 nm (Fig. 5B), we can observe almost same photoluminescence behavior of EY (curve a), RB (curve b) and ER (curve c) as that shown in Fig. 5A. The maximum emission wavelengths of EY, RB and ER are still 551 nm, 593 nm, 540 nm and 593 nm, respectively. When EY is mixed with RB, the blue shift and the quenching of EY emission can be found. The introduction of EY does not lead to shift of the emission peak of RB too. However, compared with the pure RB, ER exhibits much weak emission at 593 nm. One possible explanation is that there exists some energy transfer between EY and RB. Under excitation, EY molecules are excited. Then, the excited EY molecules pass their energy to the ground RB molecules, which leads to quenching of the emission of EY. In addition, because of the interaction between EY and RB, the resonant structure transformation of EY (Chart 1) may be hindered. As a result, the emission of EY shifts from 551 nm to 540 nm when EY is mixed with RB. The excitation spectra of EY and RB (ESI Fig. S4) show that the maximum excitation wavelengths of EY and RB are 475 nm and 503 nm, respectively. The emission of RB excited at 446 nm is relatively weak while the emission of EY excited at 503 nm is fairly strong. In other words, under excitation at 446 nm, most of RB molecules are in the ground state. In contrast, under excitation at 503 nm, not only most of RB molecules are excited, but a considerable amount of EY molecules are also in the excitation state. Therefore, the lifetime of the excited RB molecules can be prolonged due to the energy transfer from EY to RB, which leads to weakening of the RB emission.


image file: c5ra24178b-f5.tif
Fig. 5 (A) Fluorescence spectra of EY (a), RB (b), and ER (1[thin space (1/6-em)]:[thin space (1/6-em)]1) (c) excited at 446 nm; (B) fluorescence spectra of EY (a), RB (b), and ER (1[thin space (1/6-em)]:[thin space (1/6-em)]1) (c) excited at 503 nm (dye concentration: EY 5 × 10⁻⁵ mol L−1, RB 5 × 10⁻⁵ mol L−1, ER (1[thin space (1/6-em)]:[thin space (1/6-em)]1) 1 × 10⁻⁴ mol L−1; TEOA concentration: 15 vol%; Na2SO4 concentration 0.1 mol L−1; pH 7); (C) fluorescence spectra of the ER (1[thin space (1/6-em)]:[thin space (1/6-em)]1) solution (a), the mixture containing ER (1[thin space (1/6-em)]:[thin space (1/6-em)]1) and RGO (b), and the mixture containing ER (1[thin space (1/6-em)]:[thin space (1/6-em)]1) and RGO loaded with 5%Pt (c) excited at 475 nm; (D) fluorescence spectra of the ER (1[thin space (1/6-em)]:[thin space (1/6-em)]1) solution (a), the mixture containing ER (1[thin space (1/6-em)]:[thin space (1/6-em)]1) and RGO (b), and the mixture containing ER (1[thin space (1/6-em)]:[thin space (1/6-em)]1) and rGO–5%Pt (c) excited at 503 nm (dye concentration: ER (1[thin space (1/6-em)]:[thin space (1/6-em)]1) 1 × 10⁻⁴ mol L−1; RGO loaded with 5%Pt 0.1 mg mL−1; RGO 0.1 mg mL−1; TEOA concentration: 15 vol%; Na2SO4 concentration 0.1 mol L−1; pH 7).

Fig. 5C and D shows the fluorescence spectra of the ER solution in the presence of Pt loaded RGO or RGO. As can be seen from Fig. 5C and D, the emission peak of ER are all drastically quenched when the Pt loaded RGO is introduced, whether excited at 475 nm or 503 nm. Since there is no obvious overlap between the absorption band of graphene and the emission peak of ER, these phenomena indicate that there exists the interfacial electron transfer from the excited dye molecules to graphene.38

Based on the experimental results above, a possible mechanism is proposed to deeply discuss the synergistic effect between EY and RB (Scheme 1). Under visible irradiation, both EY and RB can be excited. The work function of graphene is about −4.66 eV.39 The reductive potentials of excited EY and RB is around −1.05 and −0.95 V (vs. NHE), corresponding to the work functions vs. vacuum of −3.45 and −3.55 eV respectively.40 Thus, the electrons of the excited dye molecules can be synchronously injected into RGO. It is well known that the efficiency of electron transfer is closely related to the distance between the dye molecules and graphene. Only the dye molecules adsorbed on RGO are able to inject their electron into RGO. Due to competition between EY and RB in absorption, the dye molecules absorbed on RGO may mainly be RB molecules. As a result, the excited EY molecules cannot efficiently directly inject the electrons into RGO. Hence, the excited EY molecules transfer their energy to the RB molecules and make the RB ground molecules excite. These excited RB molecules inject their electrons into RGO so as to arise the enhancement of photocurrent. Here, the energy transfer plays two roles in the enhancement of photocurrent: (1) increase the number of the RB molecules in the excitation state so as to broaden the work wavelength range of RB; (2) prolong the lifetime of the RB molecules in the excitation station, which is favour to the electron injection from the excited RB molecules to RGO.


image file: c5ra24178b-s1.tif
Scheme 1 Schematic diagram for the synergistic effect between EY and RB on rGO–Pt.

For verification of the mechanism suggested, the photoelectrochemical behavior of the rGO–Pt sensitized with EY, RB or ER was explored under monochromatic light irradiation. Meanwhile, the emission decay curves of EY, RB and ER were also measured. The results obtained are shown in Fig. 6 and S5, respectively. It can be found that the rGO–Pt sensitized with EY exhibits an obvious photoelectrochemical response under irradiation near the maximum absorption wavelength of EY (520 nm) meanwhile a relatively weak response of the rGO–Pt sensitized with RB is also observed (Fig. 6A). As expected, the rGO–Pt cosensitized with ER shows obviously enhanced photoelectrochemical response. And this response is stronger than the sum of the responses of the photoelectrochemical systems using individual dye. Furthermore, when the light wavelength is near the maximum absorption wavelength of RB (550 nm), the photocurrent of the rGO–Pt sensitized with EY can be hardly found (Fig. 6B). The photocurrent intensity of the rGO–Pt sensitized with RB is almost equal to that of the rGO–Pt cosensitized with ER. These phenomena imply that there exists the energy transfer from EY to RB in the mixed dye. As can be seen from Fig. S5, the emission decay curves of EY and RB show that the lifetimes of the emission ascribed to EY (551 nm) and the emission ascribed to RB (593 nm) are 0.54 μs and 0.51 μs, respectively. For ER, the lifetime of the emission ascribed to EY in the mixed dye (551 nm) decreased from 0.54 μs to 0.28 μs. This result clearly indicates that the fluorescence quenching observed from Fig. 5 belongs to dynamic quenching rather than static quenching,41,42 confirming that there exists energy transfer between EY and RB. However, the lifetime of the emission ascribed to RB in the mixed dye (593 nm) is 0.45 μs, which is roughly the same as that of the pure RB. One possible explanation is that the excitation wavelength is 475 nm so that most of the excitation light is absorbed by EY molecules. In other words, most of RB molecules are in the ground state. The energy transferred from EY to RB mainly makes the ground RB molecules excite rather than prolongs the lifetime of the excited RB molecules. As a result, the increased lifetime of the emission at 593 nm cannot be observed. In conclusion, these experimental results provide the additional evidences that the synergistic effect between EY and RB may originate from the energy transfer from EY to RB under irradiation.


image file: c5ra24178b-f6.tif
Fig. 6 (A) Transient photocurrent–time curves of rGO–5%Pt sensitized with EY (a), RB (b) and ER (1[thin space (1/6-em)]:[thin space (1/6-em)]1) (c) under irradiation of 520 nm; (B) transient photocurrent–time curves of rGO–5%Pt sensitized with EY (a), RB (b) and ER (1[thin space (1/6-em)]:[thin space (1/6-em)]1) (c) under irradiation of 550 nm (dye concentration: EY 1.5 × 10⁻⁴ mol L−1, RB 1.5 × 10⁻⁴ mol L−1, ER (1[thin space (1/6-em)]:[thin space (1/6-em)]1) 3 × 10⁻⁴ mol L−1; electrolytes: mixed aqueous solution containing TEOA (15 vol%) and Na2SO4 (0.1 mol L−1), pH 7).

3.3 Role of Pt nanoparticles in the photoelectrochemical process

The experimental results show that the Pt nanoparticles loaded on RGO play an important role in the photoelectrochemical process. As shown in Fig. 3C, the photoelectrochemical response of the rGO–Pt cosensitized with ER is much stronger than that of the RGO cosensitized with ER. And the synergistic effect between EY and RB cannot be found in the absence of Pt nanoparticles. It is well known that RGO carries negative charges. The strong electrostatic repulsion between RGO and EY molecules should weaken the interaction between EY molecules and RB molecules. In contrast, the interaction between RB molecules and RGO would become weak if the surface charges density of RGO is low. Therefore, either too much or too little surface charges are unfavorable to the production of photocurrent for the rGO–Pt cosensitized with ER. When Pt nanoparticles are loaded on RGO, it is preferential for the Pt nanoparticles to grow at the defects of RGO, which leads to the change of the surface charges density of RGO. The results shown in Fig. 4C and S6 may support our speculation. From Fig. 4C, it can be found that the UV-vis spectrum of the rGO–Pt cosensitized with ER is almost same as that of the RGO cosensitized with ER, the introduction of Pt nanoparticles does not lead to the change in the dye molecules orientation. In addition, the results obtained from the measurement of the zeta potentials of RGO and RGO loaded with Pt indicate that the zeta potentials of RGO are more negative than those of RGO loaded with Pt in the range of pH 3–10 (Fig. S6), suggesting that the surface charges density would decrease due to loading of the Pt nanoparticles. Based on the experimental results above, we can speculate that the positive effect of the Pt nanoparticles may be as follows: (1) improve the injection of electrons from the excited dye molecules due to their big work function; (2) adjust the surface charge of RGO so as to make the interaction among EY molecules, RB molecules and RGO become favorable to the energy transfer between EY and RB.

Moreover, the experimental results described below show that there exists some negative effect of Pt nanoparticles on the synergistic effect between EY and RB due to their plasma resonance, which will be discussed in Section 3.5.

3.4 Effect of pH on the synergistic effect between EY and RB

In order to evaluate the synergistic effect between EY and RB, a rough synergistic factor (SF) was chosen as the scale. SF was calculated using the eqn (1):
 
SF = [IER − (IEY + IRB)]/(IEY + IRB) × 100% (1)
Where IER is the photoelectrochemical response of rGO–Pt cosensitized with ER (m[thin space (1/6-em)]:[thin space (1/6-em)]n), IEY is the photoelectrochemical response of rGO–Pt sensitized with EY (m) and IRB is the photoelectrochemical response of rGO–Pt sensitized with RB (n). When SF is calculated, the total concentration of ER equal to the sum of the concentrations of individual dyes.

Fig. 7A shows the effect of pH value on SF. From Fig. 7A, it can be observed that the synergistic effect between EY and RB gradually increases with increasing pH from 5 to 7, and thereafter decreases with increasing pH. When pH is 5, there exists no synergistic effect between EY and RB. One possible explanation is that a portion of –COO might turn into –COOH with pH decreasing. Thus, the electrostatic interaction among EY molecules, RB molecules and RGO would be weakened, whether electrostatic repulsion or electrostatic attraction. This should cause decreasing of the cosensitization efficiency of the mixed dye. In weakly acidic condition, the synergistic effect between EY and RB even disappears. However, with pH increasing, the electrostatic repulsion between EY molecules and RGO would be also enhanced, although the electrostatic attraction between RB molecules and RGO would be enhanced. Therefore, when pH is higher than the optimal value, the synergistic effect between EY and RB would become weak.


image file: c5ra24178b-f7.tif
Fig. 7 (A) Effect of pH on SF of ER (1[thin space (1/6-em)]:[thin space (1/6-em)]1) over rGO–5%Pt (dye concentration: EY 5 × 10⁻⁵ mol L−1, RB 5 × 10⁻⁵ mol L−1, ER (1[thin space (1/6-em)]:[thin space (1/6-em)]1) 1 × 10⁻⁴ mol L−1; TEOA concentration: 15 vol%; Na2SO4 concentration 0.1 mol L−1). (B) Effect of the content of Pt on SF of ER (1[thin space (1/6-em)]:[thin space (1/6-em)]1) over rGO–x%Pt; (dye concentration: EY 5 × 10⁻⁵ mol L−1, RB 5 × 10⁻⁵ mol L−1, ER (1[thin space (1/6-em)]:[thin space (1/6-em)]1) 1 × 10⁻⁴ mol L−1; TEOA concentration: 15 vol%; Na2SO4 concentration 0.1 mol L−1; pH 7), (C) effect of the molar ratio of EY to RB on SF of ER (m[thin space (1/6-em)]:[thin space (1/6-em)]n) over rGO–5%Pt (dye concentration: EY m/(m + n) × 10−4 mol L−1, RB n/(m + n) × 10−4 mol L−1, ER 1 × 10⁻⁴ mol L−1; TEOA concentration: 15 vol%; Na2SO4 concentration 0.1 mol L−1; pH 7), (D) the effect of the total concentration of ER (1[thin space (1/6-em)]:[thin space (1/6-em)]1) on SF of ER (1[thin space (1/6-em)]:[thin space (1/6-em)]1) over rGO–5%Pt (TEOA concentration: 15 vol%; Na2SO4 concentration 0.1 mol L−1; pH 7).

3.5 Effect of the content of Pt on the synergistic effect between EY and RB

Fig. 7B shows the dependence of SF on the content of Pt. From Fig. 7B, it can be found that SF of the rGO–Pt cosensitized with ER increases with the content of Pt loaded increasing from 1% to 5%. However, when the content of Pt loaded is less than 3%, there exists no synergistic effect between EY and RB. SF of the rGO–1%Pt cosensitized with ER is even less than that of the RGO cosensitized with ER, implying that the introduction of Pt nanoparticles would lead to some negative effect on the synergistic effect between EY and RB. One possible explanation is that the size of the Pt nanoparticles may gradually increase with the content of Pt loaded increasing. Moreover, the results reported previously indicate that Pt nanoparticles exhibit relatively strong absorption due to the excitation of plasma resonance in the range of 400–600 nm, and this absorption decreases with the size of Pt nanoparticles increasing.43 Thus, the energy transfer between EY and RB may be disturbed when Pt nanoparticles are loaded on RGO. And the negative effect ascribed to the plasma resonance of Pt nanoparticles would decrease with the size of Pt nanoparticles increasing. On the other hand, the surface charge density of RGO would become lower when the content of Pt loaded increases, which is favorable to the energy transfer between EY and RB. Therefore, it is favorable to enhancement of the synergistic effect between EY and RB that the content of Pt loaded increases. However, if the content of Pt loaded is too much, the surface charge density of RGO may become too low so that the interaction between RB molecules and RGO would be weakened. In addition, the efficient contact between the Pt nanoparticles and RGO would be reduced due to growth and aggregation of the Pt nanoparticles. As a result, SF of the rGO–Pt cosensitized with ER slightly decreases when the content of Pt loaded increases from 5% to 10%.

3.6 Effect of the molar ratio of EY to RB on the synergistic effect between EY and RB

Fig. 7C shows the effect of the molar ratio of EY to RB on SF. From Fig. 7C, we can observe that, at beginning, the synergistic effect between EY and RB becomes stronger with the content of RB increasing. When the molar ratio of EY to RB is 1[thin space (1/6-em)]:[thin space (1/6-em)]1, the RGO cosensitized with ER exhibits the strongest synergistic effect between EY and RB. Thereafter, the synergistic effect between EY and RB is weakened with the content of RB increasing. Moreover, if the molar ratio of EY to RB is 4[thin space (1/6-em)]:[thin space (1/6-em)]1 or 1[thin space (1/6-em)]:[thin space (1/6-em)]4, the synergistic effect between EY and RB cannot be found. As discussed above, the synergistic effect between EY and RB may originate from the energy transfer between EY molecules and RB molecules. Decreasing the content of EY means that the number of the energy donors decreases. Similarly, decreasing the content of RB means that the number of the energy acceptors decreases. Moreover, due to competitive adsorption, too much EY will restrain the adsorption of RB on RGO so that the energy transfer between EY and RB cannot efficiently occur. Likewise, the energy transfer between EY and RB cannot efficiently occur too when RB is too much. Therefore, the synergistic effect between EY and RB is not significant unless the molar ratio of EY to RB is suitable. And, both too much RB and too much EY would cause disappearance of the synergistic effect between EY and RB.

3.7 Effect of the total concentration of ER on the synergistic effect between EY and RB

Fig. 7D shows the effect of the total concentration of ER on SF. As can be seen from Fig. 7D, the synergistic effect between EY and RB considerably depends on the total concentration of ER. When the total concentration of ER is 3 × 10⁻⁴ mol L−1, the RGO cosensitized with ER exhibits the strongest synergistic effect between EY and RB. Both relatively low concentration and high concentration make the synergistic effect between EY and RB weaker. Because of the large surface area of RGO, it can be deduced that the contact between the dye molecules absorbed on rGO–Pt might be not efficient when the total concentration of ER is relatively low. On the other hand, if the total concentration of ER is relatively high, multi-layer adsorption or aggregation of ER might occur on rGO–Pt, which is unfavorable to the energy transfer between EY and RB. Therefore, a suitable total concentration of ER is required in order to achieve strong synergistic effect between EY and RB on rGO–Pt.

4. Conclusions

In summary, there exists significant synergistic effect between EY and RB on rGO–Pt. This synergistic effect may be ascribed to the energy transfer between EY and RB. Moreover, the Pt nanoparticles loaded on RGO play an important role in the photoelectrochemical process. Here, the positive effects of the Pt nanoparticles include improvement of the injection of electrons from the excited dye molecules and adjustment of the surface charge of RGO. The negative effect is mainly the interference on the energy transfer between EY and RB due to plasma resonance. These results provide us with some enlightenment for designing an efficient photocatalyst. Further efforts are currently being undertaken.

Acknowledgements

This work was financially supported by the Open Project of Bejing National Laboratory for Molecular Sciences (No. 20140163) and the National Natural Science Foundation of China (No. 21301118).

References

  1. Y. Hou, R. Vidu and P. Stroeve, Ind. Eng. Chem. Res., 2011, 50, 8954–8964 CrossRef CAS.
  2. N. Shibayama, H. Ozawa, M. Abe, Y. Ooyama and H. Arakawa, Chem. Commun., 2014, 50, 6398–6401 RSC.
  3. T. Tabata, N. Nishida, Y. Masaki and K. Tabata, Catal. Lett., 1995, 34, 245–249 CrossRef.
  4. K. Sayama and H. Arakawa, J. Phys. Chem., 1993, 97, 531–533 CrossRef CAS.
  5. S. Kushwaha and L. Bahadur, J. Lumin., 2015, 161, 426–430 CrossRef CAS.
  6. K. Domen, A. Kudo and T. Onishi, J. Catal., 1986, 102, 92–98 CrossRef CAS.
  7. K. Sayama and H. J. Arakawa, J. Photochem. Photobiol., A, 1994, 77, 243–247 CrossRef CAS.
  8. B. S. Geoffey and E. M. Thoms, J. Phys. Chem. B, 1997, 101, 2508–2513 CrossRef.
  9. A. Kudo, H. Kato and S. Nakagawa, J. Phys. Chem. B, 2000, 104, 571–575 CrossRef CAS.
  10. H. Kato and A. Kudo, J. Phys. Chem. B, 2001, 105, 4285–4292 CrossRef CAS.
  11. Q. Li, Z. Jin, Z. Peng, Y. Li, S. Li and G. Lu, J. Phys. Chem. C, 2007, 111, 8237–8241 CAS.
  12. R. Stalder, D. Xie, A. Islam, L. Han, J. R. Reynolds and K. S. Schanze, ACS Appl. Mater. Interfaces, 2014, 6, 8715–8722 CAS.
  13. G. D. Sharma, G. E. Zervaki, P. A. Angaridis, A. Vatikioti, K. S. V. Gupta, T. Gayathri, P. Nagarjuna, S. P. Singh, M. Chandrasekharam, A. Banthiya, K. Bhanuprakash, A. Petrou and A. G. Coutsolelos, Org. Electron., 2014, 15, 1324–1337 CrossRef CAS.
  14. H. Ozawa, R. Shimizu and H. Arakawa, RSC Adv., 2012, 2, 3198–3200 RSC.
  15. B. E. Hardin, A. Selinger, T. Moehl, R. Humphry-Baker, J. E. Moser, P. Wang, S. M. Zakeeruddin, M. Gratzel and M. D. McGehee, J. Am. Chem. Soc., 2011, 133, 10662–10667 CrossRef CAS.
  16. S. Min and G. Lu, Int. J. Hydrogen Energy, 2012, 37, 10564–10574 CrossRef CAS.
  17. X. Zhang, B. Peng, T. Peng, L. Yu, R. Li and J. Zhang, J. Power Sources, 2015, 298, 30–37 CrossRef CAS.
  18. P. Baviskar, A. Ennaoui and B. Sankapal, Sol. Energy, 2014, 105, 445–454 CrossRef CAS.
  19. S. Peng, X. Zeng and Y. Li, Int. J. Hydrogen Energy, 2015, 40, 6038–6049 CrossRef CAS.
  20. S. B. Jambure, G. S. Gund, D. P. Dubal, S. S. Shinde and C. D. Lokhande, Electron. Mater. Lett., 2014, 10, 943–950 CrossRef CAS.
  21. Z. Yin, J. Zhu, Q. He, X. Cao, C. Tan, H. Chen, Q. Yan and H. Zhang, Adv. Energy Mater., 2014, 4, 1300574–1300592 Search PubMed.
  22. G. S. Selopal, R. Milan, L. Ortolani, V. Morandi, R. Rizzoli, G. Sberveglieri, G. P. Veronese, A. Vomiero and I. Concina, Sol. Energy Mater. Sol. Cells, 2015, 135, 99–105 CrossRef CAS.
  23. Q. Xiang, J. Yu and M. Jaroniec, Chem. Soc. Rev., 2012, 41, 782–796 RSC.
  24. X. Cao, G. Tian, Y. Chen, J. Zhou, W. Zhou, C. Tiana and H. Fu, J. Mater. Chem. A, 2014, 2, 4366–4374 CAS.
  25. C. Kong, S. Min and G. Lu, ACS Catal., 2014, 4, 2763–2769 CrossRef CAS.
  26. M. Zhu, Z. Li, B. Xiao, Y. Lu, Y. Du, P. Yang and X. Wang, ACS Appl. Mater. Interfaces, 2013, 5, 1732–1740 CAS.
  27. A. Wojcik and P. V. Kamat, ACS Nano, 2010, 4, 6697–6706 CrossRef CAS PubMed.
  28. Y. J. Guo, S. J. Guo, J. T. Ren, Y. M. Zhai, S. J. Dong and E. K. Wang, ACS Nano, 2010, 4, 4001–4010 CrossRef CAS PubMed.
  29. P. K. Ang, S. Wang, Q. L. Bao, J. T. L. Thong and K. P. Loh, ACS Nano, 2009, 3, 3587–3594 CrossRef CAS PubMed.
  30. C. B. Gong, C. C. Guo, D. Jiang, Q. Tang, C. H. Liu and X. B. Ma, Mater. Sci. Eng., C, 2014, 39, 281–287 CrossRef CAS PubMed.
  31. T. Zhang, X. Li, S.-Z. Kang, L. Qin, G. Li and J. Mu, J. Mater. Chem. A, 2014, 2, 2952–2959 CAS.
  32. Z. Li, Q. Wang, C. Kong, Y. Wu, Y. Li and G. Lu, J. Phys. Chem. C, 2015, 119, 13561–13568 CAS.
  33. H. Chen, Z. Rui and H. Ji, Ind. Eng. Chem. Res., 2014, 53, 7629–7636 CrossRef CAS.
  34. J. Liu, X. Bo, Z. Zhao and L. Guo, Biosens. Bioelectron., 2015, 74, 71–77 CrossRef CAS PubMed.
  35. J. Moser and M. Gratzel, J. Am. Chem. Soc., 1984, 106, 6557–6564 CrossRef CAS.
  36. S. De, S. Das and A. Girigoswami, Spectrochim. Acta, Part A, 2005, 61, 1821–1833 CrossRef.
  37. G. D. Sharma, S. P. Singh, R. Kurchania and R. J. Ball, RSC Adv., 2013, 3, 6036–6043 RSC.
  38. Y. Liu, C. Liu and Y. Liu, Appl. Surf. Sci., 2011, 257, 5513–5521 CrossRef CAS.
  39. Y. Lin, K. Zhang, W. Chen, Y. Liu, Z. Geng, J. Zeng, N. Pan, L. Yan, X. Wang and J. G. Hou, ACS Nano, 2010, 4, 3033–3038 CrossRef CAS PubMed.
  40. G. D. Sharma, P. Balraju, M. Kumar and M. S. Roy, Mater. Sci. Eng., B, 2009, 162, 32–39 CrossRef CAS.
  41. L. Feng, J. Sha, Y. He, S. Chen, B. Liu, H. Zhang and C. Lu, Microporous Mesoporous Mater., 2015, 208, 113–119 CrossRef CAS.
  42. A. Archut, G. C. Azzellini, V. Balzani, L. D. Cola and F. Vogtle, J. Am. Chem. Soc., 1998, 120, 12187–12191 CrossRef CAS.
  43. P. S. Roy and S. K. Bhattacharya, Catal. Sci. Technol., 2013, 3, 1314–1323 CAS.

Footnote

Electronic supplementary information (ESI) available. See DOI: 10.1039/c5ra24178b

This journal is © The Royal Society of Chemistry 2015
Click here to see how this site uses Cookies. View our privacy policy here.