Food-grade nanoparticles for encapsulation, protection and delivery of curcumin: comparison of lipid, protein, and phospholipid nanoparticles under simulated gastrointestinal conditions

Liqiang Zoua, Bingjing Zhengb, Ruojie Zhangb, Zipei Zhangb, Wei Liu *a, Chengmei Liua, Hang Xiaob and David Julian McClements*bc
aState Key Laboratory of Food Science and Technology, Nanchang University, Nanchang, No. 235 Nanjing East Road, Nanchang 330047, Jiangxi, China. E-mail: liuwei@ncu.edu.cn; Fax: +86 791 88334509; Tel: +86 791 88305872 ext. 8106
bDepartment of Food Science, University of Massachusetts, Amherst, MA 01003, USA. E-mail: mcclements@foodsci.umass.edu; Fax: +1 413 545 1262; Tel: +1 413 545 1019
cDepartment of Biochemistry, Faculty of Science, King Abdulaziz University, P. O. Box 80203, Jeddah 21589, Saudi Arabia

Received 30th October 2015 , Accepted 16th December 2015

First published on 22nd December 2015


Abstract

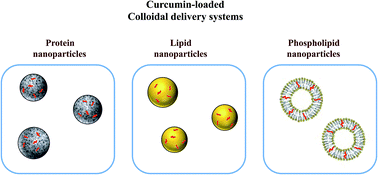
The potential of three nanoparticle-based delivery systems to improve curcumin bioavailability was investigated: lipid nPs (nanoemulsions); protein nPs (zein nanosuspensions); and, phospholipid nPs (nanoliposomes). All three nanoparticle types were fabricated from food-grade constituents, had small mean diameters (d < 200 nm), and had monomodal particle size distributions. The loading capacity of curcumin depended strongly on nanoparticle composition: protein nPs (11.7%); phospholipid nPs (3.1%); lipid nPs (0.40%). The curcumin-loaded nanoparticles were passed through a simulated gastrointestinal tract (GIT) consisting of mouth, stomach, and small intestine phases, and curcumin bioaccessibility and degradation were measured. Nanoparticle composition influenced their ability to protect curcumin from chemical degradation (lipid nPs ≈ protein nPs > phospholipid nPs) and to increase their solubilization within intestinal fluids (lipid nPs > phospholipid nPs > protein nPs). This latter effect was attributed to the enhanced solubilization capacity of the mixed micelle phase formed after digestion of the lipid nanoparticles. Overall, the lipid nanoparticles (nanoemulsions) appeared to be the most effective at increasing the amount of curcumin available for absorption (at an equal initial curcumin level). This study shows that different types of nanoparticles have different advantages and disadvantages for encapsulating, protecting, and releasing curcumin. This research will facilitate the rational selection of food-grade colloidal delivery systems designed to enhance the oral bioavailability of hydrophobic nutraceuticals.
1. Introduction

There has been growing interest in the utilization of edible nanoparticles to encapsulate hydrophobic bioactive molecules intended for oral delivery, such as vitamins, nutrients, and nutraceuticals.1–3 These nanoparticle-based delivery systems offer certain advantages over other types of delivery systems, including higher optical clarity, greater stability to aggregation and gravitational separation, and enhanced bioavailability.4,5 High optical clarity is achieved when the nanoparticles have dimensions appreciably lower than the wavelength of light (d < λ/10).6 Good aggregation stability is due to the fact that the attractive forces between colloidal particles decrease more rapidly than the repulsive interactions with decreasing particle size.7 Nanoparticles tend to have good stability to creaming or sedimentation because the gravitational forces acting on them are relatively weak, and may be balanced by Brownian motion.7,8 An enhancement in bioavailability of encapsulated bioactive components may occur because small particles are hydrolyzed more rapidly than larger ones by digestive enzymes in the gastrointestinal tract (GIT).9

Edible nanoparticles can be fabricated from various kinds of food components, including surfactants, phospholipids, lipids, proteins, and/or carbohydrates.2,3,9–12 The nature of the food components used to assemble a nanoparticle usually dictates the type of fabrication methods that can be used to produce it. In turn, the composition of a nanoparticle determines the physicochemical properties, functional attributes, and gastrointestinal fate of nanoparticle-based delivery systems. Consequently, it is important to be able to identify the most suitable nanoparticle type for a particular application. Ideally, the nanoparticles should be fabricated using simple, reproducible, and inexpensive methods that can easily be scaled up for commercial applications. In addition, it would be advantageous if the nanoparticles could be assembled from label-friendly ingredients, such as natural proteins, phospholipids, and lipids. Moreover, the nanoparticles should have the functional attributes required for the particular application, which will depend on the nature of the bioactive to be encapsulated, as well as on the nature of the food or beverage that the nanoparticles will be utilized in.

The objective of this research was to fabricate three different kinds of edible nanoparticle-based delivery system, and then compare their ability to encapsulate, protect, and release an important bioactive agent (curcumin). The term curcumin is typically used to refer to a group of highly hydrophobic molecules found in the spice turmeric, with the three most prevalent forms being curcumin, demethoxycurcumin, and bis-demethoxycurcumin.13 Curcumin has been shown to exhibit a broad range of potentially beneficial effects on human health and to have low toxicity, which makes it particularly suitable as a nutraceutical or pharmaceutical.14 However, there are a number of practical challenges associated with incorporating curcumin into food products, including its poor water-solubility, its high susceptibility to chemical/biochemical degradation, and its low oral bioavailability.13 Consequently, there is a need to develop suitable delivery systems to overcome these challenges.15,16 In this study, protein nanoparticles were fabricated from a hydrophobic protein (zein) using an antisolvent precipitation method.17 Lipid nanoparticles (nanoemulsions) were fabricated by homogenizing oil and water phases together in the presence of an emulsifier using a microfluidizer.18 Phospholipid nanoparticles (nanoliposomes) were fabricated by homogenizing lecithin and water phases together.19 These three different types of nanoparticles were selected for a number of reasons: they have all previously been shown to be capable of encapsulating hydrophobic nutraceuticals; they are all food grade; they all have potential for commercial application; and, they represent three distinctly different classes of nanoparticles.

A major aim of this study was to elucidate the physicochemical phenomena underlying the ability of these different types of nanoparticles to encapsulate, protect, and release curcumin. This information could then be used to establish their relative advantages and disadvantages as colloidal delivery systems for particular applications. Each of the curcumin-enriched nanoparticle suspensions was passed through a simulated GIT, and changes in the physicochemical and structural properties of the delivery systems were measured. In addition, the influence of nanoparticle carrier material on the chemical transformation and bioaccessibility of the curcumin was determined. The results of this research should therefore provide useful information that can be used to select the most appropriate food-grade colloidal delivery system for a particular application.

2. Materials and methods

2.1. Materials

Corn oil purchased from a local supermarket was used as an example of a digestible long chain triglyceride (LCT). The phospholipid (90G) was provided by Lipoid GmbH (Ludwigshafen, Germany), which was reported to contain 96.6% phosphatidylcholine by the manufacturer. The hydrophobic protein zein (Lot SLBD5665V) was purchased from Sigma-Aldrich (St. Louis, MO, USA). The following chemicals were also purchased from the Sigma Chemical Company: curcumin (SLBH2403V), mucin from porcine stomach (SLBH9969V), pepsin from porcine gastric mucosa (SLBL1993V), lipase from porcine pancreas pancreatin (SLBH6427V), porcine bile extract (SLBK9078), Tween 80 (BCBG4438V), and Nile Red (063K3730V). All other chemicals were of analytical grade. Double distilled water was used to prepare all solutions and nanoparticle suspensions.

2.2. Fabrication of edible nanoparticles

2.2.1. Lipid nanoparticles. Curcumin-loaded lipid nanoparticles were formed by homogenizing aqueous and oil phases together using a microfluidizer.18 An aqueous phase was prepared by mixing 1% (w/w) Tween 80 (a food-grade non-ionic surfactant) with an aqueous buffer solution (5.0 mM phosphate buffer saline (PBS), pH 6.5) and stirring for at least 2 h. The oil phase consisted of varying amounts of curcumin dissolved in corn oil. Then, 10% (w/w) oil phase and 90% (w/w) aqueous phase were blended together using a high-shear mixer for 2 min (M133/1281-0, Biospec Products, Inc., ESGC, Switzerland) to form a coarse emulsion. Nanoemulsions were then prepared by passing the coarse emulsion three times through a microfluidizer (M110Y, Microfluidics, Newton, MA) with a 75 μm interaction chamber (F20Y) at an operational pressure of 12[thin space (1/6-em)]000 psi.
2.2.2. Protein nanoparticles. Curcumin-loaded protein nanoparticles were fabricated from zein using an antisolvent precipitation method.17 Initially, curcumin and zein (26.4 mg mL−1) were dissolved in ethanol solution (80% v/v) at different mass ratios. Then, 25 mL of aqueous ethanol solution was rapidly injected into 75 mL of Tween 80 solution (PBS, pH = 4.0) that was continuously stirred at 1200 rpm using a magnetic stirrer (IKA R05, Werke, GmbH). The resulting colloidal dispersion was then stirred for another 30 min at the same speed. The ethanol remaining in the final colloidal dispersions was evaporated using a rotary evaporator (Rotavapor R110, Büchi Crop., Switzerland), and the same volume of pH 4.0 PBS was added to compensate for the lost ethanol.
2.2.3. Phospholipid nanoparticles. Curcumin-loaded phospholipid nanoparticles were formed using an ethanol injection-microfluidizer method described previously.19 Phospholipid (14 mg mL−1) and curcumin were mixed in different mass ratios. The mixture was then dissolved in 50 mL anhydrous ethanol and quickly injected into the same volume of PBS solution (pH 6.5, 0.05 M). The resulting mixture was stirred vigorously for half an hour, resulting in the formation of a milky dispersion due to liposome formation. This dispersion was then transferred to a rotary evaporator maintained at 45 °C using a water bath, and then the ethanol was removed under reduced pressure. The curcumin-loaded liposomes obtained by the ethanol injection method were then passed through a microfluidizer (M110Y, Microfluidics, Newton, MA) with a 75 μm interaction chamber (F20Y) at an operational pressure of 12[thin space (1/6-em)]000 psi.
2.2.4. Nanoparticle compositions. For the determination of the curcumin loading capacity a series of nanoparticles was prepared with different curcumin levels. For the remainder of the experiments, the nanoparticle-based delivery systems were prepared so that they all contained the same initial curcumin concentration (0.3 mg mL−1). Due to the fact that the loading capacities of the different nanoparticles varied, this meant that the delivery systems had to be formulated to contain different amounts of carrier material inside the particles. Hence, the final levels of carrier materials in the three different delivery systems were 6.6 mg mL−1 for protein, 100 mg mL−1 for lipid, and 14 mg mL−1 for phospholipid.

2.3. Determination of curcumin loading capacity

The maximum amount of curcumin that could be loaded into the different nanoparticle systems was characterized by measuring the loading capacity:
 
LC = 100 × mC/mT (1)
here, mC is the maximum mass of curcumin than can be loaded into the nanoparticles, and mT is the total mass of the nanoparticles (curcumin + wall material). The loading capacity was determined by preparing a series of delivery systems containing increasing amounts of curcumin: 0.3, 0.35, 0.4, 0.45 mg mL−1 for lipid nPs; 0.5, 0.75, and 1 mg mL−1 for phospholipid nPs; 0.5, 0.75, 1, 1.25 mg mL−1 for protein nPs. The concentration of curcumin encapsulated in a delivery system was then measured used a UV-visible spectrophotometer method based on one described previously.18 10 mL of sample was collected, and then centrifuged at 4000 rpm for 30 min at ambient temperature (CL10 centrifuge, Thermo, Scientific, Pittsburgh, PA, USA) to remove any non-encapsulated curcumin. 1 mL of the resultant supernatant was then mixed with 5 mL of chloroform, vortexed, and then centrifuged at 1750 rpm (≈940 × g) for 10 min at ambient temperature. The bottom layer containing the solubilized curcumin was collected, while the top layer was mixed with an additional 5 mL of chloroform and the same procedure was repeated. The two bottom chloroform layers were combined, and diluted to an appropriate concentration to be analyzed by a UV-visible spectrophotometer at a wavelength of 419 nm (Ultraspec 3000 pro, GE Health Sciences, USA). The concentration of curcumin extracted from each nanoparticle-dispersion was calculated from a calibration curve of absorbance versus curcumin concentration in chloroform.

2.4. Color analysis of nanoparticle suspensions

The influence of the nanoparticles on the optical properties of the delivery systems was determined by measuring their color. The three different types of nanoparticle delivery systems were prepared so that the final curcumin concentration in each of them was similar (0.3 mg mL−1). The color coordinates of the curcumin-loaded delivery systems were then characterized using an instrumental colorimeter (ColorFlex EZ 45/0-LAV, Hunter Associates Laboratory Inc., Virginia, USA). Color was expressed in CIE units as L* (lightness/darkness), a* (redness/greenness), and b* (yellowness/blueness). An aliquot of sample (15 mL) was placed in a 64 mm path length glass sample cup and then illuminated with D65-artificial daylight (10° standard angle). Three replicate measurements were performed and the results were averaged.

2.5. Particle characterization

The particle size distribution of the curcumin-loaded delivery systems was determined using both static light scattering (SLS) and dynamic light scattering (DLS) to cover the wide particle range that occurred.

For the SLS measurements, samples were diluted with appropriate buffer solutions (same pH as sample) and then stirred in the dispersion cell of the instrument at a speed of 1200 rpm to ensure homogeneity. Information about the particle size was then obtained by analyzing the light scattering pattern (Mastersizer 2000, Malvern Instruments Ltd, Worcestershire, UK). The data is reported as the full particle size distribution or as the surface-weighted (d32) and volume-weighted (d43) mean diameter calculated from this distribution. The electrical charge (ζ-potential) of the particles in the samples was measured using a micro-electrophoresis instrument (Nano-ZS, Malvern Instruments, Worcestershire, UK). Samples were diluted with appropriate buffer solutions (same pH as sample) prior to measurements to avoid multiple scattering effects.

The mean particle diameter (Z-average) and electrical charge (ζ-potential) of the particles in the mixed micelle phase collected by centrifugation of the digesta was determined by a combined dynamic light scattering/micro-electrophoresis instrument (Nano-ZS, Malvern Instruments, Worcestershire, UK). The mixed micelle phase was diluted with buffer solution (5 mM PBS, pH 7.0) prior to measurements to avoid multiple scattering effects.

2.6. Microstructural analysis

The microstructure of the various samples was characterized using confocal scanning fluorescence microscopy (Nikon D-Eclipse C1 80i, Nikon, Melville, NY). Prior to analysis the samples were dyed with Nile Red (0.1%) to highlight the location of the non-polar lipid regions. All images were captured with a 10× eyepiece and a 60× objective lens (oil immersion).

2.7. Simulated gastrointestinal digestion

The potential gastrointestinal fate of the three different types of nanoparticle-based delivery systems was analyzed by passing them through an in vitro GIT model that consisted of mouth, stomach, and small intestine phases, which was slightly modified from our previous study.20 All solutions and samples were incubated at 37 °C prior to use, and maintained at this temperature throughout the GIT model.
2.7.1. Initial system. The initial samples (which all contained the same curcumin concentration) were placed into a glass beaker in a temperature-controlled shaker (Innova Incubator Shaker, Model 4080, New Brunswick Scientific, New Jersey, USA).
2.7.2. Mouth phase. A simulated saliva fluid (SSF) containing 3 mg mL−1 mucin and various salts was prepared, and then mixed with the sample being tested at a 1[thin space (1/6-em)]:[thin space (1/6-em)]1 mass ratio. The resulting mixtures were then adjusted to pH 6.8 and placed in a shaking incubator at 90 rpm for 10 min to mimic oral conditions.
2.7.3. Stomach phase. Simulated gastric fluid (SGF) was prepared by placing 2 g NaCl and 7 mL HCl into a container, and then adding double distilled water to 1 L. The bolus sample from the mouth phase was then mixed with SGF containing 0.0032 g mL−1 pepsin preheated to 37 °C at a 1[thin space (1/6-em)]:[thin space (1/6-em)]1 mass ratio. The mixture was then adjusted to pH 2.5 and placed in a shaker at 100 rpm for 2 hours to mimic stomach digestion.
2.7.4. Small intestine phase. 30 mL chyme samples from the stomach phase were diluted with 30 mL buffer solution (10 mM PBS, 6.5). The diluted chyme was then incubated in a water bath for 10 min and then the solution was adjusted back to pH 7.0. Next, 3 mL of simulated intestinal fluid (containing 0.5 M CaCl2 and 7.5 M NaCl) was added to 60 mL digesta. Then, 7 mL bile extract, containing 375.0 mg bile extract (pH 7.0, PBS), was added with stirring and the pH was adjusted to 7.0. Finally, 5 mL of lipase suspension, containing 120 mg of lipase (pH 7.0, PBS), was added to the sample and an automatic titration unit (Metrohm, USA Inc.) was used to monitor the pH and control it to a fixed value (pH 7.0) by titrating 0.05 M NaOH (for protein and phospholipid nanoparticles) or 0.25 M NaOH (for lipid nanoparticles) solutions into the reaction vessel for 2 h.

The static GIT model used in this study cannot accurately mimic the complex physicochemical events and physiological environments experienced by foods within the human gastrointestinal tract. Nevertheless, this type of method is useful for identifying key physicochemical phenomena that may occur within the GIT, as well as for rapidly screening samples with different compositions or structures. Once suitable candidates have been identified, then they should be further tested using animal or human feeding studies.

2.8. Curcumin concentration and bioaccessibility after digestion

After in vitro digestion, 20 mL raw digesta of each mixture was centrifuged (18[thin space (1/6-em)]000 rpm, ≈[thin space (1/6-em)]38[thin space (1/6-em)]465 × g, Thermo Scientific, Waltham, MA, USA) at 25 °C for 30 min. The clear supernatant was collected and assumed to be the “micelle” fraction in which the curcumin was solubilized. In some samples, a layer of non-digested oil was observed at the top of the test tubes and it was excluded from the micelle fraction. Aliquots of 5 mL of raw digesta or micelle fraction were mixed with 5 mL of chloroform, vortexed and centrifuged at 1750 rpm (≈940 × g) for 10 min at ambient temperature. The bottom layer containing the solubilized curcumin was collected, while the top layer was mixed with an additional 5 mL of chloroform and the same procedure was repeated. The two collected chloroform layers were mixed together, and then diluted to an appropriate concentration to be analyzed by a UV-visible spectrophotometer at 419 nm. The curcumin concentrations in the overall digesta and in the mixed micelle phase were calculated from the absorbance using a standard curve.

The transformation and bioaccessibility of the curcumin were then calculated from this data using the following equations:

 
Transformation = 100 × (Cdigesta/Cinitial) (2)
 
Bioaccessibility = 100 × (Cmicelle/Cdigesta) (3)

Here, Cmicelle and Cdigesta are the concentrations of curcumin in the mixed micelle fraction and in the overall digesta after the pH-stat experiment, respectively. The transformation provides an indication of the amount of curcumin that is not chemically/biochemically degraded during passage throughout the GIT, whereas the bioaccessibility gives an indication of the fraction of curcumin reaching the small intestine that is solubilized within the micelle phase and therefore available for absorption.

It should be noted that the centrifugation method used in this study is intended to separate mixed micelles (and any solubilized bioactive components) from other particulate matter in the digesta. In principle, sufficiently small and stable nanoparticles may not be separated from the mixed micelle phase by centrifugation. However, this should not be a problem in this work because the lipid and protein nanoparticles should be fully digested, while the phospholipid nanoparticles should be dissembled and incorporated into the mixed micelle phase.

2.9. Statistical analysis

All experiments were carried out on two or three freshly prepared samples. The results are expressed as means ± standard deviations (SD). Data were subjected to statistical analysis using SPSS software (version 18.0). Means were subject to Duncan's test and a P-value of <0.05 was considered statistically significant.

3. Results and discussion

3.1. Properties of initial nanoparticle delivery systems

Initially, we compared the characteristics of the three different types of nanoparticle-based delivery systems after they have been prepared. The three fabrication methods used all led to the production of stable colloidal dispersions that contained relatively small particles. Dynamic light scattering measurements indicated that all three colloidal dispersions had relatively narrow monomodal particle size distributions (PDI < 0.35) and contained relatively small particles: d = 192, 153, and 89 nm for lipid-, protein-, and phospholipid-nPs, respectively (Table 1, Fig. 1a). However, there was a discrepancy between the mean particle sizes determined by static and dynamic light scattering instruments. DLS measurements indicated that the phospholipid-nPs were appreciably smaller than the protein- or lipid-nPs, whereas SLS measurements suggested that the phospholipid- and protein-nPs had similar dimensions (Table 1). This discrepancy probably occurred because the SLS instrument is not sensitive to small particles (d < 100 nm), and may therefore not have provided accurate measurements for the phospholipid-nPs. This observation highlights the importance of using an appropriate particle sizing technology to analyze the particles in colloidal dispersions. It should be noted that for each type of nanoparticle used it is possible to produce different particle size distributions by altering the preparation conditions.
Table 1 The loading capacity, mean droplet diameters (Z-average, d32, d43), ζ-potential, and tristimulus color coordinates of protein, phospholipid and lipid nanoparticle suspensions was measured. Samples designated with different letters (a, b, c) were significantly different (Duncan, p < 0.05)
  Protein Phospholipid Lipid
Loading capacity (w/w) 11.7 ± 0.8% c 3.1 ± 0.3%b 0.4 ± 0.0%a
ζ-Potential (mV) 20.4 ± 1.5b −5.2 ± 3.3a −6.5 ± 0.7a
Z-Average (nm) 153 ± 5b 89 ± 30a 192 ± 12c
PDI 0.23 ± 0.04a 0.32 ± 0.10a 0.200 ± 0.04a
d32 (nm) 99 ± 2a 99 ± 1a 168 ± 17b
d43 (nm) 124 ± 3a 124 ± 1a 241 ± 12b
L 52.2 ± 4.2b 34.4 ± 0.5a 91.8 ± 0.0c
a −14.0 ± 1.8b −20.2 ± 0.1a −12.9 ± 0.0b
b 69.8 ± 3.1b 43.9 ± 0.6a 77.4 ± 0.0c


image file: c5ra22834d-f1.tif
Fig. 1 (a). Particle size distributions of curcumin-loaded nanoparticle dispersions: lipid, phospholipid, and protein nanoparticles. (b) Photographs of curcumin-loaded nanoparticle dispersions after preparation: lipid, phospholipid, and protein nanoparticles. (c) Microstructure of curcumin-loaded nanoparticle dispersions measured using a confocal fluorescence microscope: lipid, phospholipid, and protein nanoparticles. The protein phase is stained green, whereas the lipid phase is stained red (see on-line color version).

Visual observation of the colloidal dispersions indicated that they had distinctly different appearances (Fig. 1b). The dispersion containing phospholipid-nPs appeared to be relatively clear, the one containing protein-nPs was only slightly turbid, and the one containing lipid-nPs was cloudy. The visual observations were supported by instrumental colorimetry measurements, which indicated that the lightness (L) and yellow color (b+) of the different systems followed the order: lipid nPs > protein nPs > phospholipid nPs. These differences in optical properties can be attributed to differences in the light scattering patterns of the different colloidal dispersions, which depend on particle concentration, size, and refractive index.6,21 Even though the concentration of curcumin was the same in each of the systems, the concentration of nanoparticles was different because of their different loading capacities (see later). The concentration of nPs in the system decreased in the following order: lipid (100 mg mL−1) ≫ phospholipid (14 mg mL−1) > protein (6.6 mg mL−1). The relatively high opacity of the suspension of lipid nanoparticles may therefore be attributed to the fact that it had a high particle concentration, and so there was greater light scattering. On the other hand, the high optical clarity of the suspension of phospholipid nPs is probably because it contained particles that were much smaller than those in the other two systems. For certain applications it is important that functional food products are optically transparent, such as many soft drinks and fortified waters. In these cases, it may be more advantageous to use phospholipid nanoparticles than other types.

Confocal microscopy images indicated that the nanoparticles in the three colloidal dispersions were evenly distributed throughout the samples, i.e., there was no evidence of extensive particle aggregation (Fig. 1c). Previous electron microscopy characterization of nanoparticles produced using similar fabrication methods as the ones used in this study have shown that the lipid-based,22 protein-based,23 and phospholipid-based24 nanoparticles.

Measurements of the electrical characteristics of the nanoparticles indicated that they varied considerably depending on their compositions (Table 1). The protein-nPs initially had a strong positive charge (+20.4 mV) because the pH of the solution (pH 4) used during their preparation was well below the isoelectric point of the zein (pI ≈ 6.2).25 The phospholipid- and lipid-nPs both had fairly low negative charges (−5 to −7 mV, pH 6.5). The low charge on the lipid nanoparticles is to be expected because they were coated by a non-ionic surfactant. The low charge on the phospholipids may have been due to the nature of their head groups. It is known that there are appreciable differences between the electrical characteristics of phospholipids from different sources depending on head group type.26

The loading capacity of the different types of nanoparticles was also determined (Table 1). An appreciably higher amount of curcumin could be successfully incorporated into the protein-nPs (11.7%), than the phospholipid-nPs (3.1%), or the lipid-nPs (0.4%). Curcumin is a relatively hydrophobic molecule, but it does have some polar groups also, including multiple alcohol and carbonyl groups.13 Consequently, it may dissolve better in an environment that contains a mixture of polar and non-polar regions (proteins and phospholipids), rather than only non-polar regions (lipids). This result means that to reach the same curcumin level in a functional food product a much higher amount of lipid or phospholipid would be required to fabricate nanoparticle delivery systems than protein. The utilization of higher nanoparticle concentrations may impact the cost, physicochemical properties, and sensory attributes of a food product (such as appearance, texture, or mouthfeel). This factor should therefore be taken into account when developing a suitable nanoparticle-based delivery system for a particular application.

3.2. Gastrointestinal fate of different nanoparticles

After preparation, the nanoparticle-based delivery systems were passed through a simulated GIT that included mouth, stomach, and small intestine phases. This relatively simple static GIT model was based on recent attempts to standardize methods so that results could be compared between different research groups.27,28 Changes in particle size, structural organization, and charge were recorded to provide some insight into the behavior of the different types of nanoparticles under GIT conditions (Fig. 2–5).
image file: c5ra22834d-f2.tif
Fig. 2 Influence of simulated gastrointestinal conditions on the mean droplet diameter (d32) of curcumin-loaded nanoparticle dispersions: lipid, phospholipid, and protein nanoparticles. Different lowercase letters mean significant differences (p < 0.05) of the droplet diameter of a delivery system between digestion phases; different capital letters mean significant differences (p < 0.05) of the droplet diameter between delivery systems at same GIT stage.
3.2.1. Mouth. After exposure to simulated oral conditions there was a large increase in the mean particle size of the systems containing protein- and phospholipid-nPs, but little change in the systems containing lipid-nPs (Fig. 2). The particle size distribution measurements indicated that this was due to the presence of a population of particles with dimensions much larger than those in the initial systems (Fig. 3). As expected, large aggregates were also observed in the confocal microscopy images for the colloidal dispersions containing protein- and phospholipid-nPs in the mouth stage (Fig. 4). For these nanoparticles, aggregation may have been partially due to depletion flocculation induced by the mucin molecules, as well as partially due to electrostatic screening effects caused by the salts in the artificial saliva. In addition, anionic groups on the mucin molecules may have bound to cationic groups on the phospholipid head groups (such as the amino groups found on phosphatidylcholine and phosphatidylethanolamine) or cationic groups on the protein molecule surfaces (such as the amino groups found on arginine, lysine or histidine). Interestingly, the confocal microscopy images indicated that extensive aggregation of the lipid-nPs occurred within the oral phase (Fig. 4), despite the fact that aggregation was not evident in the light scattering data (Fig. 2 and 3c). This effect has also been reported previously, where it was attributed to the ability of mucin to promote reversible depletion flocculation. In the simulated mouth conditions, the mucin concentration is above the critical level required to induce flocculation, but once the samples are diluted for light scattering measurements the mucin concentration is no longer high enough. This result highlights the importance of confirming light scattering measurements with microscopy observations; otherwise erroneous conclusions may be drawn. Presumably, the phospholipid- and protein-nPs remained aggregated after dilution because strong electrostatic mucin bridges held them together.
image file: c5ra22834d-f3.tif
Fig. 3 (a) Influence of simulated gastrointestinal conditions on the particle size distributions of curcumin-loaded protein nanoparticles. (b) Influence of simulated gastrointestinal conditions on the particle size distributions of curcumin-loaded phospholipid nanoparticles. (c) Influence of simulated gastrointestinal conditions on the particle size distributions of curcumin-loaded lipid nanoparticles.

image file: c5ra22834d-f4.tif
Fig. 4 Influence of simulated gastrointestinal conditions on microstructure of curcumin-loaded nanoparticle dispersions: lipid, phospholipid, and protein nanoparticles. Nile red was added to highlight lipid-rich regions. The scale bars represent a length of 20 μm.

In the mouth stage, all of the colloidal dispersions had a relatively modest negative charge (−7 to −9 mV). This would be expected for the lipid- and phospholipid-nPs because the mouth pH was close to their initial values. The negative charge on the protein-nPs may have been because the pH in the mouth (pH 7) was higher than the isoelectric point of zein (pH 6.2). In addition, some anionic mucin molecules may have adsorbed to the cationic groups on the surfaces of the protein or phospholipid molecules.

3.2.2. Stomach. After exposure to stomach conditions the mean particle diameters of the protein- and phospholipid-nPs determined by light scattering remained relatively large (Fig. 2), which suggested that they were strongly aggregated. On the other hand, the mean particle diameter of the lipid-nPs was similar to that of the initial sample. These results were supported by the full particle size distributions, which showed that there was a population of large particles in the systems containing protein- and phospholipid-nPs (Fig. 3). Interestingly, there appeared to be a population of nanoparticles with dimensions similar to the initial ones in the colloidal dispersions containing phospholipid-nPs after exposure to the stomach, which suggested that some of the flocs formed in the mouth had dissociated. The confocal microscopy images indicated that there were some large particles in the protein- and phospholipid-nP systems in the stomach, but these particles were smaller than those observed in the mouth (Fig. 4). In addition, the lipid-nP systems appeared to be non-aggregated in the stomach phase. Thus, the microscopy measurements suggest that some of the flocs formed in the mouth dissociated when they reached the stomach environment. This effect can be attributed to the fact that the samples were diluted in the stomach, which decreased the mucin concentration and therefore reduced the strength of the depletion attraction between the particles. In addition, the pH changed from neutral to strongly acidic, which may have altered the sign, strength, and range of the colloidal interactions between the nanoparticles.

All three types of nanoparticles had a small negative charge after exposure to the stomach environment (−3 to −4 mV). It would be expected that zein nanoparticles would have a large positive charge when suspended in highly acidic solutions because the pH would be well below their isoelectric point.25 The fact that they actually had a slightly negative charge can be attributed to a number of factors: (i) adsorption of anionic mucin molecules onto the surfaces of the cationic protein nanoparticles; (ii) electrostatic screening by the counter-ions in the simulated gastric fluids; (iii) digestion of the protein molecules by proteases in the gastric fluids. Knowledge of the actual charge on nanoparticles under complex gastrointestinal conditions is important because it may influence the fate of encapsulated bioactives. For example, it is often claimed that cationic nanoparticles have a greater retention in the GIT because they bind to the anionic mucus layer lining the gastrointestinal wall, i.e., they exhibit mucoadhesion.29 However, if a layer of anionic mucin from the saliva coats the cationic nanoparticles, this assumption may no longer be valid.

3.2.3. Small intestine. After exposure to small intestine conditions, light scattering measurements indicated that all of the samples had relatively high mean particle diameters (Fig. 2) and contained a population of large particles (Fig. 3). In addition, the confocal microscopy images also indicated that the samples contained some relatively large particles (Fig. 4). It is difficult to accurately determine the nature of these particles because the digesta may contain undigested nanoparticles, micelles, vesicles, calcium salts, and precipitated curcumin. The electrical charge on the particles in the digesta was highly negative for all of the samples, but the magnitude of the charge was much greater for the lipid-nPs (−47 mV) than for the phospholipid (−26 mV) or protein (−20 mV) ones (Fig. 5). The negative charge on the particles in the digesta can be attributed to the presence of various types of anionic species, including bile salts, phospholipids, free fatty acids, and peptides. The much greater negative charge measured for the digesta arising from the lipid nPs can be attributed to the fact that long chain free fatty acids were generated that accumulated at the particle surfaces.30
image file: c5ra22834d-f5.tif
Fig. 5 Influence of simulated gastrointestinal conditions on the particle charge of curcumin-loaded nanoparticle dispersions: lipid, phospholipid, and protein nanoparticles. Different lowercase letters mean significant differences (p < 0.05) of the particle charge of a delivery system between digestion phases; different capital letters mean significant differences (p < 0.05) of the particle charge in different delivery systems within the same GIT phase.

3.3. Digestion of different nanoparticles under intestinal conditions

The small intestine contains a number of different kinds of enzymes that are capable of digesting food components, including amylases, lipases, phospholipases, and proteases.31 In this section, we therefore characterized the hydrolysis of the different delivery systems under simulated small intestine conditions. An automatic titration unit (pH stat) was used to measure the amount of alkaline solution (NaOH) that had to be added into the reaction chamber to maintain the pH at neutral during the course of digestion.27 Lipids and phospholipids will release free fatty acids (and H+) when they are hydrolyzed by lipases or phospholipases, whereas proteins will release amino acids (and H+) when they are hydrolyzed by proteases.

There was a rapid increase in the amount of NaOH titrated into the reaction chamber for the lipid-nP system during the first 10 minutes of digestion, followed by a more modest increase at longer incubation times (Fig. 6). This release profile can be attributed to the hydrolysis of the triacylglycerols (TAGs) in the lipid nanoparticles leading to the generation of free fatty acids (FFAs) and monoacylglycerols (MAGs). Typically, hydrolysis occurs rapidly in nanoemulsions because of the high surface area of the lipid phase exposed to the digestive enzymes.28 In the case, of the protein- and phospholipid-nPs there was only a slight increase in the amount of NaOH added over time. One of the main reasons for this effect is that the three colloidal delivery systems were formulated to contain the same initial curcumin concentration (0.3 mg mL−1). As the loading capacities of the different nanoparticles varied (Section 3.1), this meant that they had to be formulated with different total amounts of particle carrier material (protein, lipid, or phospholipid). Indeed, the final amounts of proteins, lipids, and phospholipids in the different delivery systems were 6.6 mg mL−1 for protein, 100 mg mL−1 for lipid, and 14 mg mL−1 for phospholipid. Consequently, one would have expected a much greater amount of NaOH would be required to neutralize the protons released for the lipid than for the other carrier materials.


image file: c5ra22834d-f6.tif
Fig. 6 Influence of nanoparticle composition on the NaOH titration profile of curcumin-loaded nanoparticle dispersions: lipid, phospholipid, and protein nanoparticles.

In the case of the phospholipid-nPs this may also have been because phospholipases were not specifically included in the simulated small intestinal fluids. Nevertheless, the manufacturer of the pancreatin from porcine pancreas used in this study (Sigma) reports that it has broad-spectrum activity because it contains a mixture of different digestive enzymes. In the case of the protein-nPs this may have been because they had already been largely digested by pepsin within the gastric environment.

3.4. Impact of nanoparticle type on transformation and bioaccessibility

Finally, the influence of the composition of the nanoparticles on the transformation and bioaccessibility of the curcumin at the end of the simulated GIT was determined (Table 2). The transformation of a bioactive agent determines the amount that remains in a bioactive form, whereas the bioaccessibility determines the fraction of the bioactive form that is solubilized in the mixed micelle phase and therefore available for absorption. The transformation and bioaccessibility determine the total amount of curcumin available for absorption (Fig. 7).
Table 2 Properties of samples collected after passage of protein, phospholipid, and lipid nanoparticle suspensions through a simulated GIT (mouth, stomach, small intestine). Samples designated with different letters (a, b, c) were significantly different (Duncan, p < 0.05)
  Protein Phospholipid Lipid
Transformation (%) 41 ± 12b 20.8 ± 0.7a 40 ± 16b
Bioaccessibility (%) 51.5 ± 4.7a 74.4 ± 2.9b 91.8 ± 5.0c
Cdigesta (μg mL−1) 123.9 ± 0.5b 62.3 ± 1.3a 120.0 ± 8.5b
Cmicelle (μg mL−1) 63 ± 12b 46.3 ± 0.7a 109 ± 16c
Mean diameter (nm) 203.1 ± 16.3c 110.3 ± 22.9a 144.1 ± 3.7b
PDI 0.60 ± 0.04c 0.40 ± 0.09b 0.23 ± 0.01a
ζ-Potential (mV) −12.6 ± 4.4a −21.8 ± 7.2a −59.8 ± 1.6b


image file: c5ra22834d-f7.tif
Fig. 7 Influence of nanoparticle type on the concentration of curcumin solubilized within the mixed micelle phase after passage through a simulated GIT. All of the samples were significantly different (p < 0.05) from each other.

The fraction of curcumin that was not transformed after passage through the GIT was appreciably higher for the protein-nPs (41%) and lipid-nPs (40%) than for the phospholipid-nPs (21%) (Table 2). There are a number of physicochemical factors that could contribute to the chemical stability of the curcumin in the simulated GIT. Firstly, the degradation of curcumin occurs primarily due to exposure to aqueous neutral or alkaline environments.13,14 Consequently, if a nanoparticle can prevent the curcumin from coming into contact with the surrounding aqueous phase (especially in the mouth and small intestine stages due to their relatively high pH values), then it may be able to inhibit curcumin degradation. It is possible that the curcumin molecules encapsulated within nanoliposomes are in closer contact with the aqueous phase than those in protein- or lipid-nPs. The phospholipid nanoparticles were appreciably smaller than the other types of nanoparticles, and would therefore have a greater surface area exposed to the aqueous phase. In addition, there may have been water molecules located between the phospholipid bilayers, so that the curcumin was always in close proximity to the aqueous phase. Conversely, the curcumin in the protein- and lipid-nPs may have been present mainly in the interior of the nanoparticles, away from the aqueous phase. Secondly, the degradation of curcumin may be retarded by the presence of certain types of chemical inhibitors, such as antioxidants (that slow down oxidation reactions), chelating agents (that bind molecules that promote degradation), and buffering agents (that control the local pH). Many proteins are known to be effective antioxidants, chelating agents, and buffering agents,32,33 which may at least partially account for the relatively good stability of the curcumin in the protein-nPs.

The bioaccessibility of the curcumin was appreciably higher in the lipid-nPs (92%) than in the phospholipid-nPs (74%) or protein-nPs (52%). This effect can be attributed to the impact of the digested nanoparticles on the solubilization capacity of the mixed micelle phase. The TAGs from the lipid nanoparticles will be converted into MAGs and FFAs that will form mixed micelles (micelles and vesicles) with the phospholipids and bile salts from the simulated intestinal fluids.34 The greater number of non-polar domains formed within the mixed micelle phase due to the presence of the MAGs and FFAs will increase its solubilization capacity. Thus, more hydrophobic curcumin molecules can be solubilized. Phospholipids and their digestion products (lysolecithin and FFAs) released from nanoliposomes could also increase the solubilization capacity of the mixed micelle phase by increasing the number of non-polar domains available to incorporate hydrophobic bioactives.35 Conversely, the proteins and peptides released from the zein nanoparticles may not have been able to greatly increase the solubilization capacity of the mixed micelle phase because they cannot easily be incorporated into micelles or vesicles. Nevertheless, studies have shown that the water-solubility of curcumin can be enhanced somewhat by binding to certain types of protein, e.g., soy proteins,36 whey proteins,37 and caseins.38 Curcumin normally has a low solubility in intestinal fluids and therefore the modestly high value (52%) determined for the protein-nPs in this study may have been due to this effect.

The absolute amount of curcumin present in the mixed micelle phase after passage through the simulated GIT can be taken as a measure of that which is available for absorption. Overall, the amount of available curcumin depended strongly on nanoparticle composition (Fig. 7): lipid-nPs > protein-nPs > phospholipid-nPs. This effect can be attributed to the combined influence of the nanoparticle type on both bioaccessibility and transformation. Ideally, a good delivery system should protect the curcumin from degradation throughout the GIT, but then fully release it into the mixed micelle phase in the small intestine. Our results suggest that the lipid nanoparticles were the most effective at promoting both the chemical stability and solubilization of curcumin under GIT conditions. Nevertheless, it should be highlighted that the lipid-nPs actually had the lowest loading capacity (Table 1), and therefore a higher amount of these particles would have to be incorporated into a food to reach a particular curcumin level.

In this study, a relatively simple UV-visible spectrophotometry method was used to determine the amount of curcumin present. In future studies, it would be advantageous to use more sophisticated analytical methods, such as HPLC/mass spectrometry, to provide more detailed information about changes in the chemical structure of curcumin throughout the GIT.

4. Conclusions

This study has shown that the composition of the nanoparticles used to encapsulate curcumin has a major impact on its degradation and bioaccessibility within a simulated gastrointestinal tract. Protein nanoparticles were able to incorporate the highest amount of curcumin per unit mass of particles, and so they could be used at the lowest level to fortify foods. This may be advantageous in terms of lower costs, and reduced impact on the quality attributes of foods (such as appearance, texture, and flavor). Nevertheless, future studies need to be carried out to determine the influence of different nanoparticle types on sensory properties using commercially realistic products. At a fixed curcumin level, the lipid nanoparticles (nanoemulsions) were the most effective at increasing the amount of bioactive available for absorption, which was attributed to their ability to protect the curcumin from degradation and increase its solubility in the mixed micelle phase. The greatest amount of chemical degradation of curcumin occurred when it was incorporated into phospholipid-nanoparticles (nanoliposomes), which may limit the application of this type of delivery system. The main advantage of protein nanoparticles was that they had a high loading capacity, which meant that they could be used at relatively low levels to fortify foods or other products with curcumin.

The results of this study highlight the importance of selecting an appropriate type of nanoparticle-based delivery system to optimize the bioavailability of curcumin. There are advantages and disadvantages for each kind of nanoparticle, which should be taken into account for different types of applications. A relatively simple in vitro gastrointestinal model was used in this study, which enabled us to rapidly screen different samples and to provide some insights into the physicochemical mechanisms occurring. Nevertheless, further work is clearly required using animal or human feeding models to determine if the effects observed will also occur under more realistic gastrointestinal conditions.

Acknowledgements

This material was partly based upon work supported by the USDA, NRI Grants (2013-03795, 2011-67021, and 2014-67021). We also thank the National Aero and Space Administration (NASA) for partial funding of this research (NNX14AP32G). This project was also partly supported by the National Natural Science Foundation of China (NSFC31428017). This project was also partly funded by the Deanship of Scientific Research (DSR), King Abdulaziz University, Jeddah, under grant numbers 330-130-1435-DSR, 299-130-1435-DSR, 87-130-35-HiCi. The authors, therefore, acknowledge with thanks DSR technical and financial support.

References

  1. D. J. McClements, J. Food Sci., 2015, 80, N1602–N1611 CrossRef CAS PubMed.
  2. J. S. Yang, S. Y. Han, H. C. Zheng, H. B. Dong and J. B. Liu, Carbohydr. Polym., 2015, 123, 53–66 CrossRef CAS PubMed.
  3. H. Y. Kim, S. S. Park and S. T. Lim, Colloids Surf., B, 2015, 126, 607–620 CrossRef CAS PubMed.
  4. D. J. McClements and J. Rao, Crit. Rev. Food Sci. Nutr., 2011, 51, 285–330 CrossRef CAS PubMed.
  5. L. Sagalowicz and M. E. Leser, Curr. Opin. Colloid Interface Sci., 2010, 15, 61–72 CrossRef CAS.
  6. D. J. McClements, Adv. Colloid Interface Sci., 2002, 97, 63–89 CrossRef CAS.
  7. D. J. McClements, Soft Matter, 2011, 7, 2297–2316 RSC.
  8. T. G. Mason, J. N. Wilking, K. Meleson, C. B. Chang and S. M. Graves, J. Phys.: Condens. Matter, 2006, 18, R635–R666 CrossRef CAS.
  9. D. J. McClements, Prog. Lipid Res., 2013, 52, 409–423 CrossRef CAS PubMed.
  10. M. Fathi, A. Martin and D. J. McClements, Trends Food Sci. Technol., 2014, 39, 18–39 CrossRef CAS.
  11. Z. L. Wan, J. Guo and X. Q. Yang, Food Funct., 2015, 6, 2876–2889 CAS.
  12. M. R. Mozafari, C. Johnson, S. Hatziantoniou and C. Demetzos, J. Liposome Res., 2008, 18, 309–327 CrossRef PubMed.
  13. M. Heger, R. F. van Golen, M. Broekgaarden and M. C. Michel, Pharmacol. Rev., 2014, 66, 222–307 CrossRef PubMed.
  14. P. Anand, A. B. Kunnumakkara, R. A. Newman and B. B. Aggarwal, Mol. Pharm., 2007, 4, 807–818 CrossRef CAS PubMed.
  15. Q. R. Huang, H. L. Yu and Q. M. Ru, J. Food Sci., 2010, 75, R50–R57 CrossRef CAS PubMed.
  16. A. R. Patel and K. P. Velikov, LWT--Food Sci. Technol., 2011, 44, 1958–1964 CrossRef CAS.
  17. I. J. Joye and D. J. McClements, Trends Food Sci. Technol., 2013, 34, 109–123 CrossRef CAS.
  18. K. Ahmed, Y. Li, D. J. McClements and H. Xiao, Food Chem., 2012, 132, 799–807 CrossRef CAS.
  19. L. Zou, S. Peng, L. Gan, W. Liu, R. Liang, C. Liu, J. Niu, Y. Cao, Z. Liu and X. Chen, Food Res. Int., 2014, 64, 492–499 CrossRef CAS.
  20. R. Zhang, Z. Zhang, H. Zhang, E. A. Decker and D. J. McClements, Food Hydrocolloids, 2015, 45, 175–185 Search PubMed.
  21. A. R. Patel, P. C. M. Heussen, E. Dorst, J. Hazekamp and K. P. Velikov, Food Chem., 2013, 141, 1466–1471 CrossRef CAS PubMed.
  22. E. Troncoso, J. M. Aguilera and D. J. McClements, J. Colloid Interface Sci., 2012, 382, 110–116 CrossRef CAS PubMed.
  23. K. Hu, X. X. Huang, Y. Q. Gao, X. L. Huang, H. Xiao and D. J. McClements, Food Chem., 2015, 182, 275–281 CrossRef CAS PubMed.
  24. X. Chen, L. Q. Zou, J. Niu, W. Liu, S. F. Peng and C. M. Liu, Molecules, 2015, 20, 14293–14311 CrossRef CAS PubMed.
  25. A. R. Patel, E. C. M. Bouwens and K. P. Velikov, J. Agric. Food Chem., 2010, 58, 12497–12503 CrossRef CAS PubMed.
  26. G. Fricker, T. Kromp, A. Wendel, A. Blume, J. Zirkel, H. Rebmann, C. Setzer, R. O. Quinkert, F. Martin and C. Muller-Goymann, Pharm. Res., 2010, 27, 1469–1486 CrossRef CAS PubMed.
  27. M. Minekus, M. Alminger, P. Alvito, S. Ballance, T. Bohn, C. Bourlieu, F. Carriere, R. Boutrou, M. Corredig, D. Dupont, C. Dufour, L. Egger, M. Golding, S. Karakaya, B. Kirkhus, S. le Feunteun, U. Lesmes, A. Macierzanka, A. Mackie, S. Marze, D. J. McClements, O. Menard, I. Recio, C. N. Santos, R. P. Singh, G. E. Vegarud, M. S. J. Wickham, W. Weitschies and A. Brodkorb, Food Funct., 2014, 5, 1113–1124 CAS.
  28. Y. Li, M. Hu and D. J. McClements, Food Chem., 2011, 126, 498–505 CrossRef CAS.
  29. A. Bernkop-Schnurch and S. Dunnhaupt, Eur. J. Pharm. Biopharm., 2012, 81, 463–469 CrossRef PubMed.
  30. L. Sek, C. J. H. Porter, A. M. Kaukonen and W. N. Charman, J. Pharm. Pharmacol., 2002, 54, 29–41 CrossRef CAS PubMed.
  31. K. E. Barrett, Gastrointestinal Physiology, McGraw-Hill, New York, NY, 2nd edn, 2014 Search PubMed.
  32. A. G. P. Samaranayaka and E. C. Y. Li-Chan, J. Funct. Foods, 2011, 3, 229–254 CrossRef CAS.
  33. R. J. Elias, S. S. Kellerby and E. A. Decker, Crit. Rev. Food Sci. Nutr., 2008, 48, 430–441 CrossRef CAS PubMed.
  34. C. J. H. Porter, N. L. Trevaskis and W. N. Charman, Nat. Rev. Drug Discovery, 2007, 6, 231–248 CrossRef CAS PubMed.
  35. W. A. Birru, D. B. Warren, A. Ibrahim, H. D. Williams, H. Benameur, C. J. H. Porter, D. K. Chalmers and C. W. Pouton, Mol. Pharm., 2014, 11, 2825–2834 CrossRef CAS PubMed.
  36. F.-P. Chen, B.-S. Li and C.-H. Tang, Food Res. Int., 2015, 75, 157–165 CrossRef CAS.
  37. M. Li, J. Cui, M. O. Ngadi and Y. Ma, Food Chem., 2015, 180, 48–54 CrossRef CAS PubMed.
  38. K. Pan, Q. Zhong and S. J. Baek, J. Agric. Food Chem., 2013, 61, 6036–6043 CrossRef CAS PubMed.

Footnote

These authors contributed equally to this manuscript.

This journal is © The Royal Society of Chemistry 2016
Click here to see how this site uses Cookies. View our privacy policy here.