Adsorption/desorption performance of volatile organic compounds on electrospun nanofibers
Lanling Chua,
Siwei Dengb,
Renshan Zhaob,
Zhao Zhangb,
Chen Lib and
Xuejun Kang*b
aSchool of Public Health, Southeast University, Nanjing 210096, China
bKey Laboratory of Child Development and Learning Science (Ministry of Education), Research Centre for Learning Science, Southeast University, Nanjing 210096, China. E-mail: xjkang64@163.com; Tel: +86-025-83795664-1011
First published on 17th November 2015
Abstract
The objective of this study was to investigate the adsorption/desorption performance of volatile organic compounds (VOCs) on electrospun nanofibers. A homemade rational adsorption experimental setup was used to conduct performance tests on the nanofibers measuring the selectivity, adsorption/desorption efficiency, adsorption equilibration time, regeneration and temperature effects. The VOCs adsorbed on different adsorbents, followed by desorption (thermal and/or solvent), were analyzed using capillary gas chromatography. Three nanofibers, including polystyrene (PS) nanofibers, acrylic resin (AR) nanofibers, and polystyrene–acrylic resin (PS–AR) composite nanofibers, three comparison materials, including activated carbons (ACs), carbon nanotubes (CNTs), and carbon fibers (ACFs), as well as ten VOCs, including n-butanol, toluene, chlorobenzene, anisole, nitrobenzene, dichloromethane, ethyl acetate, benzene, acetone and n-hexane, were partly utilized in different performance experiments. The results revealed that the nanofibers exhibited a certain selectivity and the best thermal desorption efficiency compared to all comparison materials. What is more, electrospun nanofibers spent short time reaching adsorption equilibration, favorable regeneration and temperature effect. It showed that electrospun nanofibers can be a potential adsorbent for VOCs.
1. Introduction
Recently volatile organic compounds (VOCs) have drawn considerable attention as they have a negative impact on the atmosphere and can seriously affect indoor air quality. They can also pose a serious hazard to human health and the environment due to the well-known toxicity of compounds (e.g., benzene and toluene) and the special odor of VOCs which can cause various uncomfortable reactions in the human body and be harmful to people’s health.1 Due to the low levels of VOC concentrations and these being beyond instrumental limits of detection, the analysis of trace VOCs is challenging for current analytical methods especially as the complex preconcentration process is further exacerbated by other interfering gases that are mixed in large concentrations with VOCs.2The most common techniques for the sampling and preconcentration of VOCs in gaseous samples include whole-air collection techniques and solid-sorbent enrichment methods, but the latter earns more attention, and the adsorbents are crucial.3 Common adsorbents mainly include carbon-based materials (e.g., activated carbon (ACs) and activated carbon fibers (ACFs)).4,5 ACs are structureless and have complex physicochemical properties. They are the most versatile and frequently used sorbent due to their large internal surface area and pore volume, and their ability to absorb organic vapors at low cost.6 But their adsorptive capacity is limited by the following factors: adsorption of water, irreversible adsorption of analytes, high desorption temperature,7 slow kinetics and nonequilibrium of sorption in heterogeneous systems, the mass transfer rate to the sorbent surface, and their relatively large dimensions.8 To overcome above restrictions, ACFs have been proposed as candidates, or as modifying factors, for improving the adsorption properties of ACs. ACFs are synthetic materials manufactured from an array of uniform polymeric substrates, including polyacrylonitrile, pitch-based polymers, and phenolic-based resins.9 Basically, the carbon of ACFs is a form of graphite, free of nitrogen, hydrogen, halogens, sulfur, and oxygen. Most ACFs have the fiber diameter of 7–15 μm, which is even smaller than powdered ACs. A unique property of ACFs over other commercially available adsorbents is the possibility of “reactivating” the fabric when it has become saturated. ACFs have the higher filtering efficiency, and are less adversely affected by preadsorbed moisture compared to ACs.10
Over the past decade, a number of new materials, especially nanostructured materials, have been investigated as sorbents for the adsorption of gaseous organic molecules (e.g., carbon nanotubes (CNTs)).11 In addition to the high surface area and uniform mesoporous diameters, the magnitude and distribution of pore diameters and the presence of functional groups at the edges could modify the adsorbent capacity of CNTs. CNTs consist of a graphene layer rolled coaxially into cylinders of nanometric diameter, and can be classified as single-walled or multi-walled carbon nanotubes—the latter presents additional concentric cylinders of carbon. With relatively large breakthrough volumes and a narrow desorption bandwidth, CNTs show highly favorable adsorption as well as desorption.3,12,13 Unfortunately, the application of CNTs requires the modification of hydrophobic complexes before sample loading, which makes the analytical procedure complex and time consuming.14 The modification of the surface chemistry is useful yet difficult for obtaining an ideal sorbent for adsorbing VOCs.
Habib Bagheri and co-workers confirmed that an electrospun nanofiber-based sorbent has the potential to extract organic compounds. The fibrous and web-like structure provides a higher specific surface area and loading capacity, and sufficient mechanical stability.15,16 Recently, our laboratory has developed packed-fiber solid phase extraction (PFSPE) and successfully applied it to a liquid medium.17–24 More recently, we determined that electrospun nanofibers perform well in sampling and enriching gaseous organic compounds, even in a vacuum environment.25
As far as we know, electrospinning is a versatile and straightforward method for producing thin fibers with diameters between micrometers and nanometers. Interestingly, when the diameters of polymer fiber materials decrease from micrometers to submicrons or nanometers, several surprising characteristics appear, such as very large surface area to volume ratio, the flexibility of surface functionality and the mechanical performance superior to any other known form of the material.26 Feng and co-workers confirmed that electrospun nanofiber membranes exhibited a better gas-stripping performance than a commercial fiber due to the rapid mass transfer of the model molecule.27 Unlike microporous materials, the transport of solutes through the porous structure could delay the equilibration, and non-microporous materials, such as nanofibers, exhibit faster mass transfer for solutes.11 Therefore, an improved adsorption/desorption performance should be expected for electrospun nanofibers due to their thin diameter and high porosity.
In the present study, we investigated the adsorption/desorption performance of VOCs onto our own homemade electrospun nanofibers, including the selectivity, adsorption/desorption efficiency, adsorption equilibration time and regeneration. In order to probe into the adsorption of VOCs onto polymeric nanofibers, we present experimental results for the adsorption of several typical VOCs onto three structurally dissimilar polymeric sorbents: polystyrene (PS) nanofibers, which are composed of styrene, a hydrophobic polyaromatic polymer, making them more efficient for the adsorption of compounds of higher hydrophobicity, acrylic resin (AR) nanofibers, which are composed of a non-ionic aliphatic acrylic polymer with a moderate hydrophobic matrix and hydrogen-bonding moieties, showing an intermediate affinity for the adsorbates, and polystyrene–acrylic resin (PS–AR) co-spun nanofibers.
Three compared adsorbents including ACs, ACFs and CNTs were referred in the adsorption/desorption efficiency tests. And the representative VOCs, including n-butanol, toluene, chlorobenzene, anisole, nitrobenzene, dichloromethane, ethyl acetate, benzene, acetone and n-hexane, were selected in different experiments as model molecules, which can provide useful chemical information on the studied adsorbent phase due to their different chemical properties.
2. Experimental
2.1. Materials
Polystyrene (PS), acrylic resin (AR), ACs, CNTs and ACFs were obtained from Shanghai Chemical Agents Institute, Shanghai, China. Solvents were of analytical grade and purchased from Lingfeng Chemical Reagent Co., Ltd, Shanghai, China.2.2. Preparation of nanofibers
The PS, AR and PS–AR nanofibers were prepared as follows: 10% (w/v) PS was dissolved in a mixture of dimethylformamide and tetrahydrofuran (4![[thin space (1/6-em)]](https://www.rsc.org/images/entities/char_2009.gif) :
:![[thin space (1/6-em)]](https://www.rsc.org/images/entities/char_2009.gif) 6, v/v). 10% (w/v) AR was dissolved in a mixture of ethanol and dimethylformamide (4
6, v/v). 10% (w/v) AR was dissolved in a mixture of ethanol and dimethylformamide (4![[thin space (1/6-em)]](https://www.rsc.org/images/entities/char_2009.gif) :
:![[thin space (1/6-em)]](https://www.rsc.org/images/entities/char_2009.gif) 1, v/v). 10% (w/v) PS–AR (1
1, v/v). 10% (w/v) PS–AR (1![[thin space (1/6-em)]](https://www.rsc.org/images/entities/char_2009.gif) :
:![[thin space (1/6-em)]](https://www.rsc.org/images/entities/char_2009.gif) 1, m/m) was dissolved in a mixture of dimethylformamide and tetrahydrofuran (4
1, m/m) was dissolved in a mixture of dimethylformamide and tetrahydrofuran (4![[thin space (1/6-em)]](https://www.rsc.org/images/entities/char_2009.gif) :
:![[thin space (1/6-em)]](https://www.rsc.org/images/entities/char_2009.gif) 6, v/v). Then the three solutions were stirred at room temperature for 10 h prior to electrospinning.
6, v/v). Then the three solutions were stirred at room temperature for 10 h prior to electrospinning.
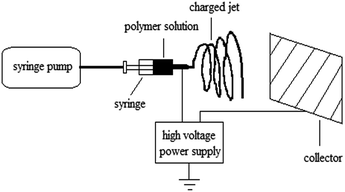
The solution was loaded into a glass syringe that was fitted to a steel needle with a tip diameter of 0.5 mm, and the tip was filed flat. As shown in Fig. 1, electrospinning was performed with an anodic voltage of 19 kV, 22 cm from the tip of the needle to the collecting equipment, and with a feed rate of 1.8 mL h−1 for the precursor solution.
2.3. Characterization of nanofibers
The morphology of the tested materials was assessed using an S23000N field-emission scanning electron microscope (FE-SEM, Hitachi, Japan), a Tecnai G20 transmission electron microscope (TEM, FEI, America), a smart X-ray diffractometer (XRD, Smartlab3, Japan) and a specific surface and porosity analyzer (Micromeritics ASAP2020, USA).2.4. Static adsorption and the experimental device
A homemade experimental device, which was shown in Fig. 2, was used to perform the absorptive tests. 5 mg of the tested material was accurately weighed and simultaneously placed in the sample box made of aluminum foil (Fig. 2, no. 8), which was suspended in a 2500 mL sample flask (Fig. 2, no. 7) with a stainless steel wire (Fig. 2, no. 6) attached to the rubber plug (Fig. 2, no. 4). The sample flask was connected to a gas cylinder (Fig. 2, no. 3) partially filled with water through which gas was forced or drawn. 1 mL of model molecule solvent was sequentially injected into the gas cylinder.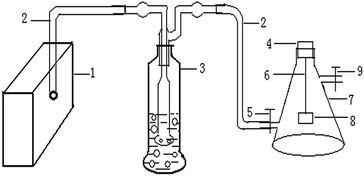 | ||
| Fig. 2 Experimental device: 1. vacuum pump; 2. ventilation tube; 3. gas cylinder; 4. rubber plug; 5. sealing clip; 6. stainless steel wire; 7. sample flask; 8. sample box; 9. sealing clip. | ||
When the vacuum pump (Fig. 2, no. 1) was turned on, air was drawn in through the inlet ventilation tube (Fig. 2, no. 2) to the bottom of the water where the air escaped as bubbles that floated to the surface of the liquid and exited through the outlet ventilation tube fitted to the top of the cylinder. The target gas, which escaped from the liquid phase and accompanied the continuous air stream, was transferred to the sample flask. Then, the sealing clip (Fig. 2, no. 5) was closed after 1 min. The sample flask was always tightly sealed with the rubber plug. Thus, the sample flask was full of target VOCs and the adsorptive time of the tested materials kept for 2 h.
2.5. Leakproofness tests on experimental device
Before the adsorptive tests, the leakproofness of the device was checked. According to the method of the adsorptive tests, 1 mL of benzene was injected into the gas cylinder (Fig. 2, no. 3). The vacuum pump (Fig. 2, no. 1) was turned on for 1 min and then the sealing clip (Fig. 2, no. 5) was closed. Next, the sealing clip (Fig. 2, no. 9) was opened and 1 mL of the gaseous sample was obtained. Next, this was injected into the gas chromatograph (GC, Agilent 7890A) for analysis. After 24 h, 1 mL of the gaseous sample was injected into the gas chromatograph (GC, Agilent 7890A) for analysis, again. Tests were conducted in triplicate for every flask.The concentration variation of the benzene gas in the same flask, which was indicated by the peak area variation, was reduction of less than 3%. Only the reduction of less than 3% was regarded as being in the range of experimental requirements and the leakproofness of the experimental device was determined. And the flasks, whose concentration variation of the three tests was less than 3%, were selected to perform all adsorptive tests.
2.6. Desorption
After 2 h of static adsorption, the tested material was transferred to a previously cleaned and dried headspace vial. Considering the lower temperature tolerance of the tested nanofibers and the consistency of experimental conditions, all the tested materials underwent desorption at 80 °C in a headspace sampler for 30 min. Next, 1 mL of the gaseous sample was injected into the gas chromatograph (GC, Agilent 7890A) for analysis.In addition to the above thermal desorption, the solvent desorption proceeded through the following steps. The tested material was transferred to a previously cleaned centrifugal tube. 1 mL of dimethylsulfoxide was added to the tube and then vortexed for 10 min. Next, 1 μL of the supernatant was injected into the GC for analysis. The determination was conducted in triplicate for each sample.
The injected target components in the GC were determined using external standard quantitation. Then the peak area of every component was subject to further processes. The determination was conducted in triplicate for each sample.
2.7. GC conditions
The desorbed target VOCs were analyzed using a GC-Flame Ionization Detector (FID). The column oven temperature was programmed to increase from an initial temperature of 35 °C, which was maintained for 5 min, followed by an increase to 120 °C at 10 °C min−1 and a second increase to 200 °C at 10 °C min−1, which was maintained for 10 min. The injection temperature and detection temperature were 230 °C and 250 °C, respectively. Nitrogen was used as the carrier gas with a flow rate of 2 mL min−1. Simultaneously, the air flow rate was 350 mL min−1 and the hydrogen flow rate was 40 mL min−1 with an 18.055 mL min−1 make-up gas flow rate. All of the injections were performed in the split mode and the split ratio was 5![[thin space (1/6-em)]](https://www.rsc.org/images/entities/char_2009.gif) :
:![[thin space (1/6-em)]](https://www.rsc.org/images/entities/char_2009.gif) 1.
1.
3. Results and discussion
3.1. Characterization
The surface characteristics of the tested nanofiber materials were investigated using SEM and TEM. As indicated by the SEM images of the objects (Fig. 3A–C), the diameters are in the range of 300–800 nm for the PS nanofibers, 200–400 nm for the AR nanofibers and 200–900 nm for the PS–AR nanofibers.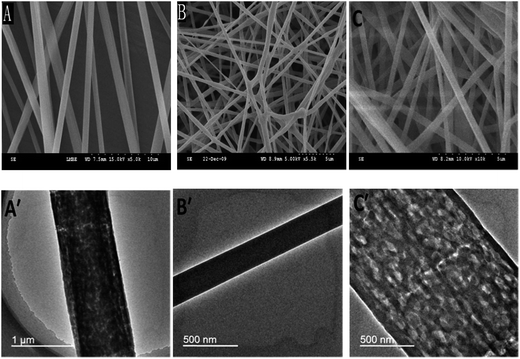 | ||
| Fig. 3 SEM and TEM images of (A, A′) PS nanofibers, (B, B′) AR nanofibers and (C, C′) PS-AR nanofibers. | ||
TEM images of the fibers were shown in Fig. 3A′–C′. It is shown that the AR nanofibers have the homogeneous density, but the PS and PS–AR nanofibers have the certain inhomogeneities. These findings correlate with previous reports that during the electrospinning of PS fibers, nano- and micro-sized pores on the surface may be obtained due to the fast evaporation of the tetrahydrofuran owning low boiling point, and internal porous structures in the fibers can also be formed because of the use of dimethylformamide as the solvent.28,29 The authors also indicated that intra- and inter-fiber porosity will enhance the functionality of fiber webs, where the local properties down to the scale of individual molecules are critical for the performance of the material, for example, when used for filtration/membrane applications. Therefore, the PS-based nanofibers possess the unique surface morphology which should significantly improve the functionality of the fibers, and non-woven mats/fabrics composed of PS-based nanofibers offer the unique ability to supply an enormous number of pore sizes among the adjacent nanofibers, which should result in significantly increased mass transfer during the adsorption, as well as the desorption, process.
The textural properties, including the BET surface area, pore volume and pore size were listed in Table 1. It can be seen that the BET surface area, pore volume and pore size of the co-spun PS–AR nanofibers were the lowest.
| Material | BET surface area (m2 g−1) | Pore volume (cm3 g−1) | Pore size (nm) |
|---|---|---|---|
| PS–AR nanofibers | 19.52 | 0.025 | 5.05 |
| ACFs | 23.19 | 0.027 | 46.32 |
| CNTs | 138.12 | 0.31 | 89.69 |
| ACs | 1223.62 | 0.54 | 17.79 |
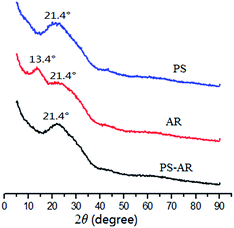
Since the PS–AR co-spun nanofibers were fabricated using AR and PS polymers, the crystalline nature of the three nanofibers was investigated using XRD analysis. Fig. 4 shows the XRD curve of the PS–AR hybrid nanofibers. Data from PS and AR are also provided for comparison. A weak diffraction peak was observed at 13.4° in the AR nanofibers but was absent in the PS and PS–AR nanofibers. The same broad peak at 21.4° was observed for the three nanofibers, and the intensity decreases as the angle increases, which indicates an amorphous structure.30,31 There is no significant change in the diffraction patterns of the PS and PS–AR nanofibers but there is a disappearance of the peak at 13.4° in the PS–AR nanofibers. It should be noted that the overall crystallinity of the co-spun nanofibers is decreased compared with the one component fibers.
3.2. Adsorption selectivity
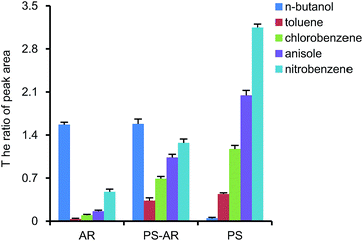
PS is a hydrophobic polymer and AR is hydrophilic so non-polar compounds including toluene, chlorobenzene and anisole plus a polar model compound, n-butanol, were utilized as the model compounds to conduct adsorption/desorption tests. For the desorption method used in testing the nanofibers, including the PS nanofibers, AR nanofibers and PS–AR nanofibers, the solvent desorption method was utilized. Considering that not exactly the same initial concentration of target gases was present, the adsorption/desorption amount was expressed as a ratio of peak area using the following formula (1):
 | (1) |
As shown in Fig. 5, the AR nanofibers exhibited the better adsorption effect for n-butanol, and the PS nanofibers performed better for benzene hydrocarbons, while the PS–AR nanofibers exhibited moderate adsorption effect for all organic substances. This phenomenon indicated that nanofibers with different compositions owned certain selectivities to adsorb gases. PS is a non-polar substance, therefore the PS nanofibers are easier to adsorb benzene hydrocarbons because the interaction between the adsorbate and adsorbent is favoured by the similar chemical behaviour of the polymer backbone and the adsorbate, and the AR nanofibers are polymer fibers containing a polar group in their polymer backbone, resulting in more efficient adsorption of substances containing polar groups, such as n-butanol, while the PS–AR nanofibers, two polymer blended fibers, show broad-spectrum adsorption characteristics. The above results indicated that nanofibers with different adsorption selectivity can be conveniently prepared by adjusting the polymer components in the spinning solution. Due to the broad-spectrum adsorption characteristics of the PS–AR nanofibers, they were chosen as the representative sorbent in the next tests.
3.3. Adsorption efficiency
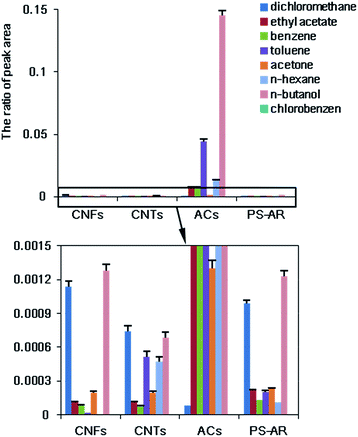
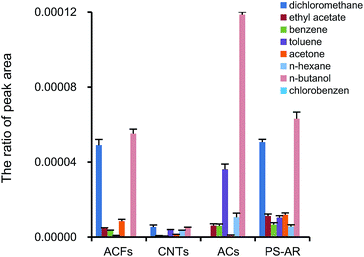
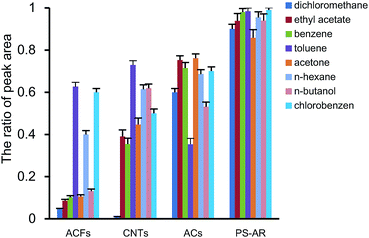
The adsorption efficiencies of different representative VOCs, including hydrocarbon, alcohol, ketone, ester, aromatic and chlorinated compounds onto different sorbents, including PS–AR nanofibers, ACs, ACFs, and CNTs, were compared in this work. The adsorption efficiency was calculated using eqn (1).From Fig. 6, ACs presented the highest adsorption efficiency of all the compounds tested, approximately, followed by CNTs, the PS–AR nanofibers, and ACFs (although the PS–AR nanofibers presented the lowest surface area among the sorbents studied). If the adsorption efficiency is determined per surface unit instead of per weight unit, approximately, the order is as follows: PS–AR nanofibers > ACs > ACFs > CNTs (as shown in Fig. 7), suggesting that the interaction between the sorbent and the target compounds is stronger for nanofibers than that of other sorbents.
3.4. Thermal desorption efficiency
The desorption efficiencies of different representative VOCs onto different sorbents, PS–AR nanofibers, ACs, ACFs, and CNTs, were also compared in this work. In the tests, the desorption of the tested targets was conducted by two steps, the thermal desorption and solvent desorption in sequence, to compare the desorption properties of the sorbents. The following formula was used to determine the thermal desorption efficiency (2):
 | (2) |
Fig. 8 showed the thermal desorption rates of the VOCs, which was expressed as the proportion of VOCs released by thermal desorption over that from the sum of thermal and solvent desorption for the tested objects. PS–AR nanofibers exhibited higher thermal desorption efficiency for most of the VOCs, followed by ACs, CNTs, and ACFs. The reasons may be that the gas adsorption/desorption occurs at the surface of the nanofibers, while for others, the adsorbed mass has to diffuse through macropores, mesopores and micropores, and the diffusion path is long and intricate, which slows the rate of adsorption and desorption. The preferable desorption rate may be another advantage of nanofibres over other sorbents, because the fast release of VOCs at a lower temperature is useful for regeneration and other applications, for example, the sampling of VOCs before determination.
3.5. Adsorptive equilibration time
Due to the broad-spectrum performance of the PS–AR nanofibers, different types of model substances such as acetone, n-hexane, n-butanol and toluene were chosen to investigate their adsorption equilibration times onto the PS–AR nanofibers. Considering that not exactly the same concentration of target gases was used, the adsorption amount of gas onto the nanofibers was determined using the relative ratio of the peak area using the following formula (3):
 | (3) |
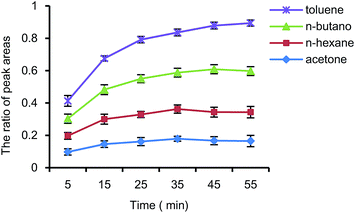
As can be seen from Fig. 9, the adsorption amount of the four substances on the nanofibers increased rapidly before 25 min, and almost leveled off after 35 min, which indicated that the adsorption rate of VOCs onto the nanofibers was fast reaching adsorption equilibration in a short time. So the adsorption time set at 2 hours in this work was more than enough.
3.6. Regeneration
Regeneration of saturated (equilibrated) adsorbents is a critical factor that must be considered while selecting an adsorbent. In the case of ACFs, regeneration can be carried out at the temperature of 150 °C and under the small flow rate of the purging gas, whereas high temperature (350–400 °C) and high gas flow rate are typically required for the regeneration of ACs and other adsorbents.32 As far as CNTs, the regeneration temperature of 120 °C was selected even under a vacuum pressure of 0.145 atm.33The adsorption and desorption cycles of the PS–AR nanofibers were performed as follows: four target compounds, acetone, n-hexane, n-butanol, and toluene, were selected as representative VOCs, then their adsorption onto 5 mg of the PS–AR nanofibers was carried out at 25 °C, and the thermal desorption for the nanofibers was carried out at 80 °C as indicated in the experimental section. After adsorption and thermal desorption, the nanofibers were placed in a headspace vial without the cap and were heated for 4 h at 80 °C to release the adsorbed gas targets. Six consecutive adsorption–desorption cycles were conducted.
In every cycle, the adsorption amount of every compound onto the PS–AR nanofibers was calculated by the difference in the peak areas of the gaseous sample in the sample flask before adsorption and after adsorption equilibrium using formula (3), and the thermal desorption amount was presented using the relative ratio of the peak area using the following formula (4):
 | (4) |
| Rate (%) | VOC | Cycle 1 | Cycle 2 | Cycle 3 | Cycle 4 | Cycle 5 | Cycle 6 |
|---|---|---|---|---|---|---|---|
| Adsorption rate | Acetone | 100.00 | 88.84 | 84.10 | 83.47 | 83.39 | 83.16 |
| n-Hexane | 100.00 | 91.79 | 90.28 | 88.65 | 87.34 | 87.27 | |
| n-Butanol | 100.00 | 96.07 | 94.34 | 92.11 | 92.14 | 92.09 | |
| Toluene | 100.00 | 95.93 | 94.86 | 95.77 | 94.24 | 94.18 | |
| Thermal desorption rate | Acetone | 100.00 | 98.03 | 97.02 | 96.52 | 96.45 | 96.03 |
| n-Hexane | 100.00 | 88.34 | 89.09 | 84.87 | 84.49 | 84.41 | |
| n-Butanol | 100.00 | 92.43 | 92.00 | 91.63 | 91.06 | 91.31 | |
| Toluene | 100.00 | 88.76 | 87.60 | 87.30 | 86.20 | 86.01 |
As shown in Table 2, the adsorption rate and thermal desorption rate of every cycle was almost constant, all above 80%. It seems that the adsorption/thermal desorption efficiency of the nanofibers over six repeated experiments is barely reduced.
Thus it is concluded that the nanofibers possess favorable adsorption/desorption reversibility and can be reutilized. These results are of interest because the nanofibers not only have an acceptable adsorption efficiency at 25 °C, but also can be completely regenerated by heating at 80 °C. The ability of electrospun nanofibers to reversibly adsorb VOCs may be useful for their wider application.
3.7. Temperature effect
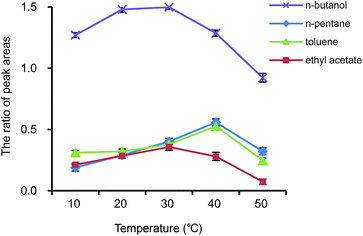
The temperature effect tests on the nanofibers were conducted as follows: four target compounds, n-butanol, n-pentane, toluene and ethyl acetate, were selected as representative VOCs, then their adsorption onto 5 mg of the PS–AR nanofibers was carried out at different temperatures as indicated in the experimental section, and after the adsorption, thermal desorption was carried out in a headspace sampler at 80 °C. The adsorption efficiency of every compound onto the PS–AR nanofibers was calculated using eqn (1), and is presented in Fig. 10.As can be seen from Fig. 10, the adsorption amount of nanofibers for VOCs at different temperature showed a similar varying tendency, that is, n-butanol and ethyl acetate had better adsorption amount at 30 °C while n-pentane and toluene at 40 °C. The results indicated that when the nanofibers were utilized as an adsorbent for the concentration of multiple VOCs, the optimized temperature must be selected due to the temperature effect on the adsorption of the VOCs onto the electrospun nanofibers.
4. Conclusions
The present work investigated the adsorption performance of homemade electrospun nanofibers for VOCs on the selectivity, adsorption/desorption efficiency, adsorption equilibration time, regeneration and temperature effect. It is shown that the adsorption efficiency of the PS–AR nanofibers is comparable to ACFs and CNTs determined per weight unit, and the adsorption efficiency of PS-AR nanofibers is the best if the fibers were determined via per surface unit though the fibers have the least BET surface area among the sorbents studied. Another remarkable characteristic of the PS–AR nanofibers is the possibility to regenerate at relatively low temperature (80 °C). It could be said that the electrospun nanofibers possess the advantages of certain selectivity, preferable adsorption/desorption efficiency, short adsorption equilibration time, favorable reusability, and the temperature effect, and can be used for VOCs adsorption. Thus, electrospun nanofibers can be a potential adsorbent for the VOCs.Acknowledgements
This study was supported by the National Basic Research Program (2012CB933302), the National Instrumental Research Program (2014YQ06077303), the National Science Foundation of China (No. 81172720), and the Suzhou Science and Technology Department Foundation (Grant No. ZXG201441).References
- M. R. Ras-Mallorquí, R. M. Marcé-Recasens and F. Borrull-Ballarín, Talanta, 2007, 72, 941–950 CrossRef PubMed.
- M. Li, S. Biswas, M. H. Nantz, R. M. Higashi and X. Fu, Anal. Chem., 2012, 84, 1288–1293 CrossRef CAS PubMed.
- M. R. Ras, F. Borrull and R. M. Marcé, TrAC, Trends Anal. Chem., 2009, 28, 347–361 CrossRef CAS.
- Y. Z. Tang, Q. Tran, P. Fellin, W. K. Cheng and I. Drummond, Anal. Chem., 1993, 65, 1932–1935 CrossRef CAS.
- T. Knobloch and W. Engewald, J. High Resolut. Chromatogr., 1995, 18, 635–642 CrossRef CAS.
- Y. Shih and M. Li, J. Hazard. Mater., 2008, 154, 21–28 CrossRef CAS PubMed.
- M. Ulman and Z. Chilmonczyk, Chem. Anal., 2007, 52, 173–200 CAS.
- M. S. Mauter and M. Elimelech, Environ. Sci. Technol., 2008, 42, 5843–5859 CrossRef CAS PubMed.
- J. C. Crittenden, J. Environ. Eng., 1987, 113, 1361 Search PubMed.
- K. P. Singh, D. Mohan, G. S. Tandon and G. Gupta, Ind. Eng. Chem. Res., 2002, 41, 2480–2486 CrossRef CAS.
- E. Díaz, S. Ordóñez and A. Vega, J. Colloid Interface Sci., 2007, 305, 7–16 CrossRef PubMed.
- Q. Li, D. Yuan and Q. Lin, J. Chromatogr. A, 2004, 1026, 283–288 CrossRef CAS PubMed.
- C. M. Hussain, C. Saridara and S. Mitra, J. Chromatogr. A, 2008, 1185, 161–166 CrossRef CAS PubMed.
- R. Sitko, B. Zawisza and E. Malicka, TrAC, Trends Anal. Chem., 2012, 37, 22–31 CrossRef CAS.
- H. Bagheri and A. Aghakhani, Anal. Methods, 2011, 3, 1284–1289 RSC.
- H. Bagheri, A. Aghakhani, M. Baghernejad and A. Akbarinejad, Anal. Chim. Acta, 2012, 716, 34–39 CrossRef CAS PubMed.
- X. Kang, C. Pan, Q. Xu, Y. Yao, Y. Wang, D. Qi and Z. Gu, Anal. Chim. Acta, 2007, 587, 75–81 CrossRef CAS PubMed.
- F. Fang, X. J. Kang, Z. Y. Liu, Y. Q. Ma and Z. Z. Gu, Chin. Chem. Lett., 2009, 20, 1491–1494 CrossRef CAS.
- Z. Liu, X. Kang and F. Fang, Microchim. Acta, 2010, 168, 59–64 CrossRef CAS.
- L. Q. Chen, X. J. Kang, J. Sun, J. J. Deng, Z. Z. Gu and Z. H. Lu, J. Sep. Sci., 2010, 33, 2369–2375 CrossRef CAS PubMed.
- X. Kang, L. Chen, Y. Wang, Y. Zhang and Z. Gu, Biomed. Microdevices, 2009, 11, 723–729 CrossRef CAS PubMed.
- Y. Zhang, X. Kang, L. Chen, C. Pan, Y. Yao and Z. Gu, Anal. Bioanal. Chem., 2008, 391, 2189–2197 CrossRef CAS PubMed.
- D. Qi, X. Kang, L. Chen, Y. Zhang, H. Wei and Z. Gu, Anal. Bioanal. Chem., 2008, 390, 929–938 CrossRef CAS PubMed.
- X. J. Kang, L. Q. Chen, Y. Y. Zhang, Y. W. Liu and Z. Z. Gu, J. Sep. Sci., 2008, 31, 3272–3278 CrossRef CAS PubMed.
- Y. Yan, J. Deng, S. Deng, Y. Wang, F. Wang, M. Xiao and X. Kang, J. Southeast Univ., 2012, 28, 464–468 CAS.
- C. Burger, B. S. Hsiao and B. Chu, Annu. Rev. Mater. Res., 2006, 36, 333–368 CrossRef CAS.
- C. Feng, K. C. Khulbe and S. Tabe, Desalination, 2012, 287, 98–102 CrossRef CAS.
- K. Kim, M. Kang, I. Chin and H. Jin, Macromol. Res., 2005, 13, 533–537 CrossRef CAS.
- J. V. Nygaard, T. Uyar, M. Chen, P. Cloetens, P. Kingshott and F. Besenbacher, Nanoscale, 2011, 3, 3594–3597 RSC.
- Z. Khatri, R. A. Arain, A. W. Jatoi, G. Mayakrishnan, K. Wei and I. Kim, Cellulose, 2013, 20, 1469–1476 CrossRef CAS.
- M. Gopiraman, H. Bang, G. Yuan, C. Yin, K. Song, J. S. Lee, I. M. Chung, R. Karvembu and I. S. Kim, Carbohydr. Polym., 2015, 132, 554–564 CrossRef CAS PubMed.
- D. Das, V. Gaur and N. Verma, Carbon, 2004, 42, 2949–2962 CrossRef CAS.
- S. Hsu, C. Lu, F. Su, W. Zeng and W. Chen, Chem. Eng. Sci., 2010, 65, 1354–1361 CrossRef CAS.
| This journal is © The Royal Society of Chemistry 2015 |

