DOI:
10.1039/C5RA22568J
(Paper)
RSC Adv., 2015,
5, 105600-105608
Discovering new DNA gyrase inhibitors using machine learning approaches†
Received
28th October 2015
, Accepted 4th December 2015
First published on 7th December 2015
Abstract
Bacterial DNA gyrase is not expressed in eukaryotes. It is a promising target for broad-spectrum antibiotics. This paper reports new DNA gyrase inhibitors as broad-spectrum antibacterial agents discovered by means of target-based in silico and in vitro models. Two machine learning methods (naïve Bayesian and recursive partitioning) were employed to build in silico models based on physicochemical descriptors and structural fingerprints. For both training and testing sets, the overall predictive accuracies of the best in silico models were greater than 80%. The best 11 models were used to virtually screen a molecular database to identify DNA gyrase inhibitors. The in vitro models were used to verify the virtual hits activities against Escherichia coli, methicillin-resistant Staphylococcus aureus and other bacteria, and DNA gyrase. The MIC values of the confirmed DNA gyrase inhibitors range between 1 and 32 μg mL−1 and, the relative inhibition rates of the inhibitors range between 42% to 75% at 1 μM. Cell-based cytotoxicity assays demonstrated that the confirmed DNA gyrase inhibitors were not toxic. In silico studies indicated that the new DNA gyrase inhibitors have similar binding modes to the reported inhibitors.
1. Introduction
Growing multidrug-resistant bacteria and declining available antibacterial agents are threating public health.1–3 New agents against drug-resistant bacteria are demanded.4,5 DNA gyrase is a promising antibacterial drug target because it is required for all bacteria, and is absent in eukaryotes. DNA gyrase is a type II topoisomerase that mediates negative supercoiling to relaxed closed circular DNA6,7 and is well-studied as an anti-bacterial target.8,9 However, only one compound (ETX0914) is in clinical trials. Others DNA gyrase inhibitors are failures due to side effects or poor bioavailability.
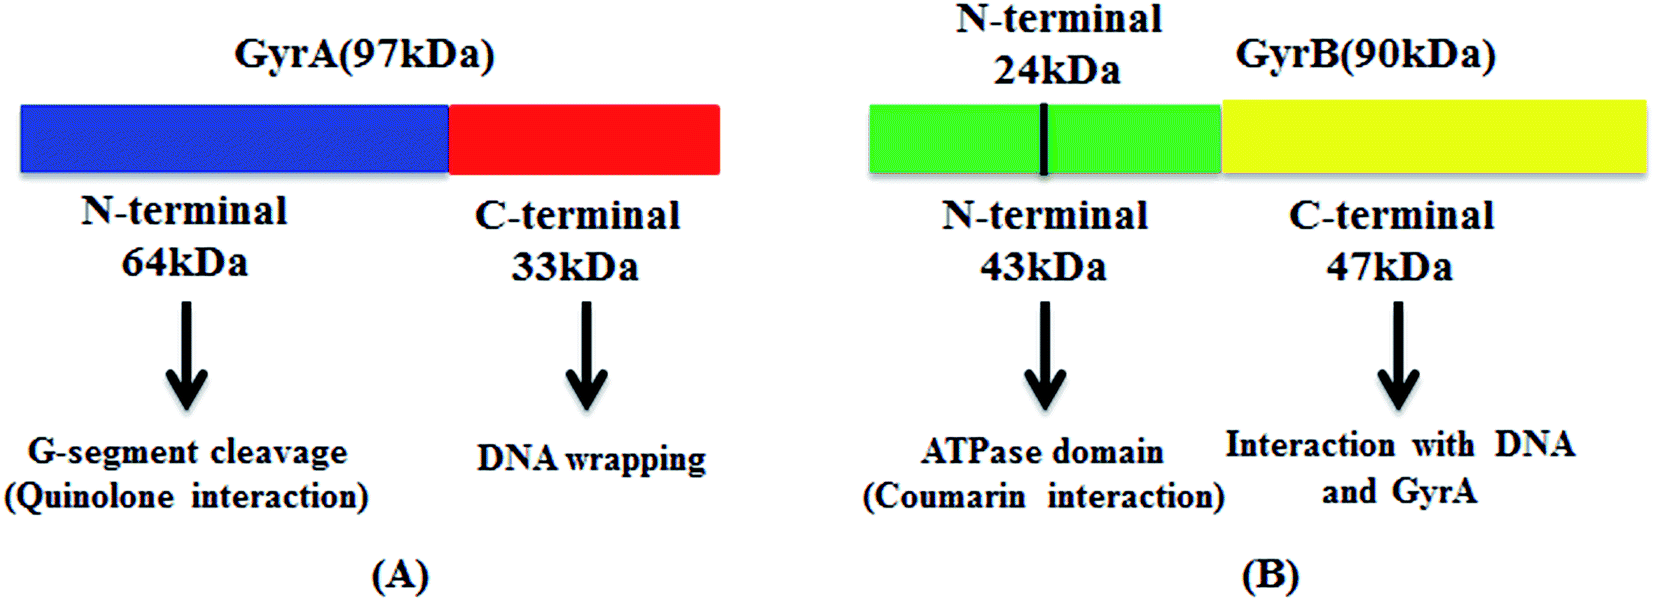
DNA gyrase is a hetero tetramer made up of two GyrA and two GyrB subunits.8 GyrA consists of two stable fragments GyrA33 and GyrA64.10 GyrA64 catalyzes supercoiling reaction while the GyrB exists and, associates with DNA cleavage and ligation under the condition of holoenzyme. GyrA33 directly effects on DNA and forms DNA-enzyme complex that catalyzes supercoiling reaction together with GryA64 and GyrB.11,12 In the same way, GyrB consists of fragments GyrB43 and GyrB47. The N-terminal of GyrB43 hydrolyses ATP. As a part of GyrB43, GyrB24 binds DNA gyrase inhibitors such as novobiocin,13 aminocoumarin13,14 and cyclothialidine;15,16 the C-terminal GyrB47 catalyzes supercoiling DNA to relaxed DNA in the presence of GyrA (Fig. 1).17,18
 |
| | Fig. 1 The hetero components of DNA gyrase. | |
DNA gyrase inhibitors (such as, GSK299423, NXL101 and gyramide) contain either have quinolone scaffold (A)19,20 or aminocoumarins scaffold (B)21 (Fig. 2). Quinolones may inhibit supercoiling activity or, induce DNA double-strand breaking. As examples of scaffold A, fluoroquinolones (FQ) are bacterial topoisomerase inhibitors.22 The aminocoumarins (such as aminopyrazinamides, hiazolopyridine ureas, and pyrrolamides) are the competitive inhibitors of ATP hydrolysis, and inhibit DNA supercoiling activities.23–25
 |
| | Fig. 2 Chemical scaffolds of quinolones (A) and aminocoumarins (B). | |
So far, only three anti drug-resistant bacteria agents (daptomycin, linezolid and bedaquiline) were reported since 1960. DNA gyrase (an anti drug-resistant bacteria drug target) has only one compound (ETX0914), which is under phase II clinical trials.25 It is demanded for new DNA gyrase inhibitors. Known DNA gyrase inhibitors have diverse scaffolds (Fig. 3), which mean that the active sites of the target can adopt diversified ligand shapes. The relations between structures and DNA gyrase inhibitory activities cannot be assumed as being linear or other continuous functional. Hence, we employ two machine learning approaches, naïve Bayesian (NB) learning and recursive partitioning (RP) approaches to generate virtual screening models from target-based DNA gyrase inhibitory data.26 To assure the robustness of the models, we evaluated the models by means of 5-fold cross validations. An external testing data set was also used to test the models. Then, the models were used to virtually screen an in-house compound library, which consisted of 488 tangible compounds.27,28 The virtual hits were validated with cell-based and target-based microbial assays, and following with cytotoxicity assays. The binding modes of confirmed DNA gyrase inhibitors were investigated.
 |
| | Fig. 3 The structures of known DNA gyrase inhibitors. | |
2. Materials and methods
2.1 Data for generating virtual screening models
The DNA gyrase inhibitor bioassay data were extracted from the ChEMBL29 and BindingDB databases by taking target-based Escherichia coli strain bioassay data. Duplicated records or records without IC50 values were removed. This resulted in 137 DNA gyrase inhibitors with IC50 values ranging from 0.9 to 1![[thin space (1/6-em)]](https://www.rsc.org/images/entities/char_2009.gif) 000000 nM. These compounds were categorized into positives and negatives based upon their IC50 values (the compounds with IC50 values less than or equal to 5 μM were marked with “1” for positives. Others were marked with “0” for negatives). The entire data set was randomly divided into four portions. A training set was made of the three portions containing 103 compounds. The remaining portion was used as a testing set containing 34 compounds.30 This process was done with DS (Discovery Studio 3.5, Accelrys, San Diego, USA). The detailed process can be examined in ESI.†
000000 nM. These compounds were categorized into positives and negatives based upon their IC50 values (the compounds with IC50 values less than or equal to 5 μM were marked with “1” for positives. Others were marked with “0” for negatives). The entire data set was randomly divided into four portions. A training set was made of the three portions containing 103 compounds. The remaining portion was used as a testing set containing 34 compounds.30 This process was done with DS (Discovery Studio 3.5, Accelrys, San Diego, USA). The detailed process can be examined in ESI.†
2.2 Molecular descriptor calculation and selection
The molecular descriptors of the data set were computed with MOE 2013.08 (CCG, Montreal, Canada) and DS, resulting in 192 MOE molecular descriptors and 252 DS molecular descriptors for each compound in the data set.
With Pearson correlation analyses, the redundant molecular descriptors (selective ratio > 0.9) were removed, the molecular descriptors (selective ratio < 0.1), which were unrelated to the DNA gyrase inhibitory activities, were excluded.27,28,31 This resulted in 36 MOE descriptors and 15 DS descriptors (Table 1).
Table 1 Selected molecular descriptors
| Class |
Number |
Descriptor |
| MOE |
36 |
GCUT_PEOE_0, GCUT_SLOGP_0, GCUT_SLOGP_1, GCUT_SLOGP_2, GCUT_SLOGP_3, GCUT_SMR_0, GCUT_SMR_1, GCUT_SMR_2, PEOE_VSA+0, PEOE_VSA+1, PEOE_VSA+2, PEOE_VSA+3, PEOE_VSA+4, PEOE_VSA+5, PEOE_VSA+6, PEOE_VSA−0, PEOE_VSA−2, PEOE_VSA−3, PEOE_VSA_FPOS, SMR_VSA2, SMR_VSA3, SMR_VSA6, SMR_VSA7, SlogP, SlogP_VSA4, SlogP_VSA8, a_ICM, ast_violation_ext, b_max1len, b_rotR, mutagenic, petitjeanSC, reactive, rsynth, vsa_acc, vsa_hyd |
| DS |
15 |
E_DIST_equ, SIC, CHI_V_3_P, JX, HBA_Count, HBD_Count, NPlusO_Count, Num_Hydrogens, Num_RingBonds, Num_AromaticBonds, Num_RingAssemblies, Num_Rings6, Num_AliphaticDoubleBonds, Num_TerminalRotomers, Num_TrueStereoAtoms |
2.3 Structural fingerprints calculation
Structural fingerprints were calculated using DS software. The fingerprints consist of daylight-style path-based fingerprints and SciTegic extended-connectivity fingerprints.
2.4 Machine learning approaches
Two machine learning methods, NB and RP, were applied through DS software.
2.4.1 NB method. NB method is a supervised learning approach, and directly calculates the overall distribution based on the prior distribution of parameters and the posterior distribution of parameters obtained from the sample data. The method is based on the Bayes' theorem and the maximum posteriori hypothesis,32 requires the training objects are marked with positives or negatives.33
2.4.2 RP method. RP (or decision tree) is a statistical method for multivariable analysis and, based on hierarchical rules. It creates a decision tree to describe the relationship between an active and a set of properties/descriptors of objects.34,35
2.5 Decoys generation
The decoy data were generated from DUD-E36 (http://dude.docking.org/) through the Pipeline Pilot 7.5 module of DiscoveryStudio. 10 diverse compounds were used as reference compounds, which were randomly selected from the positives in the input data set. The decoys were selected from DUD-E based upon the dissimilarity to the reference compounds. 80 decoys, which were regarded as negatives, were selected for external tests.
2.6 Method for model performance evaluation
A 5-fold cross validation was used to evaluate the performances of NB and RP models. True positives (TP), true negatives (TN), false positives (FP), false negatives (FN), sensitivity (SE), specificity (SP), overall predictive accuracy (Q), the Matthews correlation coefficient (C) and the receiver operating characteristic (ROC) curve were defined as follows to measure the performance:37
2.7 Compound library for virtual screening campaigns
The in-house tangible compound library, which contains 488 natural products or chemically modified natural products, were virtually screened with the best machine learning models.
2.8 In vitro antimicrobial assay
2.8.1 Minimum inhibitory concentration testing. The test was performed to determine the minimum concentration of the indicated agent necessary to inhibit visible growth of bacteria. In this study, our compounds were tested against bacteria including MRSA ST239, MRSA ST5, MRSA 252, Staphylococcus aureus, Fecal bacteria, Staphylococcus epidermidis, Pneumonia, ATCC 25922 and Shigella flexneri. Ampicillin and vancomycin sodium were used as positive control agents. The MIC values were determined using Mueller–Hinton broth method based on national committee for clinical laboratory standard.38,39 Each compound was tested for 11 concentrations (256, 128, 64, 32, 16, 8, 4, 2, 1, 0.5, 0.25 μg mL−1). 90 μL bacterial culture medium was added into the first column of wells of flat bottomed 96-well tissue culture plates, and other wells were added with 50 μL same medium, and then 10 μL solution of compound was added into the first column of wells. Then, 50 μL mixture extracted from the first column wells were transferred to the second column of wells, and repeated this operation column by column till the second last column of wells. After this step, the 50 μL bacterial culture solutions in last column of wells were discarded. Finally, 50 μL bacterial solution was diluted by culture medium, and added into all wells in the 96-well plate. The last row wells were for positive controls, and the last column wells were for negative controls. The plates were incubated at 37 °C overnight in electro-heating standing-temperature cultivator before the measurement of the absorbance value. We used a multifunction microplate reader to measure the optical density values at 600 nm. Each antimicrobial assay was replicated four times.
2.9 DNA gyrase expression and purification
The recombinant protein was expressed with plasmids pET-15-GyrA and pET-15b-GyrB in E. coli, and purified using Ni-NTA column. After the SDS-PAGE verification, we mixed GyrA and Gry B at 1:1 molar ratio, and incubated on ice for 30 min before DNA supercoiling assay.39
2.10 DNA gyrase-mediated pHOT-1 supercoiling assay
The DNA supercoiling assay was conducted to test the inhibitory activity on the enzyme reaction. Firstly, 4 μL 5 × DNA gyrase assay buffer, 0.1 U relaxed pHOT-1 DNA and 12.9 μL ddH2O were mixed.38 Then, 17 μL mixture mentioned above, 2 μL compounds and 1 μL reconstituted DNA gyrase were mixed, and incubated at 37 °C. After 1 h, 4 μL 5 × stop buffer was added to stop the reaction. Novobiocin was used as positive control, and 1% DMSO was employed as blank control. To separate the DNA products, electrophoresis on a 1% agarose gel run used. The gel was stained for 20 min in ethidium bromide, decolored for 15 min in water and visualized with UV light. The optical density of the bands for supercoiling and relaxed DNA was quantified using the Quantity One software. The inhibition rates were used to calculate the IC50 values with GraphPad Prism 5. The IC50 values were measured with 7 concentration points, and repeated for three times.
2.11 Cytotoxicity assay
HEK-293, a human embryonic kidney normal cell line, was used to evaluate the cytotoxicity of the compounds. HEK-293 cells were inoculated in 96-well plates with DMEM medium containing 10% fetal bovine serum at 37 °C in 5% CO2 incubator. Then, the cells were intervened with different compounds at 20 μM for 24 h after cells were adherent and each compound was added into three parallel double wells. Blank control group and empty wells were prepared. Then 20 μL 2.5 mg mL−1 MTT was added to each well and incubated for 4 h, and 100 μL DMSO was added every well lastly. Absorption values were measured at 492 nm after 20 minutes' oscillation. The inhibition rate of each compound against 293T cell lines was calculated with the following formula: inhibition of cell (%) = 1 − (Aexperimental group − Ablank)/(Acontrol group − Ablank) × 100%.40
2.12 Molecular docking
The intact DNA gyrase (PDB code: 3G7E)25 was used as the template to explore the binding modes of the confirmed DNA gyrase inhibitors. The structure data was processed using a protocol from Schrödinger software 2013.01 (Schrödinger Inc., New York, USA). The active compounds were prepared by Ligprep module in the Schrödinger software. The extra precision Glide 5.9 (ref. 41–43) of Schrödinger software was used to dock the active compound structures into the binding pocket of the DNA gyrase. The active compounds were also superimposed with the native ligand using WEGA algorithm44 to ensure the correct docking pose.
3. Results
3.1 Classifiers derived from molecular descriptors or structural fingerprints
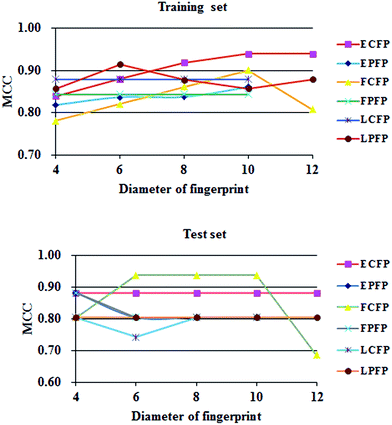
Fig. 4 indicates that the size (the diameter of a fingerprint) of a structural fingerprint or the type (ECFP, etc.) of a structural fingerprint can change the model performance (MCC value). But, there is no general trend. SciTegic extended-connectivity fingerprints resulted in better performance in general.
 |
| | Fig. 4 The relations among MCCs and fingerprint sizes or types. | |
Table 2 lists the performance parameters of top-10 machine learning models running on training set and testing set. The top-10 models were all generated from NB method with overall predictive accuracies greater than 94.1% for both training set and test set. For the testing set, the models using FCFP_6, FCFP_8 and FCFP_10 fingerprints achieved better performances with the sensitivity of 95.4%, the specificity of 100.0%, overall prediction accuracies of 97.1%, and the AUC value of 0.992.
Table 2 Performances of top-10 models using descriptorsa or fingerprints
| Models |
Training set |
| TP |
FN |
TN |
FP |
SE |
SP |
C |
AUC |
Q |
| The models using descriptors are not listed in this table because they are not ranked in the top-10 models. |
| FCFP_6 |
56 |
6 |
38 |
3 |
0.903 |
0.927 |
0.821 |
0.918 |
0.913 |
| FCFP_8 |
57 |
5 |
39 |
2 |
0.919 |
0.951 |
0.861 |
0.914 |
0.932 |
| FCFP_10 |
58 |
4 |
40 |
1 |
0.935 |
0.976 |
0.902 |
0.911 |
0.951 |
| ECFP_4 |
57 |
5 |
38 |
3 |
0.919 |
0.927 |
0.840 |
0.926 |
0.922 |
| ECFP_6 |
58 |
4 |
39 |
2 |
0.935 |
0.951 |
0.880 |
0.923 |
0.942 |
| ECFP_8 |
60 |
2 |
39 |
2 |
0.968 |
0.951 |
0.919 |
0.92 |
0.961 |
| ECFP_10 |
60 |
2 |
40 |
1 |
0.968 |
0.976 |
0.940 |
0.919 |
0.971 |
| ECFP_12 |
60 |
2 |
40 |
1 |
0.968 |
0.976 |
0.940 |
0.919 |
0.971 |
| EPFP_4 |
57 |
5 |
37 |
4 |
0.919 |
0.902 |
0.819 |
0.893 |
0.913 |
| FPFP_4 |
56 |
6 |
39 |
2 |
0.903 |
0.951 |
0.843 |
0.889 |
0.922 |
| Models |
Testing set |
| TP |
FN |
TN |
FP |
SE |
SP |
C |
AUC |
Q |
| FCFP_6 |
21 |
1 |
12 |
0 |
0.954 |
1.000 |
0.939 |
0.992 |
0.971 |
| FCFP_8 |
21 |
1 |
12 |
0 |
0.954 |
1.000 |
0.939 |
0.992 |
0.971 |
| FCFP_10 |
21 |
1 |
12 |
0 |
0.954 |
1.000 |
0.939 |
0.992 |
0.971 |
| ECFP_4 |
20 |
2 |
12 |
0 |
0.909 |
1.000 |
0.883 |
0.992 |
0.941 |
| ECFP_6 |
20 |
2 |
12 |
0 |
0.909 |
1.000 |
0.883 |
0.989 |
0.941 |
| ECFP_8 |
20 |
2 |
12 |
0 |
0.909 |
1.000 |
0.883 |
0.989 |
0.941 |
| ECFP_10 |
20 |
2 |
12 |
0 |
0.909 |
1.000 |
0.883 |
0.989 |
0.941 |
| ECFP_12 |
20 |
2 |
12 |
0 |
0.909 |
1.000 |
0.883 |
0.989 |
0.941 |
| EPFP_4 |
20 |
2 |
12 |
0 |
0.909 |
1.000 |
0.883 |
0.989 |
0.941 |
| FPFP_4 |
20 |
2 |
12 |
0 |
0.909 |
1.000 |
0.883 |
0.973 |
0.941 |
3.2 Performance of models using combined molecular descriptors and structural fingerprints
Descriptors (physiochemical properties) and fingerprints (substructures) represent different attributions of compound structures. We thought the models using both might result in better performances. 54 NB models and 324 RP models generated from the combinations of descriptors and fingerprints (detailed modeling data can be found in ESI Table S4 and S5 and Fig. S4 and S5†). The top-10 models are listed in Table 3.
Table 3 Top-10 models using combined descriptors and fingerprints
| Models |
Training set |
| TP |
FN |
TN |
FP |
SE |
SP |
C |
AUC |
Q |
| RP models. MOE: descriptors calculated from MOE software. DS: descriptors calculated from DS software. |
| MOEb+ECFP_4-4a |
28 |
13 |
56 |
6 |
0.683 |
0.903 |
0.610 |
0.793 |
0.816 |
| MOE+FPFP_4-4a |
28 |
13 |
56 |
6 |
0.683 |
0.903 |
0.610 |
0.793 |
0.816 |
| MOE+EPFP_8 |
58 |
4 |
36 |
5 |
0.935 |
0.878 |
0.817 |
0.915 |
0.913 |
| FCFP_6 |
56 |
6 |
38 |
3 |
0.903 |
0.927 |
0.821 |
0.918 |
0.913 |
| FCFP_8 |
57 |
5 |
39 |
2 |
0.919 |
0.951 |
0.861 |
0.914 |
0.932 |
| FCFP_10 |
58 |
4 |
40 |
1 |
0.935 |
0.976 |
0.902 |
0.911 |
0.951 |
| DSc+EPFP_4-5a |
27 |
14 |
61 |
1 |
0.659 |
0.984 |
0.707 |
0.8226 |
0.854 |
| DS+EPFP_4 |
57 |
5 |
38 |
3 |
0.919 |
0.927 |
0.840 |
0.894 |
0.922 |
| DS+FPFP_4 |
54 |
8 |
39 |
2 |
0.871 |
0.951 |
0.808 |
0.892 |
0.903 |
| MOE+EPFP_4 |
59 |
3 |
37 |
4 |
0.952 |
0.902 |
0.858 |
0.894 |
0.932 |
| Models |
Test set |
| TP |
FN |
TN |
FP |
SE |
SP |
C |
AUC |
Q |
| MOE+ECFP_4-4a |
22 |
0 |
1 |
0 |
2.000 |
1.000 |
1.000 |
0.800 |
0.909 |
| MOE+FPFP_4-4a |
22 |
0 |
12 |
0 |
1.000 |
1.000 |
1.000 |
1.000 |
1.000 |
| MOE+EPFP_8 |
21 |
1 |
12 |
0 |
0.955 |
1.000 |
0.939 |
0.992 |
0.971 |
| FCFP_6 |
21 |
1 |
12 |
0 |
0.955 |
1.000 |
0.939 |
0.992 |
0.971 |
| FCFP_8 |
21 |
1 |
12 |
0 |
0.955 |
1.000 |
0.939 |
0.992 |
0.971 |
| FCFP_10 |
21 |
1 |
12 |
0 |
0.955 |
1.000 |
0.939 |
0.992 |
0.971 |
| DS+EPFP_4-5a |
22 |
0 |
11 |
1 |
1.000 |
0.917 |
0.936 |
0.958 |
0.971 |
| DS+EPFP_4 |
20 |
2 |
12 |
0 |
0.909 |
1.000 |
0.883 |
0.970 |
0.941 |
| DS+FPFP_4 |
20 |
2 |
12 |
0 |
0.909 |
1.000 |
0.883 |
0.973 |
0.941 |
| MOE+EPFP_4 |
20 |
2 |
12 |
0 |
0.909 |
1.000 |
0.883 |
0.985 |
0.941 |
Comparing Tables 2 and 3, we find that NB models using combined molecular descriptors and structural fingerprints are actually worse than the NB models using molecular descriptors or structural fingerprints. However, the RP models using combined molecular descriptors and structural fingerprints can result better performance than the ones of using non-combined descriptors or fingerprints.
3.3 Determining and external testing final models
Combining Tables 2 and 3, we get top-11 models after removed duplicated models. The 11 final models were tested with the external testing data set. Table 4 lists the results.
Table 4 The external testing results for the top-11 final models
| Models |
Test set |
| TP |
FN |
TN |
FP |
SE |
SP |
C |
AUC |
Q |
| FCFP_10 |
9 |
2 |
95 |
14 |
0.818 |
0.872 |
0.506 |
0.927 |
0.867 |
| DS+FPFP_4 |
91 |
18 |
11 |
0 |
0.835 |
1.000 |
0.563 |
0.583 |
0.850 |
| DS+EPFP_4-5* |
91 |
18 |
11 |
0 |
0.835 |
1.000 |
0.563 |
0.583 |
0.850 |
| FCFP_8 |
13 |
11 |
93 |
9 |
0.542 |
0.912 |
0.469 |
0.505 |
0.841 |
| ECFP_6 |
13 |
11 |
93 |
9 |
0.542 |
0.912 |
0.469 |
0.505 |
0.841 |
| MOE+FPFP_4 |
13 |
11 |
93 |
9 |
0.54 |
0.912 |
0.469 |
0.505 |
0.841 |
| MOE+ECFP_4-4* |
13 |
11 |
93 |
9 |
0.54 |
0.912 |
0.469 |
0.505 |
0.841 |
| FPFP_4 |
2 |
17 |
90 |
4 |
0.105 |
0.957 |
0.105 |
0.764 |
0.814 |
| MOE+EPFP_8 |
2 |
17 |
89 |
5 |
0.105 |
0.947 |
0.081 |
0.501 |
0.805 |
| FCFP_6 |
12 |
6 |
66 |
29 |
0.667 |
0.695 |
0.275 |
0.505 |
0.690 |
| MOE+EPFP_4 |
16 |
3 |
52 |
44 |
0.842 |
0.553 |
0.296 |
0.666 |
0.602 |
The overall prediction accuracies of the final models are greater than 80% (except models FCFP_6, MOE+EPFP_4). The top model (FCFP_10) was generated from NB method (see the first row in Table 4).
3.4 Virtual screening DNA gyrase inhibitors with the final models
Our in-house library, which has 488 tangible compounds, was virtually screened with the top-11 predictive models (Table 4), which consist of nine NB models, and two RP models. The NB models resulted in 67 hits, and the RP models resulted in 19 hits. By combining the two hit sets, we got 76 initial hits without duplicates. The initial hits were further refined by scaffold analyzing processes, which removed known antibacterial scaffolds (such as, flavone derivatives), and resulted in 24 refined hits. These refined hits were tested with cell-based microbiological assays. The flow-chart of discovering new DNA gyrase inhibitors using machine learning approaches is depicted in Fig. 5.
 |
| | Fig. 5 The flow-chart of discovering new DNA gyrase inhibitors using machine learning approaches. | |
3.5 Cell-based microbiological assay results
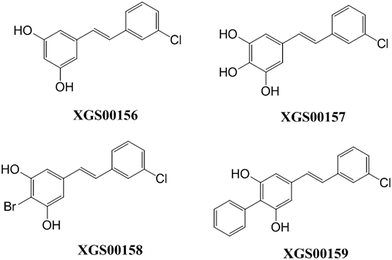
Both G+ and G− strains were tested in the cell-based microbiological assays. Ampicillin sodium and vancomycin sodium were used as positive controls. 4 compounds actively inhibited E. coli and MRSA strains (XGS00156, XGS00157, XGS00158 and XGS00159). As shown in Table 5, the 4 active compounds have MIC values < 10 μM. The advantages of the 4 compounds are that these compounds exhibited broader spectrum of antibacterial activities than ampicillin or vancomycin. The activities of compound XGS00159 are comparable with the ones of ampicillin or vancomycin. All active compounds share the same scaffold. Their initial SAR is established (Fig. 6).
Table 5 Cell-based microbiological study results (μM)
| ID |
G+a |
G−a |
| MRSA ST239 |
MRSA ST5 |
MRSA 252 |
ATCC 29213 |
ATCC 29212 |
ATCC 12228 |
Pneumonia |
ATCC 25922 |
CMCC 51572 |
| MRSA: methicillin resistant Staphylococcus aureus, ATCC 29213: Staphylococcus aureus, ATCC 29212: Fecal bacteria, ATCC 12228: Staphylococcus epidermidis, ATCC 25922: Escherichia coli, CMCC 51572: Shigella flexneri. Amp: ampicillin sodium. WG: vancomycin sodium, positive control. |
| XGS00156 |
16.42 |
15.42 |
15.42 |
15.42 |
— |
15.42 |
7.71 |
3.85 |
61.67 |
| XGS00157 |
32.01 |
65.67 |
131.34 |
16.42 |
— |
32.84 |
131.34 |
8.21 |
— |
| XGS00158 |
10.17 |
20.35 |
10.17 |
10.17 |
— |
10.50 |
5.09 |
5.09 |
81.4 |
| XGS00159 |
5.04 |
5.04 |
5.04 |
5.04 |
— |
5.04 |
2.52 |
5.04 |
— |
| Ampb |
— |
— |
— |
— |
— |
2 |
2 |
2 |
2 |
| WGc |
2 |
2 |
2 |
2 |
2 |
2 |
2 |
— |
— |
 |
| | Fig. 6 Initial SAR of 4 confirmed hits. | |
3.6 DNA supercoiling assay results
The 4 compounds were tested with DNA supercoiling assays. Novobiocin was used as a positive control. The results were depicted in Fig. 7, and indicated that the 4 compounds dose-dependently inhibited DNA supercoiling. Thus, the 4 compounds have been proved that they are DNA gyrase inhibitors.
 |
| | Fig. 7 DNA supercoiling assay results for the 4 compounds (XGS00156, XGS00157, XGS00158 and XGS00159). R: relaxed DNA; Sc: supercoiled DNA; M: marker; −: negative control; S: activity of enzyme; G: 1% DMSO; N: positive control, novobiocin. | |
3.7 Cytotoxicity assay results
Fig. 8 depicts the cytotoxicity assay results for the 4 active compounds. At 20 μM, two active compounds inhibited <5% of 293T cell lines, other two compounds inhibited <30% of 293T cell lines. Thus, the 4 active compounds are considered as promising drug leads, and worth further lead optimization processing.40
 |
| | Fig. 8 Cytotoxicity assay results. | |
3.8 Molecular docking study results
The 4 compounds were docked to the crystal structure (3G7E), in which the native ligand was removed. The docking processes were executed with both the extra precision Glide and WEGA algorithm. The docking poses of the compounds were consistent. This demonstrated that the docking processes were reliable. Fig. 9 depicts the binding modes of the 4 active compounds. All 4 compounds have the similar interactions with the known key residues, such as WOW 408 or Asp 73, which is a hydrogen bond donor. The hydrophobic groups of the compounds interact with the receptor hydrophobic pocket (Val 43, Met 95, Ile 94, Val 123, Leu 132 and Val 167).45,46 Thus, these active compounds binding modes support the observations of the in vitro results.
 |
| | Fig. 9 Molecular docking study results. (A): Binding mode of XGS00156; (B): binding mode of XGS00157; (C): binding mode of XGS00158; (D): binding mode of XGS00159. The molecules in orange are the active compounds; the residues in blue donor hydrogen bonds; the residues in red provide hydrophobic interactions. The deep blue dashed lines represent hydrogen bonds. | |
4. Conclusions
DNA gyrase is a promising drug target, but, there are not many DNA gyrase inhibitors under clinic trails. Existing DNA gyrase inhibitors are structurally diverse, it would be difficult to discover novel DNA gyrase inhibitors through structure-based molecular design, or individual ligand-based modeling technology, or traditional QSAR techniques. This work demonstrates that we can discover a novel scaffold of DNA gyrase inhibitors by combining multiple machine learning methods and target-based approaches. There are many ways to build virtual screening models due to many types of structural descriptors or fingerprints. Since we did not discover specific descriptors or fingerprints were particular superior to the others for the virtual screening campaign. To do our best to include excellent virtual screening models, we have explored 424 machine learning models derived from the combinations of the descriptors or fingerprints. The confirmed hits were generated from the top-11 models.
Conflict of interest
The authors declare no competing financial interest.
Acknowledgements
This work was supported by the National Science Foundation of China (81173470), National High Technology Research and Development Program of China (863 Program, 2012AA020307), National Supercomputer Center in Guangzhou (2012Y2-00048/2013Y2-00045, 201200000037), the introduction of innovative R&D team program of Guangdong Province (2009010058), Guangdong Provincial Key Laboratory of Construction Foundation (2011A060901014), and the Fundamental Research Funds for the Central Universities (2013HGCH0015).
Notes and references
- R. Janupally, B. Medepi, P. Brindha Devi, P. Suryadevara, V. U. Jeankumar, P. Kulkarni, P. Yogeeswari and D. Sriram, Chem. Biol. Drug Des., 2015, 86, 918–925 CAS.
- S. B. Singh, D. E. Kaelin, J. Wu, L. Miesel, C. M. Tan, P. T. Meinke, D. Olsen, A. Lagrutta, P. Bradley, J. Lu, S. Patel, K. W. Rickert, R. F. Smith, S. Soisson, C. Wei, H. Fukuda, R. Kishii, M. Takei and Y. Fukuda, ACS Med. Chem. Lett., 2014, 5, 609–614 CrossRef CAS PubMed.
- G. S. Basarab, J. I. Manchester, S. Bist, P. A. Boriack-Sjodin, B. Dangel, R. Illingworth, B. A. Sherer, S. Sriram, M. Uria-Nickelsen and A. E. Eakin, J. Med. Chem., 2013, 56, 8712–8735 CrossRef CAS PubMed.
- L. Feng, M. M. Maddox, M. Z. Alam, L. S. Tsutsumi, G. Narula, D. F. Bruhn, X. Wu, S. Sandhaus, R. B. Lee, C. J. Simmons, Y. C. Tse-Dinh, J. G. Hurdle, R. E. Lee and D. Sun, J. Med. Chem., 2014, 57, 8398–8420 CrossRef CAS PubMed.
- H. Nimesh, S. Sur, D. Sinha, P. Yadav, P. Anand, P. Bajaj, J. S. Virdi and V. Tandon, J. Med. Chem., 2014, 57, 5238–5257 CrossRef PubMed.
- J. J. Champoux, Annu. Rev. Biochem., 2001, 70, 369–413 CrossRef CAS PubMed.
- V. U. Jeankumar, R. S. Reshma, R. Janupally, S. Saxena, J. P. Sridevi, B. Medapi, P. Kulkarni, P. Yogeeswari and D. Sriram, Org. Biomol. Chem., 2015, 13, 2423–2431 CAS.
- K. M. Martin Gellert and M. H. O'Dea, Biochemistry, 1976, 73, 3872–3876 Search PubMed.
- M. Nollmann, N. J. Crisona and P. B. Arimondo, Biochimie, 2007, 89, 490–499 CrossRef PubMed.
- G. R. Jacobson and J. P. Rosenbusch, Biochemistry, 1976, 15, 5105–5110 CrossRef CAS PubMed.
- A. M. Reece and R. J. Reece, J. Biol. Chem., 1991, 266, 3540–3546 Search PubMed.
- A. M. Reece and R. J. Reece, Nucleic Acids Res., 1991, 19, 1399 CrossRef PubMed.
- F. Collin, S. Karkare and A. Maxwell, Appl. Microbiol. Biotechnol., 2011, 92, 479–497 CrossRef CAS.
- C. Anderle, M. Stieger, M. Burrell, S. Reinelt, A. Maxwell, M. Page and L. Heide, Antimicrob. Agents Chemother., 2008, 52, 1982–1990 CrossRef CAS PubMed.
- N. Nakada, H. Shimada, T. Hirata and Y. Aokl, Antimicrob. Agents Chemother., 1993, 37, 2656–2661 CrossRef CAS PubMed.
- L. M. Riley, M. Veses-Garcia, J. D. Hillman, M. Handfield, A. J. McCarthy and H. E. Allison, BMC Microbiol., 2012, 12, 42 CrossRef CAS PubMed.
- M. M. Toshiro Adachil and E. A. Robinson, Nucleic Acids Res., 1987, 15, 771–784 CrossRef.
- L. W. Tari, X. Li, M. Trzoss, D. C. Bensen, Z. Chen, T. Lam, J. Zhang, S. J. Lee, G. Hough, D. Phillipson, S. Akers-Rodriguez, M. L. Cunningham, B. P. Kwan, K. J. Nelson, A. Castellano, J. B. Locke, V. Brown-Driver, T. M. Murphy, V. S. Ong, C. M. Pillar, D. L. Shinabarger, J. Nix, F. C. Lightstone, S. E. Wong, T. B. Nguyen, K. J. Shaw and J. Finn, PloS One, 2013, 8, e84409 Search PubMed.
- G. A. Jacoby, L. Clinic, Burlington and Massachusetts, Supplement article, 2015.
- J. Ruiz, J. Antimicrob. Chemother., 2003, 51, 1109–1117 CrossRef CAS PubMed.
- M. Gellert, M. H. O'Dea and T. Itoh, Biochemistry, 1976, 73, 4474–4478 CAS.
- P. S. Hameed, A. Raichurkar, P. Madhavapeddi, S. Menasinakai, S. Sharma, P. Kaur, R. Nandishaiah, V. Panduga, J. Reddy, V. K. Sambandamurthy and D. Sriram, ACS Med. Chem. Lett., 2014, 5, 820–825 CrossRef.
- L. A. M. Silke Alt, A. Maxwell and L. Heide, J. Antimicrob. Chemother., 2011, 66, 2061–2069 CrossRef PubMed.
- M. Rajendram, K. A. Hurley, M. H. Foss, K. M. Thornton, J. T. Moore, J. T. Shaw and D. B. Weibel, ACS Chem. Biol., 2014, 9, 1312–1319 CrossRef CAS PubMed.
- S. B. Gregory, H. K. Gunther, M. John, P. M. John, L. Kenneth, V. Karthick, A. A. Richard, B. Kevin, D. Peter, G. Vincent, G. Humphrey, G. Madhusudhan and H. Michael, Sci. Rep., 2015, 5, 11827 CrossRef PubMed.
- L. Wang, X. Le, L. Li, Y. Ju, Z. Lin, Q. Gu and J. Xu, J. Chem. Inf. Model., 2014, 54, 3186–3197 CrossRef CAS.
- H. Cui, B. Xu, T. Wu, J. Xu, Y. Yuan and Q. Gu, J. Nat. Prod., 2014, 77, 100–110 CrossRef CAS PubMed.
- T. Wu, Q. Wang, C. Jiang, H. Cui, Y. Wang, J. Xu and Q. Gu, J. Nat. Prod., 2015, 78, 500–509 CrossRef CAS PubMed.
- A. Gaulton, L. J. Bellis, A. P. Bento, J. Chambers, M. Davies, A. Hersey, Y. Light, S. McGlinchey, D. Michalovich, B. Al-Lazikani and J. P. Overington, Nucleic Acids Res., 2012, 40, D1100–D1107 CrossRef CAS PubMed.
- Y. Y. L. L. Chen, Q. Zhao, H. Peng and T. J. Hou, Mol. Pharmaceutics, 2011, 8, 889–900 CrossRef.
- J. Fang, R. Yang, L. Gao, D. Zhou, S. Yang, A. L. Liu and G. H. Du, J. Chem. Inf. Model., 2013, 53, 3009–3020 CrossRef CAS PubMed.
- S. Y. Yang, Drug Discovery Today, 2010, 15, 444–450 CrossRef CAS PubMed.
- L. C. D. Li, Y. Li, S. Tian, H. Sun and T. Hou, Mol. Pharmaceutics, 2014, 11, 716–726 CrossRef.
- G. De'ath and K. E. Fabricius, Ecological Society of America, 2000, 81, 3178–3192 Search PubMed.
- L. Chen, Y. Li, Q. Zhao, H. Peng and T. Hou, Mol. Pharm., 2011, 8, 889–900 CrossRef CAS PubMed.
- M. C. M. M. Mysinger, J. J. Irwin and B. K. Shoichet, J. Med. Chem., 2012, 55, 6582–6594 CrossRef CAS PubMed.
- P. Baldi and Y. Chauvin, Bioinformatics, 2000, 16, 412–424 CrossRef CAS PubMed.
- C. a. L. S. Institute, 2012.
- E. Cf, A. S. Eot, E. So and C. Ma, Infectious and D. ESCMID, Clin. Microbiol. Infect., 2000, 6, 509–515 CrossRef.
- Q. Z. Ding, C. J. Li, L. Wang, Y. L. Li and J. Xu, Med. Chem. Commun., 2015, 6, 1393–1403 RSC.
- J. L. B. R. A. Friesner, R. B. Murphy, T. A. Halgren, J. J. Klicic, D. T. Mainz, M. P. Repasky, E. H. Knoll, M. Shelley, J. K. Perry, D. E. Shaw, P. Francis and P. S. Shenkin, J. Med. Chem., 2004, 47, 1739–1749 CrossRef PubMed.
- R. B. M. T. A. Halgren, R. A. Friesner, H. S. Beard, L. L. Frye, W. T. Pollard and J. L. Banks, J. Med. Chem., 2004, 47, 1750–1759 CrossRef PubMed.
- R. B. M. R. A. Friesner, M. P. Repasky, L. L. Frye, J. R. Greenwood, T. A. Halgren, P. C. Sanschagrin and D. T. Mainz, J. Med. Chem., 2006, 49, 6177–6196 CrossRef CAS PubMed.
- X. Yan, J. Li, Z. Liu, M. Zheng, H. Ge and J. Xu, J. Chem. Inf. Model., 2013, 53(8), 1967–1978 CrossRef CAS PubMed.
- J. Sun, P.-C. Lv, Y. Yin and R.-J. Yuan, PLoS One, 2013, 8, e9751 Search PubMed.
- M. Brvar, A. Perdih, M. Renko, G. Anderluh, D. Turk and T. Solmajer, J. Med. Chem., 2012, 55, 6413–6426 CrossRef CAS PubMed.
Footnotes |
| † Electronic supplementary information (ESI) available. See DOI: 10.1039/c5ra22568j |
| ‡ The experiment design JX, LL, XL, LW. Implementation: LL, HZ, QG. Manuscript revision and submission: LL and JX. |
|
| This journal is © The Royal Society of Chemistry 2015 |
Click here to see how this site uses Cookies. View our privacy policy here.