Seeing is believing: atomic force microscopy imaging for nanomaterial research
Jian Zhong* and
Juan Yan
College of Food Science & Technology, Shanghai Ocean University, Shanghai 201306, People's Republic of China. E-mail: jzhong@shou.edu.cn; jianzhongpku@hotmail.com
First published on 9th December 2015
Abstract
The research and development of nanotechnology has led to materials science and engineering entering the “nanomaterial era”. It is pivotal for analyzing the physicochemical properties of nanomaterials for new nanotechnological instruments to be developed. Over the past three decades, atomic force microscopy (AFM), as a powerful nanotechnological imaging tool, has provided many imaging modes for analyzing nanomaterial properties such as the topography, elasticity, adhesion, friction, electrical properties, and magnetism of the materials. The focus of this review is on the development of AFM imaging observation tools and methods for nanomaterial research. First, AFM and nanomaterials are briefly introduced. Then, AFM imaging techniques for nanomaterial research are comprehensively summarized. Finally, the advantages and disadvantages of AFM imaging techniques for nanomaterial research are discussed. This review will provide comprehensive information of AFM imaging techniques for materials scientists and engineers.
1. Introduction
The atomic force microscope (AFM) is a member of the family of scanning probe microscopes and was first developed in 1985 as an extension of the scanning tunneling microscope by Binnig (Stanford University), Quate (Stanford University), and Gerber (IBM San Jose Research Laboratory).1 It can be used to measure the surface properties such as the morphology and mechanical properties of many materials and specimens at the nanoscale level.2–4 Moreover, it can be used to fabricate materials in a precise, controllable and reproducible fashion at the nanoscale level.5,6 Therefore, AFM is an appropriate and pivotal nanotechnology tool for nanomaterial research.Over the past three decades, the research and development of nanotechnology has led to materials science and engineering entering the “nanomaterial era”,7,8 which has created tremendous opportunities to improve basic science and engineering applications. A nanomaterial is defined as a material with at least one dimension of 100 nanometers or less.9 Compared to conventional bulk materials (e.g. materials with features in the micrometer or larger size), because of their surface effect, small size effect, quantum size effect, and macroscopic quantum tunnel effect, nanomaterials have numerous unique properties.10–12 According to the chemical composition, nanomaterials can be classified into four types: (i) inorganic (e.g. quantum dots, metal nanowires and nanoceramics) nanomaterials;13 (ii) organic (e.g. carbon nanotubes and polymer-based nanomaterials) nanomaterials;14,15 (iii) biological (e.g. protein-based nanofibers, peptides-based nanocarriers, and DNA origami) nanomaterials;16,17 and (iv) hybridized (e.g. inorganic/organic) nanomaterials.18 Nanomaterials have been developed to be used in wide ranging applications, such as the environment,19 energy,20 textile engineering,21 food,22 disease imaging and therapy,23 drug delivery,24 and tissue engineering.25 The efficacy of the nanomaterials depends on both their physicochemical properties and their target environments. Therefore, it is important to deeply understand the properties of the nanomaterials, including the components, structure, surface morphology, and mechanical property.
In this review, AFM and nanomaterials will be briefly introduced at first. Then, AFM imaging techniques for nanomaterial research will be comprehensively described. Finally, the advantages and disadvantages of AFM imaging for nanomaterial research will be discussed.
2. Brief review of AFM
Since AFM was invented in 1985, AFM has become an important tool for researchers in the physical, chemical, materials, and biomedical sciences. AFM mainly uses a sharp tip, located at the end of a microscale cantilever of a probe, to sense or manipulate samples, allowing the surface properties of the samples or pre-designed nanostructures to be obtained.AFM mainly consists of four components (Fig. 1):26 (i) an AFM probe to directly “feel” the force between the probe and a sample. An AFM probe is particularly sensitive to the interactions at the atomic level and is designed to sense them. In general, the AFM probe has a sharp tip, typically less than 5 μm tall and often less than 10 nm in diameter at the apex, which is located at the end of a microscale cantilever, typically 100–500 μm long. (ii) A piezo scanner to precisely control the precise probe–sample position, both vertically and laterally. The piezo scanner is designed to bend, expand, and contract in a controlled, predictable manner when a voltage is applied. (iii) A professional software system to control the operational parameters for controlling the probe and piezo scanner, as well as to display and analyze the results. (iv) A feedback control system including a laser diode, position-sensitive photodetector, controller, and a feedback circuit. The feedback control system is applied to receive and adjust the precise probe–sample position, both vertically and laterally, by an analog/digital conversion. It is a communication system between the piezo scanner and the professional software.
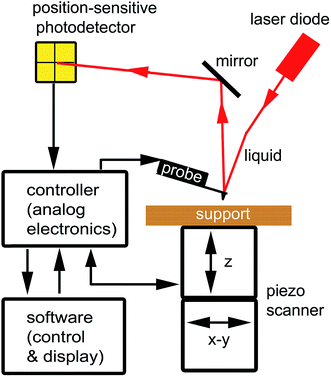 | ||
| Fig. 1 Schematic of AFM components: probe, piezoscanner, feedback control system, and software. Adapted with permission from ref. 26. (Copyright 2011 The Royal Society of Chemistry). | ||
An appropriate AFM probe is pivotal for the optimal performance of each AFM experiment. In AFM scanning, two types of major artifacts can be introduced when an AFM tip scans on the sample surface: the sample height compression effect due to the elastic deformation of the sample and the tip-broadening effect due to the tip–sample convolution.27–29 There are two ways to minimize the effect of these artifacts. One is to apply surface/tip deconvolution algorithms to analyze the surface information;30,31 the other is to choose an appropriate probe for the experiment by trying different probes. The height of the tip should be at least double the sample characterization height to prevent contact between the cantilever and the sample.32 Common AFM probes include silicon nitride probes, silicon probes, and carbon nanotube tips.33 Functionalized AFM probe tips can be prepared by coating polymers or proteins onto the tips.34 In addition, sphere tips can be fabricated by gluing spheres (colloid, and glass) to the AFM tips.35 Except for the AFM probe type, AFM performance is also dependent on the sharpness of the tip, including the radius of curvature of the tip (Rtip) and the tip aspect ratio, as well as the cantilever spring constant (k).
Different AFM-based modes/methods can be used for the imaging, mechanical measurements, and surface modification. According to the type of force being measured and how it is measured for AFM imaging, there are three primary AFM imaging operation modes (Table 1):26,36 contact mode, non-contact mode, and tapping mode. These three modes are mainly used for height imaging. Furthermore, based on the three primary AFM imaging modes, some secondary imaging modes have been developed such as deflection imaging,37 phase imaging,38 lateral force imaging,39 magnetic force gradient imaging,40 torsional resonance imaging,41 conductive AFM,42 electric field gradient distribution imaging,43 surface potential imaging,44 electrical carrier concentration imaging,45 force modulation imaging,46 surface thermal imaging,47 and scanning spreading resistance imaging.48 In general, the applied imaging operation mode depends on the surface characteristics of interest and the hardness/stickness of the sample. Typical surface mechanical measurements include force spectroscopy,49 force volume,50 nanoindentation,51 lateral bending test,52 two-point bending test,53 and three-point bending test.54 Typical surface modification methods include dip-pen nanolithography,55,56 nanografting,57 nanoshaving,58 wear testing,59 electrochemical AFM nanolithography,60 thermal AFM nanolithography,61 and nanomanipulation.62
| Operation mode | Probes | Cantilever | Tip–sample distance | Force | Advantages | Disadvantages |
|---|---|---|---|---|---|---|
| Contact mode | Silicon nitride probes | The cantilever is deflected: constant force; or constant height | Physical contact <0.5 nm | Repulsive 10−9 to 10−6 N | High scan speeds | Lateral (shear) forces may distort soft samples |
| Good for rough samples | In ambient conditions, may experience strong capillary forces due to the adsorbed thin water layer | |||||
| Used in friction analysis | ||||||
| High resolution | ||||||
| Non-contact mode | Silicon probes with high spring constant of 20–100 N m−1 | The cantilever is oscillated (amplitude < 10 nm) | Above the sample 1–10 nm | Attractive 10−12 N | Both normal and lateral forces are minimized; good for very soft samples | Generally lower resolution |
| Can get atomic resolution in an ultra-high vacuum (UHV) environment | In ambient conditions, adsorbed water lay may cause the tip “jump-to-contact” | |||||
| Extended probe lifetime | Imaging of liquid layer and not of the underlying surface in the presence of water | |||||
| Slower scan speed than tapping and contact modes | ||||||
| Usually needs UHV for best imaging | ||||||
| Tapping Mode | Silicon probes with spring constant of 2–50 N m−1 | The cantilever is oscillated (amplitude > 20 nm) | Intermittent contact 0.5–2 nm | Both repulsive and attractive forces 10−12 N | Lateral forces almost eliminated | Slower scan speed than in contact mode |
| Higher lateral resolution on most samples | ||||||
| Lower forces; less damage to soft samples and tips | ||||||
| Good for biological samples |
AFM can be widely applied in material science, nanoscience, medical science, biological science, the semiconductor industry, and other fields. To date, AFM has been successfully applied to image molecules on a surface,63–65 observe surface characterization,66–69 image biological entities,70–72 analyze material interactions,26,73–75 study molecular force interaction,75,76 manipulate molecules on a surface,77–80 investigate material nanomechnics,81–84 and mechanically fabricate 3D nanostructures.85–89 Furthermore, to systematically analyze the material surface properties, AFM has been explored to synergistically combine with other instruments such as the universal mechanical testing machine,90 which can analyze the morphological changes of nanomaterials during the tensile process. In addition, AFM can also integrate with other instruments to separately obtain morphological information and other information of the same specimens, which can help researchers to understand the multiple properties of nanomaterials. Typical instruments include Raman spectroscopy,91 optical microscopy (light microscopy, epi-fluorescence microscopy, confocal laser scanning microscopy, and total internal reflection fluorescence microscopy)92 surface plasmon resonance,93 ellipsometry,94 and quartz crystal microbalance.95
3. Imaging observations for nanobiomaterial research
3.1. Height imaging
Height imaging is a widely used application of AFM in the scientific area. It can be performed using the three primary AFM imaging operation modes: contact mode, non-contact mode (also named as the frequency modulation mode), and tapping mode (also named as the amplitude modulation mode or intermittent contact mode).In the contact mode, the AFM tip is in physical contact with the sample surface. When the scanner gently moves the AFM tip across the sample surface (or the sample under the AFM tip), the cantilever deflection is sensitive to the change of the surface topography. During the imaging process, the cantilever deflection is maintained with the scanner movement to obtain the height image. The contact mode is ideal for imaging relatively hard samples.96 In addition, the contact mode is also commonly used for high-resolution imaging.97,98
In the non-contact mode, the cantilever is oscillated (amplitude < 10 nm) near its resonant frequency (typically 100–400 kHz). When the scanner gently moves the AFM tip across the sample surface (or the sample under the AFM tip), the tip is above the sample surface and the distance (about 1–10 nm) between the tip and the sample surface is maintained to obtain the height image. Careful operation is required in this mode under ambient conditions because the water layer between the tip and the samples can easily cause tip “jump-to-contact”. A high performing Z-servo feedback system and the fast mechanical response of a Z-scanner are required to track the mechanical changes of the tip–sample interaction and to prevent tip “jump-to-contact”. The main advantage of the non-contact mode is that the tip never contacts with the sample and therefore the sample will be not disturbed or destroyed by the AFM tip, which is particularly important for soft samples. Therefore, though it is not the mainstream operation mode now, many scientists are still exploring this mode for their study.99,100 It is commonly used for studying weakly bound-to-support samples or soft samples.
In the tapping mode, the most commonly used mode, the cantilever is oscillated (amplitude > 20 nm) close to its resonance frequency (typically 100–400 kHz). When the scanner gently moves the AFM tip across the sample surface (or the sample under the AFM tip), the tip is in intermittent contact with the sample surface and the oscillation amplitude is dampened. The dampened cantilever oscillation amplitude is maintained to obtain the height image. The tapping mode is usually used to image weakly bound-to-support samples or soft samples (polymers, DNAs, proteins, and lipid bilayers).101–104
Height imaging can be used to analyze the morphology of characterized nanomaterials, such as nanoparticles,105 nanotubes,106 and nanosheets,107,108 wherein it is important to measure the 3D sizes of the nanomaterials and to analyze the effect parameters on the nanomaterials (Fig. 2).104 Height imaging can be also applied to analyze the surface roughness of characterized nanomaterials,109,110 which is important to analyze and compare nanomaterials with different surface roughnesses (Fig. 3).111
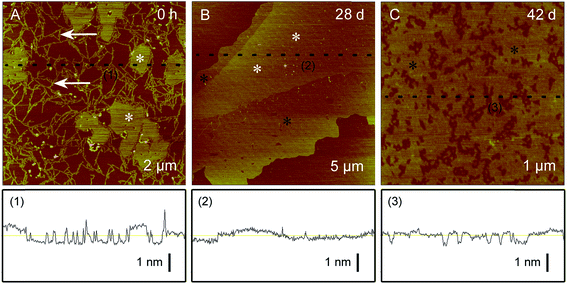 | ||
| Fig. 2 Representative AFM height images of regenerated silk fibroin (2.4 μg mL−1) after different incubation times. Adapted with permission from ref. 104. (Copyright 2011 The Royal Society of Chemistry). | ||
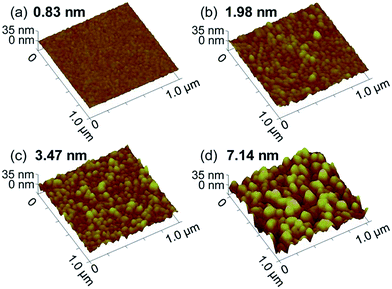 | ||
| Fig. 3 AFM height images of Ag thin films with different root-mean-square roughnesses, ranging from 0.83 nm to 7.14 nm. Reprinted with permission from ref. 111. (Copyright 2014 The Royal Society of Chemistry). | ||
3.2. Deflection imaging
Deflection imaging can be performed in contact mode AFM. In the contact mode, when the tip scans on the sample surface, the tip height will be constant if the feedback system is turned off. The obtained image is then a deflection image. This operation mode is known as the constant height mode or deflection mode. It can be used to analyze the surface properties of nanomaterials by combining the data with height images. This mode is particularly useful for analyzing the surface properties of very flat samples in a height image such as a cell surface,112 which is extremely important to analyze the effects of nanomaterials on cells. Recently, deflection imaging has been applied to observe nanodisk-like protrusions and ripples on the surface of nanosheets (Fig. 4),113 to show the 3D nanostructures of nanoparticles,114,115 to investigate the self-assembled nanostructures of dendrimers,116 to analyze the dissolution process of nanocrystals,117,118 and to detect the surface topography and nanostructures on the polymer thin film.119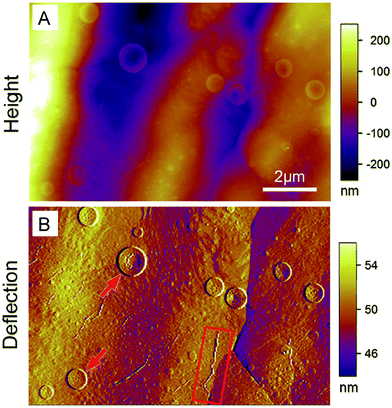 | ||
| Fig. 4 AFM height image (A) and deflection image (B) of the same area of a boron nitride nanosheet covered Cu foil after heating at 250 °C in air for 2 h. Both images have the same scale bar. Adapted with permission from ref. 113. (Copyright 2014 Wiley-VCH Verlag 4148 GmbH&Co. KGaA). | ||
3.3. Phase imaging
Phase imaging is derived from the tapping or non-contact mode.120 In tapping or non-contact mode AFM, the cantilever is excited into resonance oscillation with a piezoelectric driver. During AFM imaging, the oscillation of the cantilever is changed due to the tip–sample interactions. Phase imaging is the mapping of the difference between the measure phase of the cantilever's periodic oscillations and the phase of the periodic signal by the piezoelectric driver to drive the cantilever. Phase imaging shows the sample surface properties that can cause the phase shift. These sample surface properties include composition, elasticity, adhesion, friction, electrical properties, and magnetism. Therefore, the phase imaging mode can give valuable information about the sample surface, especially when height images show no clear difference.Phase imaging has already been widely applied for nanomaterial research, including in surface composition studies of polymers by ion modification,121,122 in studies on the compositional difference on a heterogeneous nanostructure surface,123 and in quantitative characterization of phase separation in polymer-blended films.124 For example, Jian Zhong et al.125 used AFM to observe the self-assembly process of regenerated silk fibroin from random coil nanostructures to antiparallel β-sheet nanostructures (Fig. 5). The AFM height and phase images showed that the height and phase periodic intervals of silk fibroin protofibrils disappeared in turn at day 1 and day 14, respectively. This study demonstrated that phase imaging can assist height imaging to analyze the detailed information of the protein self-assembly process.
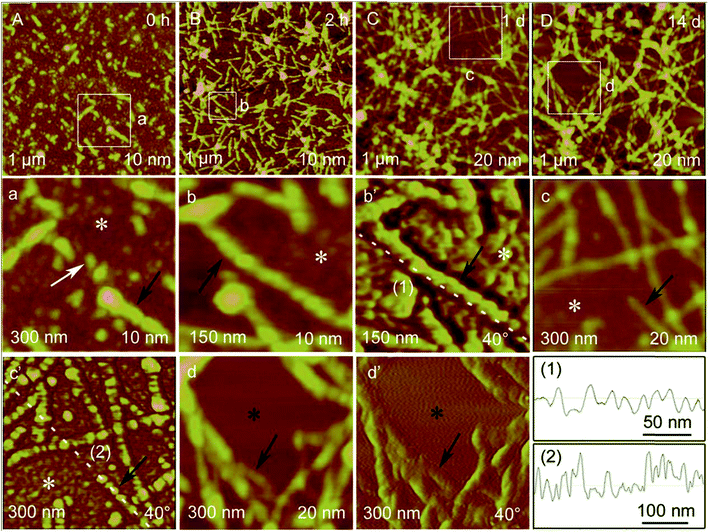 | ||
| Fig. 5 Representative AFM height images of RSF self-assembly structures after different incubation times at a concentration of 0.03%. Incubation times, visual fields, and height scales are shown at the upper right corner, the lower left corner and the lower right corner, respectively, of each image. (a–d) are zoomed-in height images from the corresponding regions shown in (A–D). (b’, c’, d’) are the corresponding AFM phase images to AFM height images of (b, c, d). Phase scales are shown at the lower right corner of these phase images. White arrow and white asterisks indicate RSF bead-like oligomers. Black arrows indicate RSF protofibrils. Black asterisks indicate that there are no bead-like oligomers. (1–2) are section analyses along the corresponding white dashed lines in (b’ and c’). Reprinted with permission from ref. 125. (Copyright 2014 Wiley-VCH Verlag 4148 GmbH&Co. KGaA.) | ||
3.4. Lateral force imaging
Lateral force imaging is performed by lateral force microscopy (LFM),126 which is also named friction force microscopy,127,128 to map the relative differences in the friction force between the tip and the sample surface. LFM can simultaneously obtain the height image and lateral force image. LFM is similar to contact mode AFM. In contact mode AFM, the scanning is parallel to the long axis of the cantilever, and the force between the tip and the sample surface causes the cantilever to be vertically deflected, and its vertical deflection is then maintained to obtain the surface property information, whereas in LFM, the scanning is perpendicular to the long axis of the cantilever, the force between the tip and the sample surface causes the cantilever to be twisted around its long axis, and its lateral deflection is maintained to obtain the surface property information. The cantilever twisting can result from the changes in surface properties (hydrophilicity, and hardness) or the changes in topography. By comparing the trace LFM image, the retrace LFM image, and the corresponding height image (trace or retrace image), the reason for the cantilever twisting can be distinguished.LFM is now widely used to characterize the surface friction differences of nanomaterials, and then to analyze the composition and structural differences of nanomaterials. Pandey et al.129 used LFM to study self-assembled layers of cyclodextrin–thiocholesterol inclusion complexes on gold (Fig. 6). Height images showed no clear height differences, whereas LFM images showed clear phase separation, which demonstrated that LFM has a clear advantage for analyzing self-assembled layers composed of multiple substances. LFM was also used to differentiate different phases of hydrated cement paste (calcium-silicate-hydrate particles, calcium hydroxide crystals, and unhydrated particles) at the nanoscale and microscale.130,131 Almeida et al.132 used LFM to identify graphene nanosheets' crystallographic orientation. The results revealed that the periodicity of the graphene hexagonal structure allowed the observation of the lattice symmetries and determination of the crystal orientation. Liao et al.133 used LFM to analyze the temperature effect on the lateral force signal of 16-mercaptohexadecanoic acid self-assembled monolayers. The LFM signal decreased with the increase in temperature and therefore LFM could be used to analyze the thermodynamic properties of nanomaterials.
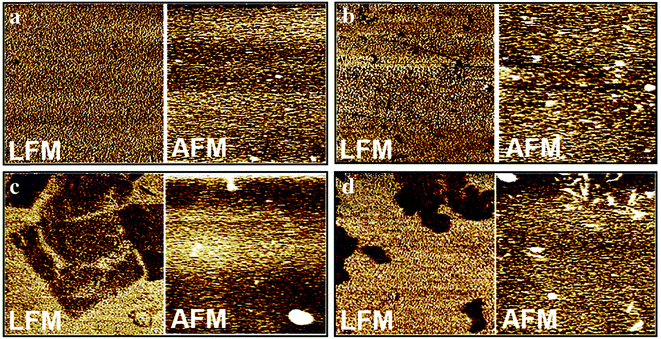 | ||
| Fig. 6 LSM images and corresponding height images of bare gold surface (a), thiocholesterol self-assembled monolayer on gold surface (b), β-cyclodextrin/thiocholesterol inclusion complex self-assembled monolayer on gold surface (c), and methyl-β-cyclodextrin/thiocholesterol inclusion complex self-assembled monolayer on gold surface (d). All the images are 10 μm × 10 μm and the average roughness values (z scale) are 6.0 nm, 8.0 nm, 10.0 nm and 13.0 nm for (a), (b), (c), and (d), respectively. Reprinted with permission from ref. 129. (Copyright 2014 Elsevier Ltd.). | ||
3.5. Magnetic force gradient imaging
Magnetic force gradient is imaged by magnetic force microscopy (MFM),134 which is derived from the tapping mode. By using a sharp magnetized tip to scan a magnetic sample, the tip–sample magnetic interactions are detected to map the magnetic force gradient while the tip is above the sample surface (no touching). During MFM measurements, there are two forces between the tip and the sample surface: magnetic and van der Waals force. Therefore, by the “force range” technique or “two pass” technique, MFM can simultaneously measure the height image and magnetic force gradient image.MFM has become a well-established veritable workhorse in the research field and industry field of magnetic nanomaterial-related studies. Li et al.135 characterized mechanically exfoliated single- and few-layer MoS2 and graphene (Fig. 7) nanosheets using MFM. By analyzing the phase and amplitude shifts, they found that the magnetic response of these nanosheets depended on their layer number. Interesting, MoS2 and graphene nanosheets became nonmagnetic when they exceeded a certain thickness. The application of MFM opens a new way to understand the intrinsic properties of 2D nanomaterials. In addition, MFM has also been applied to study magnetic nanoparticles (iron oxide nanoparticles,136 Cu-coated iron nanoparticles,137 and magnetite nanoparticles138), patterned magnetic nanodots,139 nanowires and nanotubes,140 and other magnetic nanostructures (iron nanostructures,141 dicobalt octacarbonyl nanostructures142).
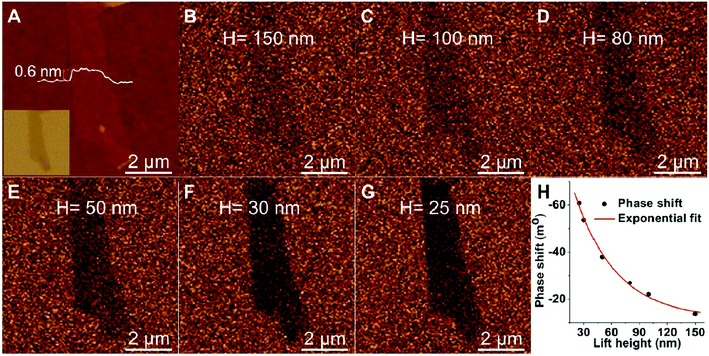 | ||
| Fig. 7 AFM height image (A) and MFM images (B–G) of single-layer graphene on 90 nm SiO2/Si at various lift heights: (B): 150, (C) 100, (D) 80, (E) 50, (F) 30, and (G) 25 nm. Inset in panel A: optical image of the single-layer graphene on 90 nm SiO2/Si. (H) Plot of phase shift vs. lift height obtained in the magnetic force microscopy measurements on a single-layer graphene. The red curve is the exponentially fitted curve. Reprinted with permission from ref. 135. (Copyright 2014 American Chemical Society). | ||
3.6. Torsional resonance imaging
Torsional resonance imaging, which is performed by torsional resonance microscopy (TRM), measures and controls the dynamic lateral forces between the tip and the sample surface.143,144 In TRM, the cantilever oscillates around its long axis in a twisting motion, which causes the tip to vibrate in a dithering motion. When the tip scans the sample surface, the vertical deflection and lateral twist of the cantilever can be simultaneously measured and therefore TRM can examine the in-plane mechanical properties of nanomaterials such as friction, shear stiffness, and other tribologically relevant properties.143,145 In addition, it can explore the complementary lateral and vertical characterization with high sensitivity by being interleaved with the tapping mode.146 TRM can provide higher resolution, sensitivity, and stability than many other imaging mode AFMs. Hwang et al.147 used TRM to image polystyrene nanosphere, DNA (Fig. 8) and purple membrane in water. The results demonstrated that TRM can provide high-resolution images even when a relatively blunt tip is used. Moreover, compared with conventional non-contact mode AFM, TRM showed a higher sensitivity and stability in water, which proved that TRM can be important for analyzing soft matters in liquid and liquid–solid interfaces. Torsional resonance has also been widely used for imaging the nanostructures of materials such as human hair,41 mineral pennine,148 protein–DNA complex,149 and polymers.150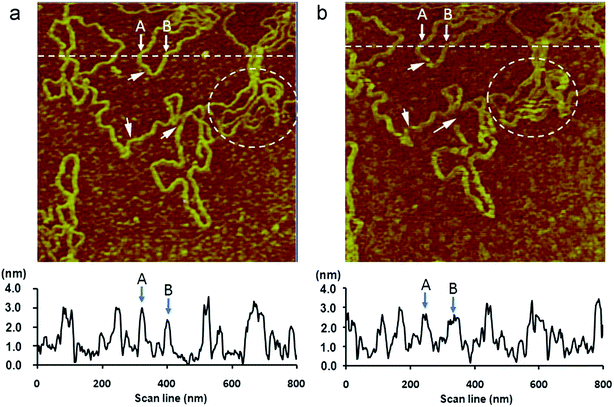 | ||
| Fig. 8 AFM images of the same area of duplex DNA on a mica surface in water taken with two different modes using the same AFM probe under the same environment. The scan area and the pixel size of all the images are 800 nm × 800 nm and 256 × 256, respectively. The scan rate is 0.5 Hz. The imaging sequence is from (a) to (b), wherein (a): non-contact-torsional resonance mode with the free torsional oscillation amplitude ∼0.8 nm, ft = 140.35 kHz, Δf = +20 Hz, Q factor ∼70. The line profile along the dashed line is shown at the bottom. (b): non-contact mode with the free flexural oscillation amplitude ∼1.2 nm, ff = 35.35 KHz, Δf = +40 Hz, Q factor ∼5. The line profile along the dashed line is shown at the bottom. Reprinted with permission from ref. 147. (Copyright 2014 Elsevier Ltd.). | ||
Currently, TRM is still in the development phase. Many scientists are working on the instrument development to broaden its applications. Yang et al.151 designed a torsional excitation system through the Lorentz force actuation for triangular-shaped and rectangular-shaped cantilevers to image nanomaterials in buffer solutions with small loading forces. The results showed that Lorentz force actuation can successfully excite different AFM cantilevers to execute pure torsional resonances in air and liquid. It showed a high force sensitivity, high resolution, and high stability to observe hydration layers and nanomaterials at liquid–solid interfaces. Kaidatzis et al.152 employed the torsional resonance mode in magnetic force microscopy. The results showed that it had two clear advantages over conventional magnetic force microscopy: the ability to perform magnetic force imaging without topography-related interference and the improvement (15%) of the lateral resolution. These studies can broaden AFM's application for nanomaterials.
3.7. Conductive AFM
Conductive AFM (CAFM) is a powerful current sensing mode and is derived from contact mode AFM.153 In CAFM, a DC bias is applied between a conductive tip and the sample (conducting or semiconducting sample) when the tip scans on the sample surface. CAFM can simultaneously measure the height image and current distribution imaging. The cantilever deflection feedback signal is used to obtain a contact mode height image. The current passing between the tip and the sample is recorded to characterize conductivity variations of the nanomaterials. It can measure the current in the range of hundreds of femotoamps to nearly a microamp. CAFM is different to scanning tunneling microscopy (STM), although they both apply a DC bias between a conductive tip and the sample. STM is based on a concept of quantum tunneling. When a conductive tip is near (above) the sample surface, the DC bias allows electrons to tunnel through the vacuum. The resulting tunneling current is an exponential function of the tip position, applied voltage, and the local density of states of the sample.154 The change of the tunneling current or the height of the tip can be mapped above the sample surface by maintaining the height of the tip or the tunneling current, respectively. Therefore, the surface information of nanomaterials at an atomic level is obtained by STM.CAFM is useful for researching the surface characterization of conducting and semiconducting nanomaterials. It has been used to show the current distribution image of nanomaterials such as GaN nanowires,155 HgTe nanowires,156 silicon nanowires,157 ultrathin Al2O3 films,158 SnO2 nanobelt,159 GeSi quantum nanorings,160 carbon nanowalls,161 ZnO nanorods,162 and gold nanoparticles.163 CAFM has also been used to show the resistance image of nanomaterials such as epitaxial graphene,164 LaAlO3/SrTiO3 heterostructures,165 carbon nanotube thin-film transistors,166 and oxide layer nanostructures.167
Recently, based on CAFM, scanning current spectroscopy (STS) was developed for nanomaterial study. Gordon et al.168 used STS to map the current spectroscopy of heterojunctions of a molecular semiconductor (copper phthalocyanine, CuPc) and a transparent conducting oxide (indium-tin oxide, ITO), on 20–500 nm length scales (Fig. 9). Current spectroscopy maps were generated for CuPc/ITO heterojunctions as a function of ITO activation procedures and modification with variable chain lengths of alkyl-phosphonic acids. This study proved CAFM-based STS is a new, simple and convenient way to map the electrical property heterogeneity of transparent conductive oxide/organic semiconductor interfaces at nanometer length scales. In addition, STS has been applied to nanomaterial research materials such as graphene169,170 and poly(3-hexylthiophene) thin films.171
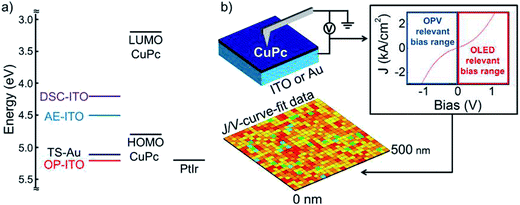 | ||
| Fig. 9 (a) Proposed band edge alignments for the ITO/CuPc/PtIr heterojunctions, assuming a pretreatment-dependent work function range for ITO of 4.2–5.2 eV (for DSC, AE-ITO, and OP-ITO), an IP/HOMO energy for CuPc of 4.8 eV, a LUMO of 3.2 eV, and a work function for the PtIr tip of 5.2 eV. (b) Schematic of the scanning current spectroscopy mapping experiment. Current–voltage (J–V) curves are collected from an array of spatially resolved points, with sampling dimensions of 500 × 500 nm and a point-to-point separation distance of 20 nm. The apparent hole mobility and the apparent power dependence of the current–voltage behavior were extracted from these individual J–V curves. A power dependence that deviates from 2 indicates the presence of a non-ohmic contact between the bottom electrode and the organic semiconductor. Reprinted with permission from ref. 168. (Copyright 2012 American Chemical Society). | ||
3.8. Electric field gradient distribution imaging
The electric field gradient distribution is imaged by electric force microscopy (EFM, also called electrostatic force microscopy),172 which is derived from the tapping mode. In EFM, a voltage is applied between the tip and the sample while the tip is above the sample surface (no touching). In a typical EFM image, the phase, frequency, or amplitude of the cantilever oscillation is plotted against the in-plane coordinates (X and Y). The phase, frequency, or amplitude is related to the vertical and near-vertical electric field gradient between the tip and the sample. There are two forces between the tip and the sample surface: electrostatic forces and van der Waals forces. Therefore, EFM is designed to separately measure the height image and electric force gradient image by a “force range” technique or “two pass” technique.EFM can be applied for analyzing the surface electrical properties of nanomaterials. Gaikwad et al.173 used it to measure the surface charge of asphaltene nanoaggregates (Fig. 10). The experimental data was used to calculate the average surface charge density of the nanoaggregates as 43.7 nC cm−2. The surface charges were dependent on the native charge of asphaltene and the solvents. In addition, EFM has also been applied to study nanomaterials such as poly(lactic acid) nanofibers,174 purple membranes,175 reduced graphene oxide,176 and polymer-carbon nanotubes.174
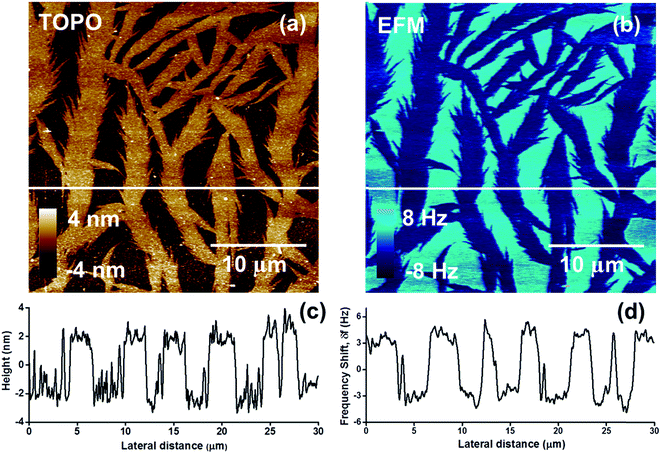 | ||
| Fig. 10 (a) AFM height image of asphaltene aggregates and (b) the corresponding EFM image at a lift height of 35 nm. (c) and (d) provide the cross-section of the height image and EFM image at the same location corresponding to the white horizontal line shown in (a) and (b), respectively. Reprinted with permission from ref. 173. (Copyright 2015 American Chemical Society). | ||
3.9. Surface potential imaging
Surface potential is imaged by scanning surface potential microscopy (SSPM, sometimes referred to as scanning Kelvin probe microscopy), which is derived from the tapping mode. It characterizes the electrostatic potential on the sample surface with or without a voltage applied to the sample. It is a nulling technique. During the imaging process, the cantilever experiences a force wherever the potential on the surface is different from the potential of the tip. To nullify the force, the voltage is adjusted to ensure that the potential of the tip has the same potential as the sample surface region beneath it. Then, the surface potential image is obtained by plotting the voltage applied to the tip versus the in-plane coordinates.SSPM has been widely used for nanomaterial study. Chen et al.177 used SSPM to directly image the surface potential depth profile over the cross-sections of nanoscale organic photovoltaic devices as solar cells (Fig. 11). They developed a bias compensation method for the quantitative measurement of energy-level differences in the devices according to the measured energy band alignments using SSPM. This could provide a general method for thin-film devices to understand the mechanisms in and the improvements of these devices. SSPM has also been applied to many other nanodevices (CdTe/CdS solar cells,178 organic field-effect transistors,179 single crystal solar cells,180 epitaxial graphene devices,181 and CZTSSe solar cells182), hybrid nanocomposites (nanoparticles/polymer hybrid blends,183 Au nanoparticles on TiO2 nanotubes,184 and silver–TiO2 (ref. 185)), ZnO nanowires,186 graphene,187–189 MoS2 nanoflakes,190 and ZnO nanorods.191
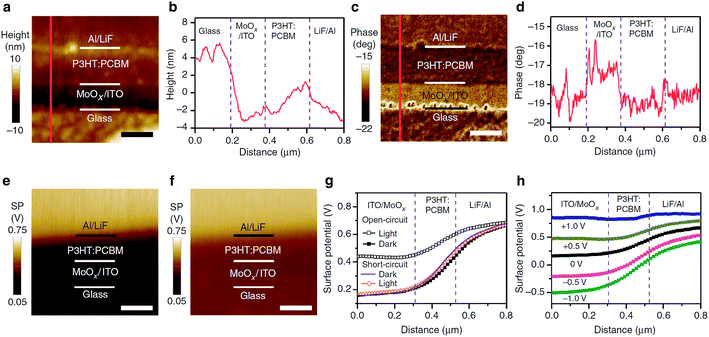 | ||
| Fig. 11 Cross-sectional images and depth profiles of a bulk heterojunction device. (a) Height and (c) phase images of ITO/MoOx/P3HT:PCBM/LiF/Al device cross-section obtained with AFM (scale bars, 200 nm). The line profiles in (b) and (d) correspond to the red lines in (a) and (c), respectively. Surface potential images of the P3HT:PCBM bulk heterojunction device in open-circuit (e) in the dark and (f) under AM 1.5G (100 mW cm−2) illumination (scale bar, 250 nm). (g) Surface potential depth profiles of the device in open-circuit in the dark (solid black squares), in open-circuit under AM 1.5G illumination (open black squares), in the short-circuit in the dark (solid purple line) and in the short-circuit under AM 1.5G illumination (open orange diamonds). (h) Surface potential depth profiles of the P3HT:PCBM bulk heterojunction device in the dark with bias voltages ranging from −1.0 to +1.0 V. Reprinted with permission from ref. 177. (Copyright 2015 Macmillan Publishers Ltd.). | ||
3.10. Electrical carrier concentration imaging
Electrical carrier concentration is imaged by scanning capacitance microscopy (SCM),192 which is derived from contact mode AFM. SCM uses an ultra-sharp conductive tip (Pt/Ir or Co/Cr metal-coated etched silicon tip) to form a metal–insulator–semiconductor capacitor with a semiconductor sample with an oxide layer. While the tip scans across the sample surface, a high-frequency AC bias is applied to the tip and the sample. Electrical carriers are accumulated and depleted within the surface layers, which changes the tip–sample capacitance. The capacitance changes are a function of the majority carrier concentration in semiconductors. By maintaining a constant force between the tip and the sample, both the height image and surface capacitance image can be simultaneously obtained, which enables the direct correlation of local topography with electrical properties. The relative carrier concentration can be measured in the range of 1016 to 1021 cm−3.Bussmann et al.193 used SCM to image buried delta-doped donor nanostructures fabricated in Si (Fig. 12). The results showed that this technique could detect buried nanostructures in thin films that were flat in an AFM height image, which proved SCM is a useful method for mapping the dopant profile in semiconductor devices without clear height difference in topographical image. Some other typical applications of this technique include mapping the dopant profile in silicon nanowires,194 interfacial abruptness analysis in heterostructures in nanowires,195 quantification of dielectric constants of colloidal nanocrystals,196 studies of electronic properties and size distributions of ErAs nanoparticles embedded in GaAs pn junctions,197 and analysis of memory properties and charge effect in Si nanocrystals.198
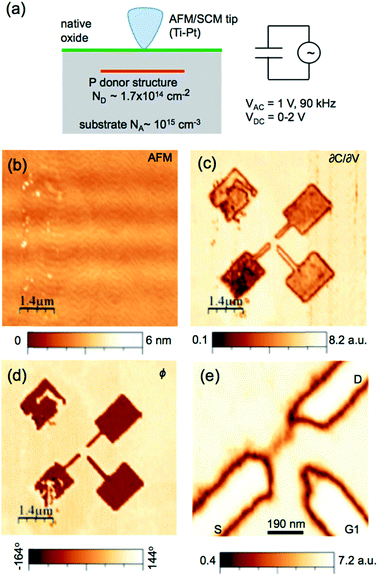 | ||
| Fig. 12 (a) Schematic of the SCM measurement. (b–e) AFM and SCM images of the buried single-electron transistor donor structure. (b) Contact mode AFM height image over the donor region showing the flat topography (1 nm roughness). (c) SCM amplitude (∂C/∂V) over the donor structure. Contrast is due to variations in the dopant density. (d) SCM phase signal. Contrast is due to variation of the dopant type. (e) SCM image of the active region of the donor device. Charging effects in the native oxide caused by the tip lead to nonuniform contrast over the donor doped regions. Reprinted with permission from ref. 193. (Copyright 2015 IOP Publishing Ltd.). | ||
3.11. Scanning spreading resistance imaging
Scanning spreading resistance is imaged by scanning spreading resistance microscopy (SSRM),199 which is derived from contact mode AFM. During the imaging process, a DC bias is applied between a conductive tip and the sample. The resulting current between the tip and the sample is measured to map the local spreading resistance. SSRM has already been widely used for nanomaterial research, including in the quantitative 2D-carrier distribution of nanowire-based transistors200 and metal-oxide-silicon field-effect transistors,201 surface resistance observations of multi-walled carbon nanotube-polymer nanocomposites202 and TiN/HfO2-based resistive switching structures,203 quantitative 3D carrier mapping of nanowire-based transistors,204 device failure analysis of polycrystalline silicon gate originated complementary metal oxide semiconductors,205 compositional contrast analysis in nanoheterostructures,206 and nanoscale electronic properties analysis of CdZnTe crystals.207 For example, Truchly et al.208 used SSRM to analyze the electronic properties of YBa2Cu3O6+x thin films. Before the ion beam etching, the SSRM image (Fig. 13b) showed that the thin-film surface conductivity was very low and that only some current flows through the highest surface irregularities in the AFM height image (Fig. 13a). Furthermore, they removed the degraded surface layers of the thin film by ion beam etching and observed the surface by SSRM. The results showed a high inhomogeneity on the micrometer and nanometer scales with numerous regions of highly enhanced conductivity compared to the surroundings.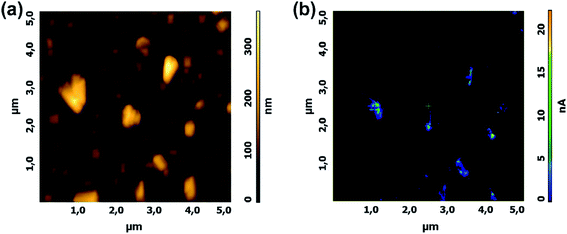 | ||
| Fig. 13 Typical (a) AFM height and (b) SSRM image (bias voltage 1.5 V) of the YBa2Cu3O6+x thin-film surface stored in air for several days before ion beam etching. Reprinted with permission from ref. 208. (Copyright 2012 Elsevier Ltd.). | ||
3.12. Force modulation imaging
Force modulation imaging is performed by force modulation AFM (FMAFM), which is derived from contact mode AFM and is designed to analyze and map the differences in the surface stiffness or elasticity of a sample.209 It allows simultaneously obtaining both a height image and a force modulation image. During the imaging process, the tip tracks the sample topography (height image) as in the normal contact mode. In addition, a periodic mechanical signal (typically less than 5 kHz) is applied to the base of the cantilever and the cantilever moves with a small vertical oscillation (modulation) that is significantly faster than the AFM x–y raster scan rate. The force on the sample is modulated in such a way that the average force on the sample is equal to that in contact mode. A stiff sample surface deforms the oscillation less than a soft surface. Therefore, the variation in cantilever deflection amplitude at the frequency of modulation is related to the relative stiffness/elasticity of the surface.FMAFM can be applied for nanomaterial study, including the characterization of polymer blends,210 analysis of polymer interdiffusion in carboxylated nanolatices,211 observation of semiconductor nanoheterostructures,212 and the observation of nanostructures in single crystals.213 For example, Zhao et al.214 used FMAFM to characterize the local mechanical properties of the interphase region of an epoxy matrix reinforced by carbon fibers with or without the grafting of polyhedral oligo silsesquioxane/carbon nanotubes (Fig. 14). The force modulation images and section analysis images showed clear contrast among the carbon fiber, interphase, and matrix region. The presence of polyhedral oligo silsesquioxane/carbon nanotubes induced a distinct and slow modulus transition region corresponding to the interphase.
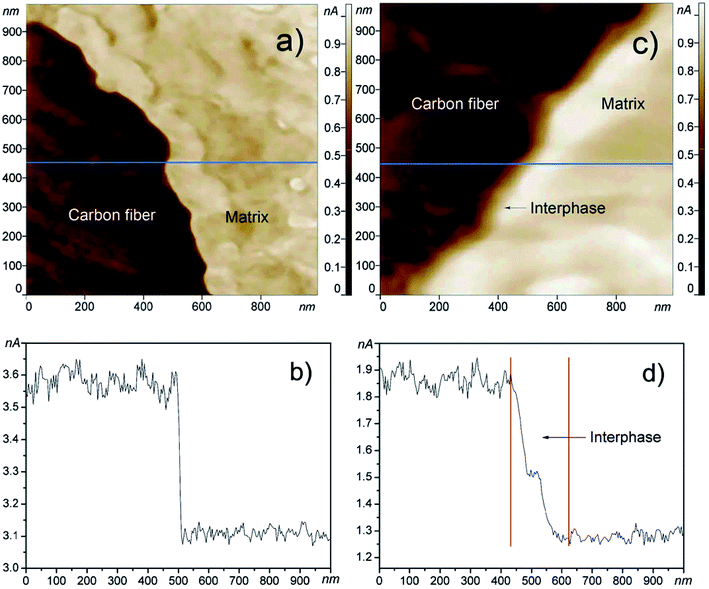 | ||
| Fig. 14 The FMAFM images obtained from the cross-section of the composites reinforced by different carbon fibers. FMAFM image (a) and section analysis (b) of the interphase in traditional carbon fiber composites, FMAFM image (c) and section analysis (d) of the interphase in polyhedral oligo silsesquioxane and carbon nanotubes grafted carbon fiber composites. Reprinted with permission from ref. 214. (Copyright 2011 Elsevier Ltd.). | ||
3.13. Surface thermal imaging
Surface thermal is imaged by scanning thermal microscopy (SThM),215,216 which is derived from contact mode AFM. As with many other modes, SThM can simultaneously acquire both the height image and surface thermal image. During the imaging process, a temperature-sensitive tip is applied to scan the sample surface and then the local temperature and thermal conductivity of the sample surface is mapped.SThM is mainly applied to analyze the surface temperature-related properties of nanomaterials such as the thermal imaging of individual silicon nanowires,217 thermal conductivity measurements of silicon/germanium nanowires218 and graphene,219 quantitative temperature measurement of an electrically heated carbon nanotube,220 correlation studies between thermal properties and the morphology of thin films,221 and direct electrocaloric measurements of a multilayer capacitor.222 For example, Grauby et al.218 used SThM to observe the thermal image of silicon/germanium nanowires (Fig. 15). The local conductance increases when the heat flux is directly applied on a nanowire. The statistical distribution of the voltage signal on the thermal image was summarized for further thermal conductivity calculations.
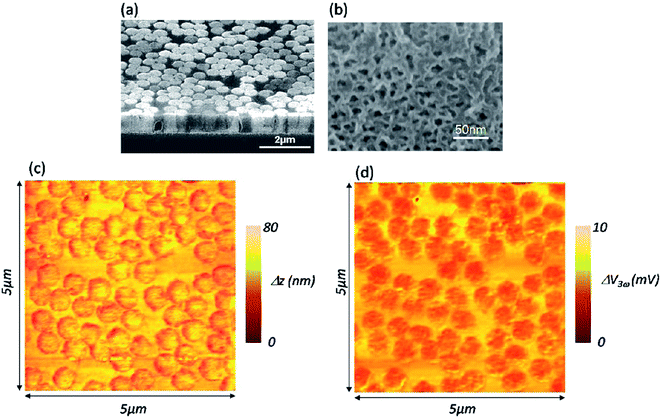 | ||
| Fig. 15 Vapor–liquid–solid Si nanowires: (a) cross-section SEM image, (b) top-view scanning electron microscopy image after the encapsulation process, (c) 2 μm × 3 μm AFM height image, and (d) 2 μm × 3 μm SThM image. Reprinted with permission from ref. 218. (Copyright 2013 American Chemical Ssociety). | ||
4. Summary and outlook
To sum up, the present review has summarized the application of AFM imaging for nanomaterial study. As a powerful nanotechnological imaging tool, AFM will undoubtedly attract the attention of more and more materials scientists and engineers in the future. Compared with other nanotechnological microscopic techniques, such as SEM and transmission electron microscopy (TEM), AFM has many advantages for nanomaterial investigations: (i) AFM can provide a true three-dimensional surface profile of nanomaterials such as graphene223 and carbon nanotube,224 which will be useful for analyzing nanomaterial morphology, the height of the materials of interest, and the surface roughness of nanomaterials. (ii) AFM has high spatial resolution (Z direction: sub-nanometer scale; X–Y direction: nanometer scale) for nanomaterials characterization.225 (iii) The sample preparation of AFM samples is simple and easy. Negative staining pretreatment is needed for TEM observation of biological samples.226 Gold-sputtering pretreatment is needed for SEM observation of non-conductive samples.227 No complicated preparations or chemical modifications are required for AFM samples. (iv) The samples can be detected in various environments (atmosphere, liquid, vacuum, and cryo) by AFM.228,229 In particular, AFM can be applied to in situ observe the materials interactions in a liquid environment, such as the interactions between a biomolecule and a supported lipid bilayer.26 Therefore, the nanoscale topographic “movie” of the nanomaterial-related processes can be obtained by in situ AFM. (v) As described in this review, AFM can measure physical properties such as surface conductivity, static charge distribution, and magnetic force fields. (vi) AFM can be easily combined with other surface microscopic or spectroscopic technologies to provide complementary analysis for nanomaterial study because AFM has a relatively bigger imaging range compared with TEM and SEM.It should be noted, however, that the application of AFM imaging for nanomaterials has several disadvantages: (i) the poor temporal resolution (in minute range) of normal AFM methods greatly limits their application in nanomaterial study. To overcome such a limitation, scientists have already developed high-speed AFM230,231 and large-scan-area high-speed AFM,232–234 which increases the temporal resolution to milliseconds. (ii) The nanofilm (e.g. supported lipid bilayers) properties such as elasticity, fluidity, and diffusion may be affected by the solid support under nanofilms.235 A support with well-defined nanopores is possible to overcome this limitation by a free-standing lipid bilayer.236–238 (iii) A sample height compression effect may occur due to the elastic deformation of the sample, and a tip-broadening effect may occur due to the tip–sample convolution.27–29 By choosing the appropriate probe and adjusting the operation parameters, the artifacts can be minimized. (iv) Under liquid, the measured height of nanomaterials by AFM is dependent on the true nanomaterial height, the electrostatic interactions, and the applied force.239,240 To measure the true topography of soft nanomaterials, it is important to eliminate the possible electrostatic repulsion and to decrease the sample compression force.
Abbreviation
| LFM | Lateral force microscopy |
| MFM | Magnetic force microscopy |
| TRM | Torsional resonance microscopy |
| CAFM | Conductive atomic force microscopy |
| AFM | Atomic force microscopy |
| STS | Scanning current spectroscopy |
| EFM | Electric force microscopy |
| SSPM | Scanning surface potential microscopy |
| SCM | Scanning capacitance microscopy |
| FMAFM | Force modulation atomic force microscopy |
| SThM | Scanning thermal microscopy |
| SSRM | Scanning spreading resistance microscopy |
| STM | Scanning tunneling microscopy |
| SEM | Scanning electron microscopy |
| TEM | Transmission electron microscopy |
Acknowledgements
This study has been supported by research grants from the National Natural Science Foundation of China (51203024), the Shanghai Pujiang Talent Program (12PJ1430300), and the Special Fund for Talents in Minhang District of Shanghai (2012).References
- G. Binnig, C. F. Quate and C. Gerber, Phys. Rev. Lett., 1986, 56, 930–933 CrossRef PubMed.
- T. Kajiyama, K. Tanaka, S.-R. Ge and A. Takahara, Prog. Surf. Sci., 1996, 52, 1–52 CrossRef CAS.
- L. Bozec and M. Horton, Biophys. J., 2005, 88, 4223–4231 CrossRef CAS PubMed.
- D. J. Müller and Y. F. Dufrene, Nat. Nanotechnol, 2008, 3, 261–269 CrossRef PubMed.
- A. A. Tseng, Nano Today, 2011, 6, 493–509 CrossRef CAS.
- G. R. Luis and L. Jian, J. Phys.: Condens. Matter, 2009, 21, 483001 CrossRef PubMed.
- D. L. Schodek, P. Ferreira and M. F. Ashby, Nanomaterials, nanotechnologies and design: an introduction for engineers and architects, Butterworth-Heinemann, 2009 Search PubMed.
- M. J. Pitkethly, Mater. Today, 2004, 7, 20–29 CrossRef.
- N. Tran and P. A. Tran, ChemPhysChem, 2012, 13, 2481–2494 CrossRef CAS PubMed.
- G. Cao and C. J. Brinker, Annual Review of Nano Research: Volume 2, World Scientific, 2008, vol. 2 Search PubMed.
- D. Shi, Nanomaterials and Devices, Elsevier, 2014 Search PubMed.
- L. Yang, L. Zhang and T. J. Webster, Adv. Eng. Mater., 2011, 13, B197–B217 CrossRef.
- A. Gasparotto, D. Barreca, C. Maccato and E. Tondello, Nanoscale, 2012, 4, 2813–2825 RSC.
- H. Dong and W. Hu, Organic Nanomaterials, in Springer Handbook of Nanomaterials, ed. R. Vajtai, Springer, Berlin Heidelberg, 2013, pp. 905–940 Search PubMed.
- A. C. Grimsdale and K. Müllen, Angew. Chem., Int. Ed., 2005, 44, 5592–5629 CrossRef CAS PubMed.
- S.-F. Torabi and Y. Lu, Curr. Opin. Biotechnol., 2014, 28, 88–95 CrossRef CAS PubMed.
- J. Yan, C. Hu, X. Liu, J. Zhong, G. Sun and D. He, Curr. Pharm. Des., 2015, 21, 3181–3190 CrossRef CAS PubMed.
- C. Sanchez, P. Belleville, M. Popall and L. Nicole, Chem. Soc. Rev., 2011, 40, 696–753 RSC.
- S. J. Klaine, P. J. Alvarez, G. E. Batley, T. F. Fernandes, R. D. Handy, D. Y. Lyon, S. Mahendra, M. J. McLaughlin and J. R. Lead, Environ. Toxicol. Chem., 2008, 27, 1825–1851 CrossRef CAS PubMed.
- Q. Zhang, E. Uchaker, S. L. Candelaria and G. Cao, Chem. Soc. Rev., 2013, 42, 3127–3171 RSC.
- T. Dawson, Color. Technol., 2008, 124, 261–272 CAS.
- V. Morris, Trends Biotechnol., 2011, 29, 509–516 CrossRef CAS PubMed.
- J. A. Barreto, W. O'Malley, M. Kubeil, B. Graham, H. Stephan and L. Spiccia, Adv. Mater., 2011, 23, H18–H40 CrossRef CAS PubMed.
- J. A. Hubbell and A. Chilkoti, Science, 2012, 337, 303–305 CrossRef PubMed.
- L. Zhang and T. J. Webster, Nano Today, 2009, 4, 66–80 CrossRef CAS.
- J. Zhong, Integr. Biol., 2011, 3, 632–644 RSC.
- K. L. Westra, A. W. Mitchell and D. J. Thomson, J. Appl. Phys., 1993, 74, 3608–3610 CrossRef CAS.
- M. N. Murray, H. G. Hansma, M. Bezanilla, T. Sano, D. F. Ogletree, W. Kolbe, C. L. Smith, C. R. Cantor, S. Spengler and P. K. Hansma, Proc. Natl. Acad. Sci. U. S. A., 1993, 90, 3811–3814 CrossRef CAS.
- J. Yang, J. Mou, J. Y. Yuan and Z. Shao, J. Microsc., 1996, 182, 106–113 CrossRef CAS PubMed.
- J. Villarrubia, J. Res. Natl. Inst. Stand. Technol., 1997, 102, 425–454 CrossRef.
- E. E. Urena-Benavides, P. J. Brown and C. L. Kitchens, Langmuir, 2010, 26, 14263–14270 CrossRef CAS PubMed.
- M. Plodinec, M. Loparic and U. Aebi, Cold Spring Harbor Protocols, 2010, pdb.top86 Search PubMed.
- S. S. Wong, J. D. Harper, P. T. Lansbury and C. M. Lieber, J. Am. Chem. Soc., 1998, 120, 603–604 CrossRef CAS.
- P. Samorì, A. Ebner, L. Wildling, R. Zhu, C. Rankl, T. Haselgrübler, P. Hinterdorfer and H. Gruber, Functionalization of Probe Tips and Supports for Single-Molecule Recognition Force Microscopy, in STM and AFM Studies on (Bio)molecular Systems: Unravelling the Nanoworld, Springer, Berlin/Heidelberg, 2008, vol. 285, pp. 29–76 Search PubMed.
- M. Plodinec, M. Loparic and U. Aebi, Cold Spring Harbor Protocols, 2010 DOI:10.1101/pdb.prot5502.
- VEECO A Practical Guide to Scanning Probe Microscopy, http://www.veeco.com/pdfs/library/SPM_Guide_0829_05_166.pdf.
- D. Fotiadis, Y. Liang, S. Filipek, D. A. Saperstein, A. Engel and K. Palczewski, Nature, 2003, 421, 127–128 CrossRef CAS PubMed.
- W. W. Scott and B. Bhushan, Ultramicroscopy, 2003, 97, 151–169 CrossRef CAS PubMed.
- G. Meyer and N. M. Amer, Appl. Phys. Lett., 1990, 57, 2089–2091 CrossRef CAS.
- M. Raşa, B. Kuipers and A. Philipse, J. Colloid Interface Sci., 2002, 250, 303–315 CrossRef PubMed.
- N. Chen and B. Bhushan, J. Microsc., 2005, 220, 96–112 CrossRef CAS PubMed.
- T. Ishida, W. Mizutani, Y. Aya, H. Ogiso, S. Sasaki and H. Tokumoto, J. Phys. Chem. B, 2002, 106, 5886–5892 CrossRef CAS.
- P. Bridger, Z. Bandić, E. Piquette and T. McGill, Appl. Phys. Lett., 1999, 74, 3522–3524 CrossRef CAS.
- J. Nichols, D. Gundlach and T. Jackson, Appl. Phys. Lett., 2003, 83, 2366–2368 CrossRef CAS.
- G. Neubauer, A. Erickson, C. C. Williams, J. J. Kopanski, M. Rodgers and D. Adderton, J. Vac. Sci. Technol., B, 1996, 14, 426–432 CAS.
- H. Yamada, Y. Hirata and J. Miyake, J. Vac. Sci. Technol., A, 1995, 13, 1742–1745 CAS.
- G. Mills, H. Zhou, A. Midha, L. Donaldson and J. Weaver, Appl. Phys. Lett., 1998, 72, 2900–2902 CrossRef CAS.
- P. Eyben, S. Denis, T. Clarysse and W. Vandervorst, Mater. Sci. Eng., B, 2003, 102, 132–137 CrossRef.
- M. Rief, F. Oesterhelt, B. Heymann and H. E. Gaub, Science, 1997, 275, 1295–1297 CrossRef CAS PubMed.
- F. Gaboriaud, B. S. Parcha, M. L. Gee, J. A. Holden and R. A. Strugnell, Colloids Surf., B, 2008, 62, 206–213 CrossRef CAS PubMed.
- C. A. Clifford and M. P. Seah, Appl. Surf. Sci., 2005, 252, 1915–1933 CrossRef CAS.
- A. Gestos, P. G. Whitten, G. M. Spinks and G. G. Wallace, Polym. Test., 2013, 32, 655–664 CrossRef CAS.
- S.-Y. Gu, Q.-L. Wu, J. Ren and G. J. Vancso, Macromol. Rapid Commun., 2005, 26, 716–720 CrossRef CAS.
- Y. Yang, G. Wang and X. Li, Nano Lett., 2011, 11, 2845–2848 CrossRef CAS PubMed.
- R. D. Piner, J. Zhu, F. Xu, S. Hong and C. A. Mirkin, Science (Washington, DC, U. S.), 1999, 283, 661–663 CrossRef CAS.
- K. Salaita, Y. Wang and C. A. Mirkin, Nat. Nanotechnol., 2007, 2, 145–155 CrossRef CAS PubMed.
- M. Liu, N. A. Amro and G.-Y. Liu, Annu. Rev. Phys. Chem., 2008, 59, 367–386 CrossRef CAS PubMed.
- S. Xu and G.-Y. Liu, Langmuir, 1997, 13, 127–129 CrossRef CAS.
- A. G. Khurshudov, K. Kato and H. Koide, Tribol. Lett., 1996, 2, 345–354 CrossRef CAS.
- Y. Li, B. W. Maynor and J. Liu, J. Am. Chem. Soc., 2001, 123, 2105–2106 CrossRef CAS PubMed.
- L. G. Rosa and J. Liang, J. Phys.: Condens. Matter, 2009, 21, 483001 CrossRef PubMed.
- F. J. Rubio-Sierra, W. M. Heckl and R. W. Stark, Adv. Eng. Mater., 2005, 7, 193–196 CrossRef CAS.
- D. M. Czajkowsky, L. Li, J. Sun, J. Hu and Z. Shao, ACS Nano, 2011, 6, 190–198 CrossRef PubMed.
- H. Qian, D.-S. Guo and Y. Liu, Chem.–Eur. J., 2012, 18, 5087–5095 CrossRef CAS PubMed.
- H. Qian, D.-S. Guo and Y. Liu, Asian J. Org. Chem., 2012, 1, 155–159 CrossRef CAS.
- L. Ke, S. C. Lai, H. Liu, C. K. N. Peh, B. Wang and J. H. Teng, ACS Appl. Mater. Interfaces, 2012, 4, 1247–1253 CAS.
- R. B. Pernites, M. J. L. Felipe, E. L. Foster and R. C. Advincula, ACS Appl. Mater. Interfaces, 2011, 3, 817–827 CAS.
- J. Bochmann, A. Vainsencher, D. D. Awschalom and A. N. Cleland, Nat. Phys., 2013, 9, 712–716 CrossRef CAS.
- G. Liu, D. J. Eichelsdoerfer, B. Rasin, Y. Zhou, K. A. Brown, X. Liao and C. A. Mirkin, Proc. Natl. Acad. Sci. U. S. A., 2013, 110, 887–891 CrossRef CAS PubMed.
- X. Xu, J. Melcher, S. Basak, R. Reifenberger and A. Raman, Phys. Rev. Lett., 2009, 102, 060801 CrossRef PubMed.
- X. Xu, C. Carrasco, P. J. de Pablo, J. Gomez-Herrero and A. Raman, Biophys. J., 2008, 95, 2520–2528 CrossRef CAS PubMed.
- J. Zhong, M. Ma, W. Li, J. Zhou, Z. Yan and D. He, Biopolymers, 2014, 101, 1181–1192 CrossRef CAS PubMed.
- J. Zhong, W. Zheng, L. Huang, Y. Hong, L. Wang, Y. Qiu and Y. Sha, Biochim. Biophys. Acta, Biomembr., 2007, 1768, 1420–1429 CrossRef CAS PubMed.
- J. Zhong, C. Yang, W. Zheng, L. Huang, Y. Hong, L. Wang and Y. Sha, Biophys. J., 2009, 96, 4610–4621 CrossRef CAS PubMed.
- E. Martines, J. Zhong, J. Muzard, A. C. Lee, B. B. Akhremitchev, D. M. Suter and G. U. Lee, Biophys. J., 2012, 103, 649–657 CrossRef CAS PubMed.
- B. Heymann and H. Grubmüller, Phys. Rev. Lett., 2000, 84, 6126–6129 CrossRef CAS PubMed.
- F.-C. Zhang, F. Zhang, H.-N. Su, H. Li, Y. Zhang and J. Hu, ACS Nano, 2010, 4, 5791–5796 CrossRef CAS PubMed.
- M. Kim, C.-C. Wang, F. Benedetti, M. Rabbi, V. Bennett and P. E. Marszalek, Adv. Mater., 2011, 23, 5684–5688 CrossRef CAS PubMed.
- K. C. Neuman and A. Nagy, Nat. Methods, 2008, 5, 491–505 CrossRef CAS PubMed.
- Y. Zhang, X. Hu, J. Sun, Y. Shen, J. Hu, X. Xu and Z. Shao, Microsc. Res. Tech., 2011, 74, 614–626 CrossRef CAS PubMed.
- C. Dong, M. L. Kashon, D. Lowry, J. S. Dordick, S. H. Reynolds, Y. Rojanasakul, L. M. Sargent and C. Z. Dinu, Adv. Healthcare Mater., 2013, 2, 945–951 CrossRef CAS PubMed.
- C. Dong, R. Eldawud, L. M. Sargent, M. L. Kashon, D. Lowry, Y. Rojanasakul and C. Z. Dinu, Environ. Sci.: Nano, 2014, 1, 595–603 RSC.
- H. Zhou, Q. Xu, S. Li, Y. Zheng, X. Wu, C. Gu, Y. Chen and J. Zhong, RSC Adv., 2015, 5, 91633–91639 RSC.
- Q. Xu, Y. Wan, T. S. Hu, T. X. Liu, D. Tao, P. H. Niewiarowski, Y. Tian, Y. Liu, L. Dai, Y. Yang and Z. Xia, Nat. Commun., 2015, 6 DOI:10.1038/ncomms9949.
- Y. Yan, Z. Hu, X. Zhao, T. Sun, S. Dong and X. Li, Small, 2010, 6, 724–728 CrossRef CAS PubMed.
- J. Zhong, M. Ma, J. Zhou, D. Wei, Z. Yan and D. He, ACS Appl. Mater. Interfaces, 2013, 5, 737–746 CAS.
- J. Zhong, G. Sun and D. He, Nanoscale, 2014, 6, 12217–12228 RSC.
- Y. Zhou, Z. Xie, K. A. Brown, D. J. Park, X. Zhou, P.-C. Chen, M. Hirtz, Q.-Y. Lin, V. P. Dravid, G. C. Schatz, Z. Zheng and C. A. Mirkin, Small, 2015, 11, 913–918 CrossRef CAS PubMed.
- G. Liu, Y. Zhou, R. S. Banga, R. Boya, K. A. Brown, A. J. Chipre, S. T. Nguyen and C. A. Mirkin, Chem. Sci., 2013, 4, 2093–2099 RSC.
- J. Zhong and D. He, Sci. Rep., 2015, 5, 12998 CrossRef CAS PubMed.
- M. S. Anderson and W. T. Pike, Rev. Sci. Instrum., 2002, 73, 1198–1203 CrossRef CAS.
- S. Moreno Flores and J. L. Toca-Herrera, Nanoscale, 2009, 1, 40–49 RSC.
- X. Chen, K. M. Shakesheff, M. C. Davies, J. Heller, C. J. Roberts, S. J. B. Tendler and P. M. Williams, J. Phys. Chem., 1995, 99, 11537–11542 CrossRef CAS.
- P. Karageorgiev, H. Orendi, B. Stiller and L. Brehmer, Appl. Phys. Lett., 2001, 79, 1730–1732 CrossRef CAS.
- F. Iwata, K. Saruta and A. Sasaki, Appl. Phys. A, 1998, 66, S463–S466 CrossRef CAS.
- P. Xiao, J. Gu, J. Chen, J. Zhang, R. Xing, Y. Han, J. Fu, W. Wang and T. Chen, Chem. Commun., 2014, 50, 7103–7106 RSC.
- I. Casuso, N. Kodera, C. Le Grimellec, T. Ando and S. Scheuring, Biophys. J., 2009, 97, 1354–1361 CrossRef CAS PubMed.
- P. D. Bosshart, A. Engel and D. Fotiadis, Rhodopsin: Methods and Protocols, 2015, pp. 189–203 Search PubMed.
- H. M. Ehmann, T. Kellner and O. Werzer, CrystEngComm, 2014, 16, 4950–4954 RSC.
- I. Kirrou and M. Belhaq, Nonlinear Dyn., 2015, 1–13 Search PubMed.
- N. Shamitko-Klingensmith and J. Legleiter, Scanning, 2015, 37, 23–35 CrossRef CAS PubMed.
- J. Zhong, X. Liu, D. Wei, J. Yan, P. Wang, G. Sun and D. He, Int. J. Biol. Macromol., 2015, 76, 195–202 CrossRef CAS PubMed.
- J. Zhong, W. Zheng, L. Huang, Y. Hong, L. Wang, Y. Qiu and Y. Sha, Biochim. Biophys. Acta, Biomembr., 2007, 1768, 1420–1429 CrossRef CAS PubMed.
- M. Ma, J. Zhong, W. Li, J. Zhou, Z. Yan, J. Ding and D. He, Soft Matter, 2013, 9, 11325–11333 RSC.
- M. Bag, T. S. Gehan, L. A. Renna, D. D. Algaier, P. M. Lahti and D. Venkataraman, RSC Adv., 2014, 4, 45325–45331 RSC.
- N. Kemnade, C. J. Shearer, D. J. Dieterle, A. S. Cherevan, P. Gebhardt, G. Wilde and D. Eder, Nanoscale, 2015, 7, 3028–3034 RSC.
- Z. Xu, S. Zhu, M. Wang, Y. Li, P. Shi and X. Huang, ACS Appl. Mater. Interfaces, 2015, 7, 1355–1363 CAS.
- Z. Zhang, L. Zhang, W. Li, A. Yu and P. Wu, ACS Appl. Mater. Interfaces, 2015, 7, 10395–10400 CAS.
- A. Qin, X. Li, X. Zhao, D. Liu and C. He, ACS Appl. Mater. Interfaces, 2015, 7, 8427–8436 CAS.
- D. Dallaeva, Ş. Ţălu, S. Stach, P. Škarvada, P. Tománek and L. Grmela, Appl. Surf. Sci., 2014, 312, 81–86 CrossRef CAS.
- Y. Zhao, X. Liu, D. Y. Lei and Y. Chai, Nanoscale, 2014, 6, 1311–1317 RSC.
- J. Tian, C. Tu, Y. Liang, J. Zhou and X. Ye, J. Neurosci. Methods, 2015, 253, 151–160 CrossRef PubMed.
- L. H. Li, T. Xing, Y. Chen and R. Jones, Adv. Mater. Interfaces, 2014, 1, 130032 Search PubMed.
- F. Stipić, G. Pletikapić, Ž. Jakšić, L. Frkanec, G. Zgrablić, P. Burić and D. M. Lyons, J. Phys. Chem. B, 2015, 119, 1259–1264 CrossRef PubMed.
- S. Tammam, S. Mathur and N. Afifi, J. Biomed. Nanotechnol., 2012, 8, 439–449 CrossRef CAS PubMed.
- N. Oddone, A. Zambrana, M. Tassano, W. Porcal, P. Cabral and J. Benech, J. Nanopart. Res., 2013, 15, 1–14 CrossRef.
- L. Qin, W. Zhang, J. Lu, A. G. Stack and L. Wang, Environ. Sci. Technol., 2013, 47, 13365–13374 CrossRef CAS PubMed.
- L. Wang, C. V. Putnis, E. Ruiz-Agudo, J. Hövelmann and A. Putnis, Environ. Sci. Technol., 2015, 49, 4184–4192 CrossRef CAS PubMed.
- T. Gädt, F. H. Schacher, N. McGrath, M. A. Winnik and I. Manners, Macromolecules, 2011, 44, 3777–3786 CrossRef.
- S. N. Magonov, V. Elings and M. H. Whangbo, Surf. Sci., 1997, 375, L385–L391 CrossRef CAS.
- S. Strbac, M. Nenadovic, L. Rajakovic and Z. Rakocevic, Appl. Surf. Sci., 2010, 256, 3895–3899 CrossRef CAS.
- M. Nenadović, J. Potočnik, M. Ristić, S. Štrbac and Z. Rakočević, Surf. Coat. Technol., 2012, 206, 4242–4248 CrossRef.
- M. Jung and J.-W. Choi, Ultramicroscopy, 2010, 110, 670–675 CrossRef CAS PubMed.
- H. L. Gao, X. W. Zhang, J. H. Meng, Z. G. Yin, L. Q. Zhang, J. L. Wu and X. Liu, Thin Solid Films, 2015, 576, 81–87 CrossRef CAS.
- J. Zhong, M. Ma, W. Li, J. Zhou, Z. Yan, J. Ding and D. He, Biopolymers, 2014, 101, 1181–1192 CrossRef CAS PubMed.
- Lateral Force Microscopy (LFM), in Encyclopedia of Nanotechnology, ed. B. Bhushan, Springer, Netherlands, 2012, pp. 1192–1192 Search PubMed.
- R. Bennewitz, Friction Force Microscopy, in Fundamentals of Friction and Wear on the Nanoscale, ed. E. Gnecco and E. Meyer, Springer International Publishing, 2015, pp. 3–16 Search PubMed.
- A. Schirmeisen, U. Schwarz and H. Hölscher, Friction Force Microscopy, in Encyclopedia of Nanotechnology, ed. B. Bhushan, Springer, Netherlands, 2012, pp. 884–892 Search PubMed.
- R. K. Pandey and V. Lakshminarayanan, Thin Solid Films, 2014, 562, 367–371 CrossRef CAS.
- A. Peled and J. Weiss, Construct. Build. Mater., 2011, 25, 4299–4302 CrossRef.
- A. Peled, J. Castro and W. J. Weiss, Cem. Concr. Compos., 2013, 36, 48–55 CrossRef CAS.
- C. M. Almeida, V. Carozo, R. Prioli and C. A. Achete, J. Appl. Phys., 2011, 110, 086101 CrossRef.
- Y.-C. Liao, H. Sun and B. L. Weeks, Scanning, 2012, 34, 200–205 CrossRef CAS PubMed.
- U. Hartmann, Annu. Rev. Mater. Sci., 1999, 29, 53–87 CrossRef CAS.
- H. Li, X. Qi, J. Wu, Z. Zeng, J. Wei and H. Zhang, ACS Nano, 2013, 7, 2842–2849 CrossRef CAS PubMed.
- G. Cordova, S. Attwood, R. Gaikwad, F. Gu and Z. Leonenko, Nano Biomed. Eng., 2014, 6, 31–39 CAS.
- L. Angeloni, D. Passeri, M. Reggente, M. Rossi, D. Mantovani, L. Lazzaro, F. Nepi, F. De Angelis and M. Barteri, in Experimental issues in magnetic force microscopy of nanoparticles, NANOFORUM 2014, AIP Publishing, 2015, p. 020010 Search PubMed.
- S. Sievers, K.-F. Braun, D. Eberbeck, S. Gustafsson, E. Olsson, H. W. Schumacher and U. Siegner, Small, 2012, 8, 2675–2679 CrossRef CAS PubMed.
- M. Coïsson, G. Barrera, F. Celegato, E. Enrico, E. Olivetti, P. Tiberto and F. Vinai, J. Magn. Magn. Mater., 2015, 373, 250–254 CrossRef.
- M. R. Tabasum, F. Zighem, J. D. L. T. Medina, A. Encinas, L. Piraux and B. Nysten, Nanotechnology, 2014, 25, 245707 CrossRef CAS PubMed.
- M. Gavagnin, H. D. Wanzenboeck, D. Belic, M. M. Shawrav, A. Persson, K. Gunnarsson, P. Svedlindh and E. Bertagnolli, Phys. Status Solidi A, 2014, 211, 368–374 CrossRef CAS.
- A. Fernández-Pacheco, R. Cowburn, L. Serrano-Ramón, M. R. Ibarra and J. De Teresa, Combining Micromanipulation, Kerr Magnetometry and Magnetic Force Microscopy for Characterization of Three-Dimensional Magnetic Nanostructures, in Surface Science Tools for Nanomaterials Characterization, ed. C. S. S. R. Kumar, Springer, Berlin Heidelberg, 2015, pp. 531–559 Search PubMed.
- C. Su, L. Huang, C. Prater and B. Bhushan, Torsional Resonance Microscopy and Its Applications, in Applied Scanning Probe Methods V, ed. B. Bhushan, S. Kawata and H. Fuchs, Springer, Berlin Heidelberg, 2007, pp. 113–148 Search PubMed.
- T. Kasai, B. Bhushan, L. Huang and C. Su, Nanotechnology, 2004, 15, 731–742 CrossRef CAS.
- C. Su, L. Huang, P. Neilson and V. Kelley, AIP Conf. Proc., 2003, 696, 349–356 CrossRef.
- T. Kunstmann, A. Schlarb, M. Fendrich, D. Paulkowski, T. Wagner and R. Möller, Appl. Phys. Lett., 2006, 88, 153112 CrossRef.
- I.-S. Hwang, C.-W. Yang, P.-H. Su, E.-T. Hwu and H.-S. Liao, Ultramicroscopy, 2013, 135, 121–125 CrossRef CAS PubMed.
- A. Yurtsever, A. M. Gigler and R. W. Stark, Ultramicroscopy, 2009, 109, 275–279 CrossRef CAS PubMed.
- G. WeissmÜLler, A. Yurtsever, L. T. Costa, A. B. F. Pacheco, P. M. Bisch, W. M. Heckl and R. W. Stark, Nano, 2008, 03, 443–448 CrossRef.
- A. Yurtsever, A. M. Gigler, C. Dietz and R. W. Stark, Appl. Phys. Lett., 2008, 92, 143103 CrossRef.
- Y. Chih-Wen, D. Ren-Feng, L. Shih-Hsiu, L. Hsien-Shun, L. Wei-Chiao, H. Kuang-Yuh, C. Chia-Seng and H. Ing-Shouh, Nanotechnology, 2013, 24, 305702 CrossRef PubMed.
- A. Kaidatzis and J. García-Martín, Nanotechnology, 2013, 24, 165704 CrossRef CAS PubMed.
- C. Teichert and I. Beinik, Conductive atomic-force microscopy investigation of nanostructures in microelectronics, in Scanning Probe Microscopy in Nanoscience and Nanotechnology 2, Springer, 2011, pp. 691–721 Search PubMed.
- C. J. Chen, Introduction to scanning tunneling microscopy, Oxford University Press, 2008 Search PubMed.
- C. Li, Y. Bando and D. Golberg, ACS Nano, 2010, 4, 2422–2428 CrossRef CAS PubMed.
- P. Gundersen, K. O. Kongshaug, E. Selvig and R. Haakenaasen, J. Appl. Phys., 2010, 108, 4308–114308 CrossRef.
- J. Alvarez, I. Ngo, M.-E. Gueunier-Farret, J.-P. Kleider, L. Yu, P. Cabarrocas, S. Perraud, E. Rouvière, C. Celle, C. Mouchet and J.-P. Simonato, Nanoscale Res. Lett., 2011, 6, 1–9 CrossRef PubMed.
- K. Ganesan, S. Ilango, S. Mariyappan, M. F. Baroughi, M. Kamruddin and A. K. Tyagi, Appl. Phys. Lett., 2011, 98, 092902 CrossRef.
- S. Wang, G. Cheng, K. Cheng, X. Jiang and Z. Du, Nanoscale Res. Lett., 2011, 6, 541 CrossRef PubMed.
- Y. Lv, J. Cui, Z. M. Jiang and X. J. Yang, Nanotechnology, 2013, 24, 065702 CrossRef CAS PubMed.
- A. Vetushka, T. Itoh, Y. Nakanishi, A. Fejfar, S. Nonomura, M. Ledinský and J. Kočka, J. Non-Cryst. Solids, 2012, 358, 2545–2547 CrossRef CAS.
- I. Beinik, M. Kratzer, A. Wachauer, L. Wang, R. T. Lechner, C. Teichert, C. Motz, W. Anwand, G. Brauer, X. Y. Chen, X. Y. Hsu and A. B. Djurišić, J. Appl. Phys., 2011, 110, 052005 CrossRef.
- S. Raccosta, C. Baldacchini, A. Rita Bizzarri and S. Cannistraro, Appl. Phys. Lett., 2013, 102, 203704 CrossRef.
- F. Giannazzo, I. Deretzis, G. Nicotra, G. Fisichella, C. Spinella, F. Roccaforte and A. La Magna, Appl. Surf. Sci., 2014, 291, 53–57 CrossRef CAS.
- M. Basletic, J. L. Maurice, C. Carretero, G. Herranz, O. Copie, M. Bibes, E. Jacquet, K. Bouzehouane, S. Fusil and A. Barthelemy, Nat. Mater., 2008, 7, 621–625 CrossRef CAS PubMed.
- O. Yuki, K. Shigeru, O. Yutaka and M. Takashi, Nanotechnology, 2011, 22, 195202 CrossRef PubMed.
- T. Massoud, V. Maurice, L. H. Klein, A. Seyeux and P. Marcus, Corros. Sci., 2014, 84, 198–203 CrossRef CAS.
- G. A. MacDonald, P. A. Veneman, D. Placencia and N. R. Armstrong, ACS Nano, 2012, 6, 9623–9636 CrossRef CAS PubMed.
- S. Sonde, F. Giannazzo, V. Raineri, R. Yakimova, J.-R. Huntzinger, A. Tiberj and J. Camassel, Phys. Rev. B: Condens. Matter Mater. Phys., 2009, 80, 241406 CrossRef.
- S. Sonde, F. Giannazzo, V. Raineri and E. Rimini, Phys. Status Solidi B, 2010, 247, 912–915 CAS.
- D. Wood, I. Hancox, T. S. Jones and N. R. Wilson, J. Phys. Chem. C, 2015, 11459–11467 CAS.
- D. Sarid, Scanning force microscopy: with applications to electric, magnetic, and atomic forces, Oxford University Press, 1994 Search PubMed.
- R. Gaikwad, A. Hande, S. Das, S. K. Mitra and T. Thundat, Langmuir, 2015, 31, 679–684 CrossRef CAS PubMed.
- Q. Iqbal, P. Bernstein, Y. Zhu, J. Rahamim, P. Cebe and C. Staii, Nanotechnology, 2015, 26, 105702 CrossRef PubMed.
- H. Du, D. Li, Y. Wang, C. Wang, D. Zhang, Y.-l. Yang and C. Wang, J. Phys. Chem. B, 2013, 117, 9895–9899 CrossRef CAS PubMed.
- S. E. Yalcin, C. Galande, R. Kappera, H. Yamaguchi, U. Martinez, K. A. Velizhanin, S. K. Doorn, A. M. Dattelbaum, M. Chhowalla, P. M. Ajayan, G. Gupta and A. D. Mohite, ACS Nano, 2015, 9, 2981–2988 CrossRef CAS PubMed.
- Q. Chen, L. Mao, Y. Li, T. Kong, N. Wu, C. Ma, S. Bai, Y. Jin, D. Wu, W. Lu, B. Wang and L. Chen, Nat. Commun., 2015, 6 DOI:10.1038/ncomms8745.
- H. R. Moutinho, R. G. Dhere, C.-S. Jiang, Y. Yan, D. S. Albin and M. M. Al-Jassim, J. Appl. Phys., 2010, 108, 074503 CrossRef.
- Y. Hu, N. Berdunov, C.-A. Di, I. Nandhakumar, F. Zhang, X. Gao, D. Zhu and H. Sirringhaus, ACS Nano, 2014, 8, 6778–6787 CrossRef CAS PubMed.
- L. C. Teague, O. D. Jurchescu, C. A. Richter, S. Subramanian, J. E. Anthony, T. N. Jackson, D. J. Gundlach and J. G. Kushmerick, Appl. Phys. Lett., 2010, 96, 203305 CrossRef.
- R. E. Hill-Pearce, V. Eless, A. Lartsev, N. A. Martin, I. L. Barker Snook, J. J. Helmore, R. Yakimova, J. C. Gallop and L. Hao, Carbon, 2015, 93, 896–902 CrossRef CAS.
- M. Salvador, S. M. Vorpahl, H. Xin, W. Williamson, G. Z. Shao, D. U. Karatay, H. W. Hillhouse and D. S. Ginger, Nano Lett., 2014, 14, 6926–6930 CrossRef CAS PubMed.
- Y. Batra, D. Rai and B. R. Mehta, Appl. Phys. Express, 2013, 6 DOI:10.7567/apex.6.041602.
- H. Yoo, C. Bae, Y. Yang, S. Lee, M. Kim, H. Kim, Y. Kim and H. Shin, Nano Lett., 2014, 14, 4413–4417 CrossRef CAS PubMed.
- A. Kumar, A. S. Patel and T. Mohanty, J. Phys. Chem. C, 2012, 116, 20404–20408 CAS.
- Z. Z. Wang, Y. S. Gu, J. J. Qi, S. N. Lu, P. F. Li, P. Lin and Y. Zhang, RSC Adv., 2015, 5, 42075–42080 RSC.
- J. Li, X. Qi, G. L. Hao, K. Huang and J. X. Zhong, Fullerenes, Nanotubes, Carbon Nanostruct., 2015, 23, 777–781 CrossRef CAS.
- T. Wagner, D. Kohler, P. Milde and L. M. Eng, Appl. Phys. Lett., 2013, 103, 023102 CrossRef.
- G. J. Jones, A. Kazemi, S. Crampin, M. Phillips and A. Ilie, Appl. Phys. Express, 2012, 5, 045103 CrossRef.
- Y. Li, C.-Y. Xu and L. Zhen, Appl. Phys. Lett., 2013, 102, 143110 CrossRef.
- C. V. Ben, H. D. Cho, T. W. Kang and W. Yang, Surf. Interface Anal., 2012, 44, 755–758 CrossRef CAS.
- J. R. Matey and J. Blanc, J. Appl. Phys., 1985, 57, 1437–1444 CrossRef.
- E. Bussmann, M. Rudolph, G. S. Subramania, S. Misra, S. M. Carr, E. Langlois, J. Dominguez, T. Pluym, M. P. Lilly and M. S. Carroll, Nanotechnology, 2015, 26, 085701 CrossRef CAS PubMed.
- F. Bassani, P. Periwal, B. Salem, N. Chevalier, D. Mariolle, G. Audoit, P. Gentile and T. Baron, Phys. Status Solidi RRL, 2014, 8, 312–316 CrossRef CAS.
- P. Periwal, F. Bassani, G. Patriarche, L. Latu-Romain, V. Brouzet, B. Salem and T. Baron, Phys. Status Solidi A, 2014, 211, 509–513 CrossRef CAS.
- I. Humer, O. Bethge, M. Bodnarchuk, M. Kovalenko, M. Yarema, W. Heiss, H. P. Huber, M. Hochleitner, P. Hinterdorfer, F. Kienberger and J. Smoliner, J. Appl. Phys., 2011, 109, 064313 CrossRef.
- K. W. Park, H. P. Nair, A. M. Crook, S. R. Bank and E. T. Yu, Appl. Phys. Lett., 2011, 99, 133114 CrossRef.
- Z. Lin, G. Bremond and F. Bassani, Nanoscale Res. Lett., 2011, 6, 163 CrossRef PubMed.
- P. Eyben, T. Janssens and W. Vandervorst, Mater. Sci. Eng., B, 2005, 124–125, 45–53 CrossRef.
- A. Schulze, T. Hantschel, P. Eyben, A. S. Verhulst, R. Rooyackers, A. Vandooren, J. Mody, A. Nazir, D. Leonelli and W. Vandervorst, Nanotechnology, 2011, 22, 185701 CrossRef CAS PubMed.
- P. Eyben, T. Clarysse, J. Mody, A. Nazir, A. Schulze, T. Hantschel and W. Vandervorst, Solid-State Electron., 2012, 71, 69–73 CrossRef CAS.
- S. Tewfik, S. Marco and C. Matteo, Nanotechnology, 2012, 23, 405704 CrossRef PubMed.
- P. Calka, E. Martinez, V. Delaye, D. Lafond, G. Audoit, D. Mariolle, N. Chevalier, H. Grampeix, C. Cagli, V. Jousseaume and C. Guedj, Nanotechnology, 2013, 24, 085706 CrossRef CAS PubMed.
- A. Schulze, T. Hantschel, P. Eyben, A. S. Verhulst, R. Rooyackers, A. Vandooren and W. Vandervorst, Ultramicroscopy, 2013, 125, 18–23 CrossRef CAS PubMed.
- S. Doering, A. Wachowiak, M. Rochel, C. Nowak, M. Hoffmann, U. Winkler, M. Richter, H. Roetz, S. Eckl and T. Mikolajick, Microelectron. Eng., 2015, 142, 40–46 CrossRef CAS.
- I. S. Fraser, R. A. Oliver, J. Sumner, C. McAleese, M. J. Kappers and C. J. Humphreys, Appl. Surf. Sci., 2007, 253, 3937–3944 CrossRef CAS.
- J. Liu, K. C. Mandal and G. Koley, Semicond. Sci. Technol., 2009, 24, 045012 CrossRef.
- M. Truchlý, T. Plecenik, O. Krško, M. Gregor, L. Satrapinskyy, T. Roch, B. Grančič, M. Mikula, A. Dujavová, Š. Chromik, P. Kúš and A. Plecenik, Phys. C, 2012, 483, 61–66 CrossRef.
- M. Radmacher, R. Tillmann and H. Gaub, Biophys. J., 1993, 64, 735 CrossRef CAS PubMed.
- I. S. Gilmore, M. P. Seah and J. E. Johnstone, Surf. Interface Anal., 2003, 35, 888–896 CrossRef CAS.
- A. C. Hellgren, Prog. Org. Coat., 1998, 34, 91–99 CrossRef CAS.
- Y. Hirayama, T. Sogawa, K. Suzuki, K. Kanisawa and H. Yamaguchi, Phys. Status Solidi B, 2007, 244, 2988–3001 CrossRef CAS.
- K. Kimura, K. Kobayashi, H. Yamada and K. Matsushige, Nanotechnology, 2008, 19, 065701 CrossRef PubMed.
- F. Zhao, Y. Huang, L. Liu, Y. Bai and L. Xu, Carbon, 2011, 49, 2624–2632 CrossRef CAS.
- A. Majumdar, Annu. Rev. Mater. Sci., 1999, 29, 505–585 CrossRef CAS.
- B. Cretin, S. Gomes, N. Trannoy and P. Vairac, Scanning thermal microscopy, in Microscale and nanoscale heat transfer, Springer, 2007, pp. 181–238 Search PubMed.
- E. Puyoo, S. Grauby, J.-M. Rampnoux, E. Rouvière and S. Dilhaire, J. Appl. Phys., 2011, 109, 024302 CrossRef.
- S. P. Grauby, E. Puyoo, J.-M. Rampnoux, E. Rouvière and S. Dilhaire, J. Phys. Chem. C, 2013, 117, 9025–9034 CAS.
- K. Yoon, G. Hwang, J. Chung, H. G. Kim, O. Kwon, K. D. Kihm and J. S. Lee, Carbon, 2014, 76, 77–83 CrossRef CAS.
- J. Chung, K. Kim, G. Hwang, O. Kwon, S. Jung, J. Lee, J. W. Lee and G. T. Kim, Rev. Sci. Instrum., 2010, 81, 114901 CrossRef PubMed.
- A. Kaźmierczak-Bałata, J. Bodzenta, M. Krzywiecki, J. Juszczyk, J. Szmidt and P. Firek, Thin Solid Films, 2013, 545, 217–221 CrossRef.
- S. Kar-Narayan, S. Crossley, X. Moya, V. Kovacova, J. Abergel, A. Bontempi, N. Baier, E. Defay and N. D. Mathur, Appl. Phys. Lett., 2013, 102, 032903 CrossRef.
- M. Sadhukhan, T. Bhowmik, M. K. Kundu and S. Barman, RSC Adv., 2014, 4, 4998–5005 RSC.
- S. H. Kim, W. Song, M. W. Jung, M. A. Kang, K. Kim, S. J. Chang, S. S. Lee, J. Lim, J. Hwang and S. Myung, Adv. Mater., 2014, 26, 4247–4252 CrossRef CAS PubMed.
- J. Zhong and D. He, Chem.–Eur. J., 2012, 18, 4148–4155 CrossRef CAS PubMed.
- J. R. Harris and S. De Carlo, Negative Staining and Cryo-negative Staining: Applications in Biology and Medicine, in Electron Microscopy, Springer, 2014, pp. 215–258 Search PubMed.
- C. Lambare, P. Y. Tessier, F. Poncin-Epaillard and D. Debarnot, RSC Adv., 2015, 5, 62348–62357 RSC.
- Y. Shan and H. Wang, Chem. Soc. Rev., 2015, 44, 3617–3638 RSC.
- N. Matsko and V. Mittal, Soft Matter, 2014, 10, 5478–5488 RSC.
- T. Ando, T. Uchihashi, N. Kodera, D. Yamamoto, A. Miyagi, M. Taniguchi and H. Yamashita, Pfluegers Arch., 2008, 456, 211–225 CrossRef CAS PubMed.
- P. K. Hansma, G. Schitter, G. E. Fantner and C. Prater, Science, 2006, 314, 601–602 CrossRef CAS PubMed.
- D. M. Carberry, L. Picco, P. G. Dunton and M. J. Miles, Nanotechnology, 2009, 20, 434018 CrossRef CAS PubMed.
- B. Zhao, J. P. Howard-Knight, A. D. L. Humphris, L. Kailas, E. C. Ratcliffe, S. J. Foster and J. K. Hobbs, Rev. Sci. Instrum., 2009, 80, 093707 CrossRef CAS PubMed.
- G. E. Fantner, R. J. Barbero, D. S. Gray and A. M. Belcher, Nat. Nanotechnol., 2010, 5, 280–285 CrossRef CAS PubMed.
- K. El Kirat, S. Morandat and Y. F. Dufrene, Biochim. Biophys. Acta, Biomembr., 2010, 1798, 750–765 CrossRef CAS PubMed.
- I. Mey, M. Stephan, E. K. Schmitt, M. M. Muller, M. Ben Amar, C. Steinem and A. Janshoff, J. Am. Chem. Soc., 2009, 131, 7031–7039 CrossRef CAS PubMed.
- C. Hennesthal, J. Drexler and C. Steinem, ChemPhysChem, 2002, 3, 885–889 CrossRef CAS PubMed.
- C. Hennesthal and C. Steinem, J. Am. Chem. Soc., 2000, 122, 8085–8086 CrossRef CAS.
- J. Zhong, C. Yang, W. Zheng, L. Huang, Y. Hong, L. Wang and Y. Sha, Colloids Surf., B, 2010, 77, 40–46 CrossRef CAS PubMed.
- D. J. Müller and A. Engel, Biophys. J., 1997, 73, 1633–1644 CrossRef.
| This journal is © The Royal Society of Chemistry 2016 |
