Indium recovery from waste liquid crystal displays by polyvinyl chloride waste

Jie Guana, Shuai Wanga, Haohua Renb, Yaoguang Guo*a, Hao Yuana, Xingru Yanc, Jiang Guoc, Weixing Gud, Ruijing Sua, Bo Lianga, Guilan Gaoa, Yuan Zhoua, Jinqiu Xua and Zhanhu Guo*c
aShanghai Cooperative Centre for WEEE Recycling, School of Environmental and Materials Engineering, Shanghai Second Polytechnic University, Shanghai, 201209, China. E-mail: ygguo@sspu.edu.cn; Tel: +86 21 50216496
bSchool of Chemical and Environmental Engineering, China University of Mining & Technology, Beijing 100083, China
cIntegrated Composites Laboratory (ICL), Department of Chemical & Biomolecular Engineering, University of Tennessee, Knoxville, TN 37996, USA. E-mail: zguo10@utk.edu; Tel: +1 865 974 7076
dShanghai Julang Protecting Environment Co., Ltd, Shanghai, 201711, China

Received 20th October 2015 , Accepted 13th November 2015

First published on 17th November 2015


Abstract

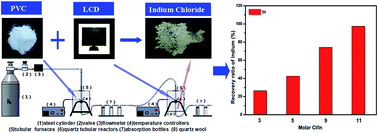
Indium (In), a rare element existing only in a few natural minerals, is mainly used to produce indium tin oxide (ITO) thin films for applications including liquid crystal displays (LCDs). Therefore, developing an effective method to recover In from waste LCDs is of great significance. In the present study, In was extracted from indium oxide (In2O3) and LCD powder after alkali dissolution via a chloride volatilization process using polyvinyl chloride (PVC) as the chlorination precursor. High purity In2O3 was investigated firstly in a nitrogen atmosphere. The results indicated that high purity In2O3 could have a high recovery ratio of indium using polyvinyl chloride (PVC) as the chlorination agent. The recovery ratio of indium could reach 99.36%. The product was analyzed by X-ray diffraction (XRD), and the results indicated that the condensed products were InCl3 and InCl. Real LCD powder after alkali dissolution was also examined. The recovery ratio of indium was 97.50% and the utilization of hydrogen chloride was 53.91% under the conditions of a molar Cl/In ratio of 11, a degradation temperature of PVC of 400 °C, a chlorination temperature of 500 °C, carrier gas flow rate at 0.1 L min−1, and a reaction time of 30 min. The condensed products were also mainly InCl3 and InCl. It is an effective method to recover In from LCD panels.


Introduction

Increasing the scale and level of waste recycling has become a strategy for the promotion of green development and environmental protection around the world. Safe disposal of electronic waste (E-waste) is not only an important issue in the field of resources, but also a worldwide environmental problem. E-waste comprises discarded electronic appliances, of which computers and mobile phones are impertinently abundant because of their short lifespan. The current global production of E-waste is estimated to be 20–25 million tons per year. Most E-waste is currently produced in Europe, the United States and Australia. However, China, Eastern Europe and Latin America will become major E-waste producers in the next ten years.1

Liquid crystal display (LCD) technology has already been used in place of Cathode Ray Tube (CRT) technology and is gradually becoming the mainstream display technology owing to its merits of micron radiation, low power consumption, and multi-information display. LCDs are widely used in electronic devices including computers, televisions, mobile phones and a variety of other electronics.2 Every year, millions of new devices are sold. For example, more than 370 million devices were sold between 1992 and 2007.3 Indium (In) is used for the thin films of LCD panels due to its merits of being transparent to visible light and electrically conductive. Indium tin oxide (ITO) thin films are the principal usage of In, accounting for about 65% of its industrial consumption. Due to rising demands and its rarity, existing only in a few natural minerals, In is obtained mainly from zinc minerals in which the content of In is from 10 to 20 ppm. Therefore, this extraction from zinc minerals is very difficult and expensive. Shortages of In and rising prices are expected in the future.4,5 Therefore, the main approach to meet market demand is the cyclic regeneration of In. The important step of the cyclic regeneration of In is to recover it from waste LCD panels. The reported methods to recover In from waste LCD panels can be classified as acid leaching, chelating resin separation or chloride metallurgy.6,7 As an effective separation method, acid leaching is widely used in In recovery. However, large quantities of corrosive and volatile acid are used in the acid dissolution process, and the treatment of waste acid and further separation of In and tin could increase the cost of recovery process.8 The chelating resin separation method is to use a variety of phosphonic acid chelating resin complexing reactions with metal ions forming small molecule chelates. Because of its good stability and adsorption capacity, the chelating resin has recently been widely applied to study precious metal recovery.9 The adsorption resin separation method has advantages of high speed, high capacity and that the resin can be well desorbed at low temperatures. The resin can be recycled by a simple process and with no pollution, but the chelating resin separation method has disadvantages of complex and long period operation, and poor selectivity.10 Chloride metallurgy is the most promising method reported for the recovery of In from LCD panels.11 Chlorinated In can be evaporated at a relative low temperature and condensed in a cooler zone. Moreover, the selective recovery of indium chloride is possible. This process does not produce waste acid and is suitable for industrial large-scale production. Using NH4Cl to recover In from LCD panels, the recovery ratio of In reached 98.02% in a rough vacuum condition.12 The function of NH4Cl is to provide HCl as chlorinating agent through the pyrogenic decomposition of NH4Cl. However, the required vacuum condition is hard to control, and also the NH4Cl can decompose to NH3 and HCl, which might cause secondary pollution.

Polyvinyl chloride (PVC), one of the biggest plastic products due to its good performance and low price, can be used to provide HCl,13 a chlorinating agent. The global consumption of PVC was about 39.3 million tons in 2013; a new market study by Germany’s Ceresana has predicted the global demand of PVC to increase by 3.2% per annum until 2021.14 There will be a lot of waste PVC products every year. The material balance after pyrolysis combined with the GC-MS analysis of the liquid fraction shows that HCl was the major product (53% of the polymer), followed by tar (24%), char (9.5%), a liquid fraction (7%) and a gas fraction (6.5%) when PVC was thermally degraded in a vacuum up to 500 °C.13 The usage of PVC to recover In from LCD powder gave a recovery ratio of 66.7% in N2 atmosphere.15 The factors affecting the indium recovery ratio, such as the degradation temperature of PVC and the actual utilization of hydrogen chloride were not reported. However, the recovery ratio of In is not high in the previous study.15

The total content of silica and alumina oxide in LCD powder is as high as 81.24% as tested by X-ray fluorescence (XRF), which might influence the recovery ratio of In.16–18 Therefore, removing SiO2 and Al2O3 can improve the relative content of In2O3 in the LCD powder. Among the commonly used desilication methods including physical, chemical and biological methods, the removal rate of the chemical methods are high and stable, and have more obvious advantages than other methods.19,20 The common chemical methods are a roasting-sodium hydroxide stripping method and a sodium hydroxide solution method. The roasting-sodium hydroxide stripping method has better separation efficiency, but the energy consumption is high. By comparison, the sodium hydroxide solution method consumed less energy by direct dissolution.21,22 Therefore, the LCD glass powder used in this experiment has already alkali dissolved silicon and aluminum due to the use of sodium hydroxide at low temperatures.

In this work, hydrogen chloride produced by PVC pyrolysis to serve as a chlorination agent to extract In from LCD powder was studied. Pure In2O3 powder was used to study the influences of the molar Cl/In ratio, reaction time, chlorination temperature, carrier gas flow rate and degradation temperature of PVC on the In recovery rate and the utilization rate of hydrogen chloride. A kind of chemical analysis software called HSC chemistry 5.0 was used to reveal the reaction mechanism between the PVC pyrolysis product and In2O3 or SnO2. LCD powder was treated with sodium hydroxide solution to remove silicon and aluminum. Then the LCD powder was used to study the influence of molar Cl/In on the recovery rate of In and the utilization rate of hydrogen chloride. An XRD test was carried out to identify the recycled product. This was an effective method to recover In from LCD panels and suitable for industrial large-scale production.

Experimental

Materials

Indium(III) oxide (In2O3, AR, Sinopharm Chemical Reagent Co. Ltd, Shanghai, China) and polyvinyl chloride (PVC, AR, ALDRICH Co. Ltd, U.S.) were used for exploring the feasibility of chlorinated separation. The PVC powder was analyzed by an elemental analyzer and the results were as follows: chloride was 55.74%, carbon was 38.84%, hydrogen was 4.661%, sulfur was 0.514%, nitrogen was 0.09%, and oxygen and others was 0.155%. Sodium hydroxide (NaOH, AR), hydrochloric acid (HCl, AR) and nitric acid (HNO3, AR) were obtained from Sinopharm Chemical Reagent Co. Ltd, Shanghai, China. Sodium hydroxide was used for researching the utilization of hydrogen chloride and removing silicon and aluminum in wasted LCD. Hydrochloric acid and nitric acid were used for dissolving the product of the chlorination reaction. The waste liquid crystal display (LCD) powder was from Shanghai Xin Jin Qiao Environmental Services Co. Ltd. The LCD powder used in the experiment was treated with sodium hydroxide solution to remove silicon and aluminum in the conditions of a liquid–solid ratio at 90[thin space (1/6-em)]:[thin space (1/6-em)]2 (mL g−1), temperature at 95 °C, a dissolution time of 2 hours and alkalinity of 0.56 g L−1. The content of the waste LCD powder before and after alkali dissolution used in this experiment is shown in Table 1.
Table 1 The content of the waste LCD powder before and after alkali dissolution
Metal oxide SiO2 Al2O3 BaO CaO SrO As2O3 Fe2O3 MgO
The content before alkali dissolution (%) 66.91 14.33 7.02 4.27 4.27 1.14 0.92 0.59
The content after alkali dissolution (%) 35.96 6.58 2.85 23.26 18.39 0.60 1.21 3.22

Metal oxide Na2O Cr2O3 MnO In2O3 K2O NiO CuO Others
The content before alkali dissolution (%) 0.15 0.11 0.07 0.05 0.03 0.01 0.01 0.12
The content after alkali dissolution (%) 3.94 0.09 0.08 0.25 0.01 0.02 0.01 3.53


Apparatus

Fig. 1 shows the home-made two-stage pyrolysis experiment device used in this study. The device consisted of two electric tubular furnaces, two quartz tubular reactors, a gas supply system, five absorption bottles and two temperature controllers. The quartz tubular reactors were customized at the Donghai County Alfa Quartz product Co. Ltd. The heating zone temperature can be adjusted from room temperature to 1200 °C.
image file: c5ra21871c-f1.tif
Fig. 1 Two-stage pyrolysis experiment device: (1) steel cylinder, (2) valve, (3) flow meter, (4) temperature controllers, (5) tubular furnace, (6) quartz tubular reactors, (7) absorption bottles, and (8) quartz wool.

Experimental procedure

In a typical run, a certain amount of PVC was placed in the first quartz reactor and a certain amount of In2O3 or LCD powder was placed in the second quartz reactor. 80 mL sodium hydroxide solution with a concentration of 1 mol L−1 was injected into the last two absorption bottles. The effect of the sodium hydroxide was to absorb the hydrogen chloride. The complete unit was connected with a polytetrafluoroethylene tube. Nitrogen gas was passed through the whole unit at a certain flow rate for five minutes to make sure the whole experiment device filled with nitrogen, then the second tubular furnace was heated up to the specified temperature and held for five minutes to ensure a constant temperature. The first tubular furnace began to heat up to a certain temperature.

After the reaction, the products which were in the lower part of the quartz reactor were dissolved into the mixed hydrochloric and nitric acid. Then the same amount of PVC was pyrolyzed under the same conditions and the collected hydrogen chloride was neutralized with sodium hydroxide solution to determine the amount of hydrogen chloride generated, in order to determine the utilization of hydrogen chloride. The recovery ratios of indium in different samples were calculated by the following eqn (1):

 
image file: c5ra21871c-t1.tif(1)
where M0 is the initial amount of indium and M is the generated amount of indium.

The utilization ratios of hydrogen chloride in different samples were calculated by eqn (2):

 
image file: c5ra21871c-t2.tif(2)
where A is the amount of hydrogen chloride and B is the amount of hydrogen chloride absorbed by the sodium hydroxide solution.

Analysis

The quantitative analysis of indium and tin in the ITO powder before and after processing was measured by inductively coupled plasma emission spectrometry (ICP-AES, A-6300, THERMO, U.S.) after being completely dissolved in a 1[thin space (1/6-em)]:[thin space (1/6-em)]1 mixture (v/v) of 37% HCl and 67% HNO3. The condensed products of the second quartz reactor were characterized and analyzed by ICP-AES and X-ray diffraction (XRD, D8 ADVANCE, BRUKER-AXS Corporation, Germany) using the Kα line of Cu at a scan speed of 8° (2θ) min−1. The measurement of HCl was achieved by measuring the amount of chloride ions in the sodium hydroxide solution and the quantitative analysis of chloride ions was measured by ion chromatography (IC, ICS2000, DIONEX, U.S.).

Results and discussion

Indium recovery from In2O3 powder

Influence of molar Cl/In. The hydrogen chloride produced from the pyrolysis of PVC will react with In2O3 which is in the LCD glass powder, to realize the extraction of indium. Thus, the molar Cl/In was used as the measurement of the PVC dosage. The effect of the molar Cl/In on the recovery ratio of In was investigated in the range of 3 to 13 at the degradation temperature of PVC, 400 °C, a chlorination temperature of 500 °C, and the carrier gas flow rate at 0.1 L min−1 for 30 min. The results are shown in Fig. 2(a). The recovery ratio of indium increased from 40.68 to 99.00% when the molar Cl/In was changed from 3 to 13. When the molar Cl/In was 11, the recovery ratio of In was 98.83%. When the molar Cl/In was 13, the recovery ratio of indium was 99.00%. The utilization of hydrogen chloride increased from 41.25 to 69.68% when the molar Cl/In was changed from 3 to 9; this then decreased from 69.68 to 35.7% when the molar Cl/In was changed from 9 to 13. When the molar Cl/In was 9, the utilization of hydrogen chloride reached the maximum and the utilization was 69.68%. When the recovery ratio of indium was 99.00%, the utilization of hydrogen chloride reached a minimum of 35.7%. Because the amount of hydrogen chloride increased with increasing molar Cl/In, the recovery ratio of indium increased with increasing the molar Cl/In. Due to the amount of hydrogen chloride discharged from being relatively insufficient to a relative surplus with increasing the molar Cl/In, the utilization of hydrogen chloride changed from an increase to a decrease with increasing molar Cl/In.
image file: c5ra21871c-f2.tif
Fig. 2 Influence of (a) molar Cl/In, (b) PVC degradation temperature, (c) reaction time, (d) chlorination temperature and (e) gas flow rate on indium recovery and the utilization rate of hydrogen chloride.
Influence of the degradation temperature of PVC. The effect of degradation temperature of PVC was investigated from 300 to 500 °C. These experiments were carried out with a molar Cl/In ratio of 11, carrier gas flow rate of 0.1 L min−1, chlorination temperature at 500 °C, and a reaction time of 30 min. The relationship between the indium recovery ratio and degradation temperature of PVC as well as the utilization rate of hydrogen chloride is shown in Fig. 2(b). The degradation temperature of PVC is observed to have no significant influence on the recovery ratio of indium. The recovery ratio of indium increased from 90.64 to 98.83% when the degradation temperature of PVC was changed from 300 to 400 °C. The recovery ratio of indium was stable at a high level when the degradation temperature of PVC was changed from 400 to 500 °C. That is to say 400 °C was suitable for the degradation of PVC only considering the recovery ratio of indium. The utilization of hydrogen chloride increased from 41.31 to 56.15% when the degradation temperature of PVC was changed from 300 to 500 °C. The utilization of hydrogen chloride mostly increased with the increasing recovery ratio of indium.
Influence of chlorination reaction time. The effect of reaction time was investigated from 10 to 60 min. These experiments were carried out with the degradation temperature of PVC at 400 °C, a molar Cl/In ratio of 11, carrier gas flow rate at 0.1 L min−1, and chlorination temperature at 500 °C. The relationship between the indium recovery ratio and reaction time as well as the utilization rate of hydrogen chloride is shown in Fig. 2(c). The recovery ratio of indium increased from 53.42 to 98.83% when the reaction time was changed from 15 to 30 minutes. The recovery ratio of indium was stable at a high level when the reaction time was changed from 30 to 75 minutes. When the reaction time was 30 minutes, the recovery ratio of indium reached the maximum and was 98.83%. It was known that 30 minutes were enough for this reaction. The utilization of hydrogen chloride decreased from 72.80 to 20% when the reaction time was increased from 15 to 45 minutes then the utilization of hydrogen chloride remained mostly constant when the reaction time was changed from 45 to 75 minutes. Though the recovery ratio of indium increased as the reaction time was changed from 15 to 30 minutes, the utilization of hydrogen chloride decreased. This was because this increased amount of hydrogen chloride was more than the amount needed for the reaction. The graph of utilization of hydrogen chloride changed from decreasing to constant when the reaction time was changed from 30 to 75 minutes. The reason for this was that the amount of hydrogen chloride discharge changed from increasing to relatively stable.
Influence of chlorination temperature. Chlorination temperature testing was performed from 350 to 550 °C, maintaining a degradation temperature of PVC at 400 °C, a molar Cl/In ratio of 11, reaction time of 30 min and carrier gas flow rate of 0.1 L min−1. The relationship between the indium recovery ratio and chlorination temperature as well as the utilization rate of hydrogen chloride is shown in Fig. 2(d). The recovery ratio of indium changed from 97.61 to 99.36% when the chlorination temperature was changed from 350 to 450 °C. The recovery ratio of indium was stable at a high level when the chlorination temperature was changed from 450 to 550 °C. This was because the generated product of indium was not completely evaporated from the reactor when the chlorination temperature was under 500 °C. The utilization of hydrogen chloride was stable at around 50% when the chlorination temperature was changed from 350 to 550 °C. The chlorination temperature was found to have no significant impact on the recovery ratio of indium or the utilization of hydrogen chloride when the chlorination temperature was changed from 350 to 550 °C.
Influence of gas flow rate. This series of experiments was to observe the effects of the nitrogen gas flow rate. The effect of gas flow rate was investigated from 0.04 to 0.16 L min−1, maintaining a degradation temperature of PVC at 400 °C, a molar Cl/In ratio of 11, chlorination temperature at 500 °C, and a reaction time of 30 min. The relationship between the indium recovery ratio and nitrogen gas flow rate as well as the utilization rate of hydrogen chloride is shown in Fig. 2(e). It shows that the recovery ratio of indium was increased with an increase of gas flow rate below 0.1 L min−1. The recovery ratio reached 98.83% when the gas flow rate was 0.1 L min−1, and then the recovery ratio began to slightly decline until it finally became constant. A gas flow rate of 0.1 L min−1 was found to be suitable for this experiment. The utilization of hydrogen chloride decreased from 82.71 to 34.82% when the gas flow rate was changed from 0.04 to 0.16 L min−1. This is attributed to the fact that with the carrier gas flow rate increasing, the production rate of hydrogen chloride becomes higher, and the recovery rate of indium doesn’t obviously change. Therefore, the utilization rate of hydrogen chloride decreases as the gas flow rate increases.
Product analysis. The condensed products of the second quartz reactor were characterized by X-ray diffraction (XRD). The patterns of the products obtained after the chlorination of In2O3 at different chlorination temperatures are shown in Fig. 3. The condensed products were observed to be InCl3 and InCl. The patterns of In2O3 before and after the reaction at 500 °C are shown in Fig. 4. The patterns of In2O3 before and after the reaction at 500 °C are almost the same. Thus, the produced InCl3 and InCl were completely evaporated at the chlorination temperature of 500 °C.
image file: c5ra21871c-f3.tif
Fig. 3 XRD patterns of the products obtained after the chlorination of In2O3 at the chlorination temperature of (a) 400, (b) 450, (c) 500, and (d) 550 °C.

image file: c5ra21871c-f4.tif
Fig. 4 XRD patterns of In2O3 before and after the reaction at 500 °C.
Principle analysis. PVC decomposes at a certain temperature and discharges HCl as the chlorination agent, and hydrocarbons are also produced during the reaction. The possible reactions between HCl, hydrocarbons, In2O3 and SnO2, and the corresponding Gibbs energies (calculated by HSC Chemistry 5.0) are listed below. The Gibbs energies changed with changing the temperature, Fig. 5.
 
In2O3 + 6HCl(g) = 2InCl3 + 3H2O(g); ΔG° (500 °C) = −26.983 kJ mol−1 (3)
 
In2O3 + 6HCl(g) = 2InCl2 + 3H2O(g) + Cl2(g); ΔG° (500 °C) = 168.907 kJ mol−1 (4)
 
In2O3 + 6HCl(g) = 2InCl + 3H2O(g) + 2Cl2(g); ΔG° (500 °C) = 360.874 kJ mol−1 (5)
 
InCl3 = InCl + Cl2(g); ΔG° (500 °C) = 193.928 kJ mol−1 (6)
 
In2O3 + 6HCl(g) = In2Cl6(g) + 3H2O(g); ΔG° (500 °C) = −29.074 kJ mol−1 (7)
 
SnO2 + 4HCl(g) = SnCl4(g) + 2H2O(g); ΔG° (500 °C) = 27.748 kJ mol−1 (8)
 
SnO2 + 4HCl(g) = SnCl2 + 2H2O(g) + Cl2(g); ΔG° (500 °C) = 168.070 kJ mol−1 (9)
 
3In2O3 + 6HCl(g) + C2H4(g) = 6InCl + 2CO2(g) + 5H2O(g); ΔG° (500 °C) = −180.868 kJ mol−1 (10)
 
2In2O3 + 4HCl(g) + C2H4(g) = 4InCl + 2CO(g) + 4H2O(g); ΔG° (500 °C) = −123.749 kJ mol−1 (11)

image file: c5ra21871c-f5.tif
Fig. 5 Gibbs energies vs. the temperature for reaction (a) (3), (b) (4), (c) (5), (d) (6), (e) (7), (f) (8), (g) (9), (h) (10), and (i) (11).

As can be seen from the above equations, InCl3, In2Cl6 and InCl can be generated at 500 °C. SnCl4 may be generated, because it has a critical value (between −40 and 40 kJ mol−1),6 indicating that the direction of the reaction is uncertain. It can be known from Fig. 5 that the reaction of (4), (5), (6), (9) will not occur at the temperature range from 350 to 550 °C. That is to say InCl2 and SnCl2 cannot be generated at the temperature range from 350 to 550 °C. The reaction of (3), (7), (10), (11) will occur at the temperature range from 350 to 550 °C and the reaction of (10), (11) will occur more easily with increasing the temperature. That is to say InCl3, In2Cl6 and InCl can be generated at the temperature range from 350 to 550 °C. We can know that the result of the principle analysis is consistent with the experimental results.

Indium recovery from waste LCD powder

The experiments with pure substances have proved that the separation and recovery of pure indium chloride from In2O3 is feasible via an In2O3 reaction with HCl produced from the degradation of PVC. The experiment conditions of real waste LCD glass powder after alkali dissolution could be a little different to the conditions of pure In2O3. Therefore, a set of experiments was designed to investigate whether there are any differences between the separation of pure In2O3 and waste LCD glass powder after alkali dissolution. The molar Cl/In is observed to have a significant influence on the recovery ratio of In. Thus, the influence of the molar Cl/In was studied under the conditions of the degradation temperature of PVC at 400 °C, chlorination temperature at 500 °C, carrier gas flow rate at 0.1 L min−1, and a reaction time of 30 min.

The effect of molar Cl/In on the recovery ratio of indium was investigated in the range of 3 to 11. 100 g glass powder after alkali dissolution was used for each test. The relationship between the indium recovery ratio and the molar Cl/In as well as the utilization rate of hydrogen chloride is shown in Fig. 6. The recovery ratio of tin was very low, so it is not shown in the graph. The recovery ratio of tin increased from 0.19 to 0.48% when the molar Cl/In was changed from 3 to 11. As shown in Fig. 6, the recovery ratio of indium increased from 26.57 to 97.50% when the molar Cl/In was changed from 3 to 11. The utilization of hydrogen chloride decreased from 57.69 to 50.46% when the molar Cl/In ratio was changed from 3 to 9, then increased from 50.46 to 53.91% when the molar Cl/In ratio was changed from 9 to 11. The variation trend of the recovery ratio of indium was the same as that observed for the pure In2O3 conditions. While the recovery ratio of indium was slightly lower than the conditions of pure In2O3. The XRD pattern of the product obtained from the chlorination of the LCD glass powder at 500 °C is shown in Fig. 7. It could be seen from the patterns that the condensed products were InCl3 and InCl. The LCD glass powder after alkali dissolution gave the same results as observed for the pure In2O3.


image file: c5ra21871c-f6.tif
Fig. 6 Influence of molar Cl/In on indium recovery and utilization rate of hydrogen chloride.

image file: c5ra21871c-f7.tif
Fig. 7 XRD pattern of the product obtained from the chlorination of the LCD glass powder at the temperature of 500 °C.

In the present study, the recovery ratio of indium could reach 97.50%, better than the reported 66.7%, using PVC to recover indium from LCD powder untreated with sodium hydroxide solution to remove the silicon and aluminum.15

Conclusions

The recovery of indium from alkali treated LCD powder via a chloride volatilization process using polyvinyl chloride has been successfully demonstrated. It can be directly used to extract indium from LCDs. The recovery ratio of indium can reach 97.50%. The recovered products have high purity and their main constituents are InCl and InCl3. PVC is a major engineering plastic, and a large amount of waste PVC is discarded every year. This study presents a promising technology for cyclic regeneration of precious metal indium from waste LCD panels and the re-usage of PVC. This method can achieve the goal of using waste to treat waste.

Acknowledgements

We gratefully acknowledge the financial support from Shanghai Natural Science Foundation (No. 15ZR1416800), Shanghai Sailing Program (15YF1404300), Shanghai University Youth Teacher Funding Program (ZZZZEGD15011), and Scientific Research Fund Project of Shanghai Second Polytechnic University (EGD15XQD02), Cultivate discipline fund of Shanghai Second Polytechnic University (XXKPY1303) and Leading Academic Discipline and Innovation Program Project of Shanghai Municipal Education Commission Project (J51803) and (12YZ180). Dr Z. Guo appreciates the Eastern Scholar Program of Shanghai. The authors also acknowledge the Graduate Student Funding Program of Shanghai Second Polytechnic University (A30NH1513012) and Project supported by Shanghai Cooperative Centre for WEEE Recycling.

References

  1. B. H. Robinson, E-waste: an assessment of global production and environmental impacts, Sci. Total Environ., 2009, 408, 183–191 CrossRef CAS PubMed .
  2. H. B. Zhu, Y. L. Wang and G. F. Liu, Study on Method of Recycling Liquid Crystal from Waste LCD Based on Supercritical CO2 Fluid Technology, Adv. Mater. Res., 2012, 480, 2165–2170 CrossRef .
  3. C. H. Lee, M. K. Jeong and M. F. Kilicaslan, Recovery of indium from used LCD panel by a time efficient and environmentally sound method assisted HEBM, Waste Manag., 2013, 33, 730–734 CrossRef CAS PubMed .
  4. K. Inoue and S. Alam, Hydrometallurgical Recovery of Indium from Flat-Panel Displays of Spent Liquid Crystal Televisions, JOM, 2015, 67, 400–405 CrossRef CAS .
  5. D. Choi, S. J. Hong and Y. K. Son, Characteristics of Indium Tin Oxide (ITO) Nanoparticles Recovered by Lift-off Method from TFT-LCD Panel Scraps, Materials, 2014, 7, 7662–7669 CrossRef .
  6. J. H. Li, S. Gao, H. B. Duan and L. L. Liu, Recovery of valuable materials from waste liquid crystal display panel, Waste Manag., 2009, 29, 2033–2039 CrossRef CAS PubMed .
  7. X. Y. Wang, X. B. Lu and S. T. Zhang, Study on the waste liquid crystal display treatment: focus on the resource recovery, J. Hazard. Mater., 2013, 244, 342–347 CrossRef PubMed .
  8. R. D. Li, T. C. Yuan, W. B. Fan, Z. L. Qiu, W. J. Su and N. Q. Zhong, Recovery of indium by acid leaching waste ITO target based on neural network, Trans. Nonferrous Met. Soc. China, 2014, 24, 257–262 CrossRef CAS .
  9. M. Matsuda and M. Aoi, Recovery of indium in the sulfuric acid leaching solution of zinc leach residue with chelate resin, Nippon Kagaku Kaishi, 1990, 9, 976–981 CrossRef .
  10. M. Matsuda, M. Aoi and Y. Akiyoshi, Recovery of indium in the sulfuric acid leaching solution of zinc slag with chelate resin, Nippon Kagaku Kaishi, 1989, 12, 2012–2017 CrossRef .
  11. K. Takahashi, A. Sasaki, G. Dodbiba, J. Sadaki, N. Sato and T. Fujita, Recovering indium from the liquid crystal display of discarded cellular phones by means of chloride-induced vaporization at relatively low temperature, Metall. Mater. Trans. A, 2009, 40, 891–900 CrossRef .
  12. E. Ma, R. X. Lu and Z. M. Xu, An efficient rough vacuum-chlorinated separation method for the recovery of indium from waste liquid crystal display panels, Green Chem., 2012, 14, 3395–3401 RSC .
  13. C. Ian, M. Neill, L. Memetea and J. C. William, A study of the products of PVC thermal degradation, Polym. Degrad. Stab., 1995, 49, 181–191 CrossRef .
  14. Steady growth forecast for global PVC market till 2021, Pop. Plast. Packag., 2014, 59, 71–72 Search PubMed.
  15. P. Kye-Sung, S. Wakao, G. Guido, K. Tomohito and Y. Toshiaki, Recovery of indium from In2O3 and liquid crystal display powder via a chloride volatilization process using polyvinyl chloride, Thermochim. Acta, 2009, 493, 105–108 CrossRef .
  16. R. H. Matjie, J. R. Bunt and J. H. P. van Heerden, Extraction of alumina from coal fly ash generated from a selected low rank bituminous South African coal, Miner. Eng., 2005, 18, 299–310 CrossRef CAS .
  17. N. Murayama, H. Yamamoto and J. Shibata, Mechanism of zeolite synthesis from coal fly ash by alkali hydrothermal reaction, Int. J. Miner. Process., 2002, 64, 1–17 CrossRef CAS .
  18. K. Ki-Dong, H. Wang and J. Hee, Recycling of TFT-LCD cullet as a raw material for fibre glasses, Glass Technol.: Eur. J. Glass Sci. Technol., Part A, 2011, 52, 181–184 Search PubMed .
  19. F. Peng, K. M. Liang, A. M. Hu and H. Shao, Nano-crystal glass-ceramics obtained by crystallization of vitrified coal fly ash, Fuel, 2004, 83, 1973–1977 CrossRef CAS .
  20. F. Peng, K. M. Liang and A. M. Hu, Nano-crystal glass-ceramics obtained from high alumina coal fly ash, Fuel, 2005, 84, 341–346 CrossRef CAS .
  21. I. Miki, E. Yukari, E. Naoya and H. Junichi, Synthesis of zeolite from coal fly ashes with different silica–alumina composition, Fuel, 2005, 84, 299–304 CrossRef .
  22. K. Dana, S. Sinhamahapatra, H. S. Tripathi and A. Ghosh, Refractories of Alumina–Silica System, Trans. Indian Ceram. Soc., 2014, 73, 1–13 CrossRef CAS .

This journal is © The Royal Society of Chemistry 2015
Click here to see how this site uses Cookies. View our privacy policy here.