DOI:
10.1039/C5RA21844F
(Paper)
RSC Adv., 2015,
5, 100235-100243
An on-line spectroscopic monitoring system for the electrolytes in vanadium redox flow batteries
Received
19th October 2015
, Accepted 12th November 2015
First published on 16th November 2015
Abstract
In this work, an on-line electrolyte spectroscopic monitoring system (OESM) is developed for long term monitoring of the electrolytes in a charge–discharge cycling VRB. We demonstrated experimentally that the transmittance spectra of the positive/negative electrolyte in a cycling VRB can be on-line monitored. With appropriate calibration, parameters such as the state of charge (SOC) of the electrolytes can be calculated. The system offers a tool for further research on the complex relationships between the spectra and the composition of the electrolyte in a VRB, and provides a dynamic method to study the kinetics of the electrolyte imbalance in VRBs.
1. Introduction
With the demands of large-scale energy storage techniques for renewable energy sources, redox flow batteries (RFBs) have drawn more and more attention.1–3 Among all types of RFBs, the vanadium redox flow battery (VRFB or VRB) developed by Skyllas-Kazacos et al.4,5 has been the most thoroughly investigated, due to its long cycle life, environmental friendliness and low cost.6–8
The VRB comprises V(V)/V(IV) and V(III)/V(II) redox couples in sulphuric acid as positive and negative electrolytes, carbon fabric materials as electrodes, and ion exchange membranes as separators.9–14 This all vanadium active substance approach has no cross-contamination, leading to an indefinite life of the vanadium electrolytes, which is the most important benefit of VRB compared with other energy storage devices. However, an imbalance between the positive and negative electrolytes will arise due to many factors including side reactions, the differential transfer of vanadium ions and water across the membrane and so on, resulting in a loss of capacity over charge–discharge cycles and a compromise of electrolyte lifetime and energy efficiency.15 Traditional solution is to replace the imbalance electrolytes with balanced ones, which makes the benefit of indefinite life of the vanadium electrolytes meaningless. Therefore, online monitoring techniques are needed to detect the level of the imbalance and make auto balance of the electrolytes possible.
Traditional detection methods such as potentiometric titration17 and mass spectrometry have complex steps, and therefore are not suitable for on-line monitoring. The open-circuit voltage (OCV) method can only provide two independent variables18,19 (the OCVs of the positive and the negative electrolytes), which is difficult to describe the complicated electrolyte imbalance which has much more independent variables.
Skyllas-Kazacos et al. monitored the state of charge of the VRB by measuring conductivity and the UV-vis spectrum.15 The conductivity method has low detection resolution and the drawback of lacking variables as the OCV method; while the spectrum method show its potential: the absorbance at certain wavelengths (e.g. 750 nm) of the negative electrolyte can be used for the state of charge (SOC) monitoring. Actually, ex situ UV-vis spectroscopy has been used to monitor performance and evaluate mathematical modelling of charge–discharge cycling.16 The challenge of the spectrum method is that the absorbance of the positive electrolyte does not obey the Beer's law and is not the linear combination of the absorbance of its components, due to the interferences between V(IV) and V(V) ions at such high concentration. Our group proposed an in situ spectroscopic method to monitor the electrolytes, as a solution to this challenge.20,21 Transmission spectrum rather than absorption spectrum is used for analysing for better signal noise ratio (SNR) and the entire spectrum is utilized instead of the data at one wavelength. By comparing the transmittance spectrum of the electrolyte with the spectra in a pre-prepared database using our intensity-corrected correlation coefficient (ICCC) algorithm, parameters such as SOC and the total vanadium concentration can be determined. More groups have focused on the spectroscopic study of the VRB electrolytes. Rudolph et al.22 detect the SOC of the positive electrolytes with the IR absorption at 950 nm. Brooker et al.23 detected the concentrations of three of the four species in the VRB by UV-vis method. Tang et al.24,25 developed an excess-absorbance-based analysing method for the spectra of the positive electrolyte. By using a V2O33+ equilibrium model, Buckley et al.26–28 characterized the spectra in terms of the excess absorbance parameter and the molar extinction coefficients of V(IV) and V(V). The spectroscopic study can provide many independent variables, which is adequate for monitoring the independent variables of the imbalanced electrolytes in VRB.
In this paper, based on our previous work,19,20 an on-line electrolyte spectroscopic monitoring system is developed for long term monitoring of the electrolytes in a charge–discharge cycling VRB. This monitoring system can offer means for further researches on the relationships between the spectra and the composition of the electrolyte, and provides a dynamic method to study the kinetics of the electrolytes imbalance in VRBs.
2. Experimental
2.1 System setup
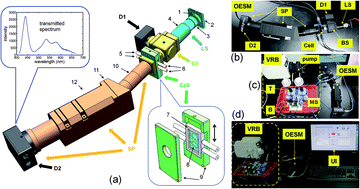
The schematic of our on-line electrolyte spectroscopic monitoring (OESM) system is shown in Fig. 1(a).
 |
| Fig. 1 (a) The schematic of the on-line electrolyte spectroscopic monitoring (OESM) system. LS, light source; BS, beam splitter; cell, absorption cell; SP, grating spectrometer; D1, camera; D2, line camera; 1, LED base; 2, heatsink; 3, 25× objective; 4, tube; 5, inlets; 6, outlets; 7, cell frame; 8, quartz window; 9, cell holder; 10, incident light tube of the spectrometer; 11, grating base of the spectrometer; 12, the exit light tube of the spectrometer. (b) Photograph of the OESM system. Labels are the same with (a). (c) Photograph of the OESM and the testing VRB system. Pump, two channel peristaltic pump; T, tanks; B, one piece battery; MS, magnetic stirrer. (d) Photograph of the monitoring scene. UI, user interface of the OESM. | |
Although halogen and xenon lamps are usually used in spectroscopic studies, we choose a white LED as the light source (LS in Fig. 1(a)) to ensure the long life for continuous use. The white LED (Cree XPE-R2-WD, electrical power of 5 W) is fixed in a LED base (1 in Fig. 1(a)), which is adhered to a heatsink (2 in Fig. 1(a)). A 25× objective (3 in Fig. 1(a)) collects the light from the LED and focuses the light into a 0.5 mm pinhole fixed in a tube (4 in Fig. 1(a)), in which an achromatic lens collimates the light from the pinhole. The parallel light beam from the light source (LS in Fig. 1(a)) is split into two beams by a beam splitter (BS in Fig. 1(a), Thorlabs BS013). The reflected beam is recorded by an industrial camera (D1, Mightex SCE-BG04-U) to monitor the fluctuation of the intensity of the light source. The transmitted beam passes an absorption cell (cell in Fig. 1(a)) and goes into a grating spectrometer (SP in Fig. 1(a)). The self-developed absorption cell has two inlets (5 in Fig. 1(a)) and two outlets (6 in Fig. 1(a)) with the small image in the lower right corner of Fig. 1(a) showing its structure: two quartz windows (8 in Fig. 1(a)) are attached to both sides of a plastic cell frame (7 in Fig. 1(a)), forming two absorption channels with 0.5 mm thick; and a cell holder (9 in Fig. 1(a)) slides the cell up and down to choose one channel to be monitored. Light passing the absorption cell goes into a self-developed grating spectrometer (SP in Fig. 1(a)). The grating spectrometer consists of the incident light tube (10 in Fig. 1(a)) in which there is a 50 μm slit, the grating base (11 in Fig. 1(a)) in which there is a transmission grating (Thorlabs GT25-06V, 600 grooves per mm), and the exit light tube with tuneable length (12 in Fig. 1(a)). The dispersed beam is captured by an industrial line camera (D2 in Fig. 1(a), Mightex TCN-1304-U) as shown in the top left of Fig. 1(a). The OESM system can detect the transmittance spectrum of either the positive or the negative electrolytes 3 times per second with a spectral range of 410 to 670 nm and a spectral resolution of better than 1 nm.
2.2 Data processing and spectra exhibition
As the transmittance spectrum of the positive electrolyte changes dramatically during charge–discharge cycling, the exposure time of the line camera (D2 in Fig. 1(a)) during the monitoring procedure is controlled by the programme, to maximize the use of the dynamic range of the line camera. A typical raw spectrum data captured by the line camera is shown in Fig. 2(a). We can see that the spectrum has a strong peak near 440 nm due to the spectrum of the white LED light source. It can be also concluded from Fig. 2(a) that the spectrum has a background attributing to the noise level of the industrial line camera. This background can be removed and the resulting spectrum is shown in Fig. 2(b). Based on the detection results of D1 in Fig. 1(a), the variation of the intensity of the light source can be compensated, resulting spectrum shown in Fig. 2(c). Before monitoring the electrolyte, a spectrum is recorded with empty absorption cell. This spectrum contains the emitting spectrum of the LED and the response of the line camera, and is defined as “the spectral response” of the OESM system, shown in Fig. 2(d). As the spectrum of the electrolyte usually has different exposure time with “the spectral response” curve, we compensate this exposure difference and the resulting spectrum is shown in Fig. 2(d), too. Dividing the two curves in Fig. 2(d), we can get the transmittance spectrum of the monitored electrolyte, shown in Fig. 1(e). This spectrum is then smoothed with a moving average filter, as shown in Fig. 2(f), and used as the final spectrum data. The electrolytes of the cycling VRB system flow through the absorption cell, while the OESM system keeps recording spectra like the one in Fig. 2(f). A series of spectra are obtained and are shown in a two-dimensional exhibition in the left side of Fig. 2(g), in which three marked lines A1 to A3 represent different transmittance spectra and are plotted in the right side of Fig. 2(g). We can see from plotted spectra A1 to A3 that, the transmittance spectrum changes dramatically both in shapes and intensities. We can also conclude from the two-dimensional exhibition in Fig. 2(g) that, transmittance in a large area is too small to see clearly. Therefore, we change the transmittance spectra in logarithmic scale and the results are shown in Fig. 2(h). It can be seen from Fig. 2(h), that the changes of the spectra with time can be seen more clearly in logarithmic scale.
 |
| Fig. 2 Data processing and spectra exhibition. (a) Raw spectrum data; (b) spectrum after removing the background; (c) spectrum after compensating the variation of the intensity of the light source; (d) spectrum after compensating the difference of the exposure time and the spectral response of the system; (e) spectrum after compensating the spectral response; (f) the denoised final spectrum; (g) left is the two-dimensional exhibition of the measured spectra, right are plotted three marked spectra in the left; (h) left and right are the same with (g), except the transmittance spectra are in logarithmic scale. | |
3. Results and discussions
3.1 Calibration and performance of the OESM system
To calibrate our OESM system, electrolytes with 2 M total vanadium and 2 M H2SO4 are used as the standard electrolytes, and the positive and the negative electrolytes with different SOCs are detected by the OESM system, respectively.
Fig. 3(a) shows the transmittance spectra of 201 standard positive electrolytes with SOC from 0% to 100% in steps of 0.5%. We can see from Fig. 3(a) that the transmittance of the electrolyte with SOC 0% (pure V(IV)) is like a low-pass filter, the transmittance at shorter wavelengths drops quickly from near 1 to the order of 10−2 with the SOC rising from 0% and rises quickly back to near 1 forming a long-pass filter shape (SOC 100%). The marked data in Fig. 3(a) at four wavelengths (445.4 nm, 480.8 nm, 516.3 nm, 551.7 nm) are plotted in Fig. 3(b). This dramatically changed spectra is attributing to the interferences between V(IV) and V(V) ions in the positive electrolyte, which is the major obstruction for detecting VRB electrolyte in a spectroscopic way. As reported in our previous work,21 this obstruction is remove by comparing the unknown spectrum with the spectra in a pre-prepared database (as the spectra in Fig. 3(a)) using the intensity-corrected correlation coefficient (ICCC) algorithm, which is proposed by us to overcome the drawback of the correlation coefficient (CC) for being not sensitive to spectral intensity. The biggest ICCC shows the most similar spectrum in the database and therefore determines the parameters such as SOC of the unknown electrolyte. In this paper, the ICCC is defined as
|
 | (1) |
where min(
A,
B)/max(
A,
B) is the smaller/larger one in
A and
B,
X1 to
X4 and
Y1 to
Y4 are the transmittance of the unknown spectrum and the spectrum in the database at the wavelength of 445.4 nm, 480.8 nm, 516.3 nm, 551.7 nm. With spectra data in
Fig. 3(a) and the comparison method with ICCC, we can determine the SOCs of the electrolytes we monitored.
 |
| Fig. 3 System calibration and performance. (a) 201 transmittance spectra of the standard positive electrolytes with SOC from 0% to 100% in steps of 0.5%, detected by the OESM system; (b) the relationships between the transmittance at four wavelengths marked in (a) (445.4 nm, 480.8 nm, 516.3 nm, 551.7 nm) and the SOC of the positive electrolytes; (c) the ICCCs of the 201 standard spectra for the positive electrolytes in (a), in which the diagonal elements are self-ICCC and the nondiagonal elements are cross-ICCCs; (d) ICCCs of 100 repeated measurements for three positive electrolytes with SOC of 0%, 50% and 100%; (e) the relationships between the transmittance at 445.4 nm and the SOC of the negative electrolytes; (f) SOC resolution of the negative electrolyte at different SOCs. The sensitivity data are calculated from (e), and the noise levels of the transmittance are calculated by 100 measurements for electrolytes at each SOCs. | |
To determine the detection performance of this database and ICCC based comparing method, the ICCCs of the 201 standard spectra are calculated and shown in Fig. 3(c), where the diagonal elements are the intensity-corrected self-correlation coefficient (self-ICCCs) and the nondiagonal elements are the intensity-corrected cross-correlation coefficient (cross-ICCCs). We can see from Fig. 3(c) that the self-ICCCs are 1 and the cross-ICCCs are smaller than 1. In fact, the largest value of the nondiagonal elements is below 0.98.
The source of errors for the ICCC based comparing method is the variation of spectra of the same electrolyte sample due to the fluctuation of the industrial camera. To test the detection repeatability of our method, the spectra of the positive electrolytes with SOC of 0%, 50% and 100% are measured with the OESM system 100 times. In each measurement the spectra is compared with the database, and the biggest ICCCs of 100 repeated measurements are shown in Fig. 3(d). It can be seen from Fig. 3(d) that all the biggest ICCCs are above 0.99, which is larger than the nondiagonal elements in Fig. 3(c) (below 0.98). This indicates that our system and ICCC algorithm can distinguish all the 201 standard spectra in Fig. 3(a). Therefore, we can say that the SOC resolution of the positive electrolyte is better than 0.5%, which is the SOC step of the 201 standard spectra in Fig. 3(a).
Unlike the positive electrolyte, the ions in the negative electrolyte of VRB have no interferences, so the Beer's law is obeyed. Fig. 3(e) shows the relationships between the transmittance at 445.4 nm and the SOC of the negative electrolytes. We can concluded from Fig. 3(e) that the transmittance of the negative electrolyte increases monotonically with the SOC, showing a simple way to determine the SOCs of the monitored electrolytes.
The source of errors for the negative electrolyte is the variation of transmittance of the same electrolyte sample due to the fluctuation of the industrial camera. The SOC resolutions of the negative electrolytes at different SOCs are shown in Fig. 3(f), where the SOC resolutions are calculated with eqn (2).
in which
δSOC is the SOC resolution;
δT is the noise level of the detected transmittance, which is denoted as the standard deviation (STD) of the measured transmittance with 100 repeated measurements for each SOC; Sn is the sensitivity of the transmittance-based SOC measurement, which can be calculated from the slopes at each data point of the curve in
Fig. 3(e). It can be concluded from
Fig. 3(f) that all the SOC resolutions are better than 0.5%.
To sum up, the performance of our OESM system is as follows: the SOC resolution of both the positive and the negative electrolytes are better than 0.5%. The time consumption of the spectra comparing procedure is very small, and the response time of the OESM are better than one second. Attributing to the calibration with the standard electrolytes, both the SOC detections of the positive and negative electrolytes are very accurate, with nearly no system errors. The electrolytes detections has no interferences under the assumption that the total vanadium concentration and the concentration of the sulphuric acid are not changed during the charge–discharge cycles. In more complex situations where the total vanadium concentration and the concentration of the sulphuric acid do change, the detection algorithm should be improved to prevent interference.
3.2 Charge-discharge cycles
To demonstrate the capability of our OESM system, the electrolytes in the testing VRB system (Fig. 1(c)) during charge–discharge cycles are detected. The initial electrolytes on both sides are 50 mL electrolytes with 1 M V(III), 1 M V(IV) and 2 M H2SO4. The cycles test is performed on a battery testing system (Neware 5V3A). A precharge process with constant current density of 40 mA cm−2 turns the positive totally V(IV) and the negative electrolytes totally V(III), and the charge–discharge cycles with constant current density of 40 mA cm−2 and cut-off voltage of 0.8 V to 1.65 V are performed. As the cycles continue, the volumes of the electrolytes begin to be imbalanced. After 44 cycles, the volume of the positive electrolyte is 8 mL larger than that of the negative electrolyte. Then the positive and negative electrolytes are remixed and average divided. After the remixing, the same precharge and cycling process continues. This time the imbalance gets worse, the volume of the positive electrolyte is 18 mL larger than that of the negative electrolyte after 34 cycles. Fig. 4(a) shows the variation of charge capacity of the testing VRB with charge–discharge cycles before and after remixing the electrolytes. It can be seen from Fig. 4(a) that both the charge capacities before and after remixing rise in the first few cycles and drops gradually in the rest of the cycles, and the capacities after remixing are smaller than those before remixing. The charge–discharge curves of the testing VRB before and after remixing the electrolytes are shown in Fig. 4(b) and (c). It can be seen from Fig. 4(b) and (c) that, the first few cycles have higher discharge voltages and larger charge–discharge capacities, and the rest of the cycles have lower discharge voltages and smaller charge–discharge capacities, which is in accord with Fig. 4(a).
 |
| Fig. 4 (a) The variation of charge capacity of the testing VRB with charge–discharge cycles before and after remixing the electrolytes; (b) charge–discharge curves of different cycles before remixing the electrolytes; (c) charge–discharge curves of different cycles after remixing the electrolytes. | |
3.3 Spectroscopic monitoring of the cycling VRB
While the testing VRB performing charge–discharge cycles before remixing the electrolytes as mentioned in Section 3.2, the OESM system is used to monitor the spectra of the positive electrolytes of the VRB. With data processing process and spectra exhibition way introduced in Fig. 2, we finally obtained the transmittance spectra of the positive electrolytes during the cycles before remixing, as shown in Fig. 5(a) in logarithmic scale. The squared area in Fig. 5(a) is enlarged and shown in Fig. 5(b). We can see that Fig. 5(b) contains the precharge process and the first two cycles. Three spectra marked in Fig. 5(b) are plotted in normal scale in Fig. 5(c). It can be concluded from Fig. 5(c) that, the spectra of the positive electrolyte charges dramatically in shape and intensity, which is coincide to our calibration results in Fig. 3(a).
 |
| Fig. 5 (a) The detected transmittance spectra of the positive electrolytes during charge–discharge cycles before remixing the electrolytes; (b) the squared area of (a); (c) the plotted three marked spectra in (b); (d) the detected transmittance spectra of the negative electrolytes during charge–discharge cycles after remixing the electrolytes; (e) the squared area of (d); (f) the plotted three marked spectra in (e). | |
While the testing VRB continuing charge–discharge cycles after remixing the electrolytes as mentioned in Section 3.2, the OESM system is used to monitor the spectra of the negative electrolytes of the VRB. Similar to the positive electrolytes, we finally obtained the transmittance spectra of the negative electrolytes during the cycles after remixing, as shown in Fig. 5(d). The squared area in Fig. 5(d) is enlarged and shown in Fig. 5(e). And three spectra marked in Fig. 5(e) are plotted in normal scale in Fig. 5(f). We can conclude from Fig. 5(d)–(f) that, for the negative electrolyte, the intensity of the spectra does not charge and the peak of the spectra move slowly to the lower wavelength.
3.4 Analysis of the monitored spectra
To demonstrate the capability of our OESM system, analysis of the transmittance spectra during the cycle in Fig. 5(a) and (d) are carried out based on the calibration results shown in Section 3.1. By comparing the ICCC in eqn (1) of the monitored spectra in Fig. 5(a) and the spectra data in Fig. 3(a), the SOCs of the positive electrolytes in the charge–discharge cycles before remixing the electrolytes are obtained and shown in Fig. 6(a). We can see from Fig. 6(a) that, the discharge in each cycle can always discharge the SOCs of the positive electrolyte to near 0% (pure V(IV)), and the SOCs of the positive electrolyte at the end of each charge process drop gradually from 95% to 67% and then are stable around 67%. Fig. 6(b) shows the SOCs of the negative electrolytes in the charge–discharge cycles after remixing the electrolytes, which is calculated from the monitored spectra in Fig. 5(d) and the relationships between the transmittance at 445.4 nm and the SOC of the negative electrolytes in Fig. 3(c). It can be seen from Fig. 6(b) that, both the SOCs at the end of each charge and discharge rises gradually at first, till SOCs at the end of each charge process almost reach 100% (pure V(II)).
 |
| Fig. 6 (a) The SOCs of the positive electrolytes in the charge–discharge cycles before remixing the electrolytes; (b) the SOCs of the negative electrolytes in the charge–discharge cycles after remixing the electrolytes. | |
Both the SOC changes in Fig. 6(a) and (b) show some dynamic equilibrium processes. The parameters of the dynamic equilibrium in an actual VRB system are very complicated. The total vanadium concentration, the SOC, the concentration of the sulphuric acid, the volume of the electrolytes and so on, all of these parameters are changing dynamically at all times. Traditional detection methods that offer limited independent variables cannot meet the demand of monitoring this dynamic process in the VRB. The spectroscopic method is one of the few detection methods that can offer enough independent variables for monitoring the VRB. In the calculations of Fig. 6, we assume that the total vanadium concentration and the concentration of the sulphuric acid are not changed during the charge–discharge cycles. However, these assumptions may not be true in most of cases. The OESM system in this work offers a tool for further researches on the relationships between the spectra and the composition of the electrolyte. Analysis in Fig. 6 only demonstrates the capability of the OESM system preliminarily. With calibration work on more standard electrolytes with different total vanadium concentration, different SOC, different concentration of the sulphuric acid, the composition of the electrolytes can be on-line determined in our further researches. Then together with the volume monitoring of the electrolytes, the kinetics of the VRB imbalance can be studies.
Besides calibrations, the OESM system can be improved in further studies by improving the spectra range for UV-vis spectroscopic study, establishing two systems to monitor both the positive and the negative electrolytes, and adding a filter in the flowing system to prevent carbon particles or graphite fibres from fouling the absorption cell.
The OESM system is simple and inexpensive. By using industrial cameras instead of scientific ones, the cost of the OESM system is minimized to two or three thousand US dollars. Compared with existing detection methods such as atomic absorption spectroscopy, redox titration and ex situ optical spectroscopy, our OESM system can provide in situ and economic tool for studying the operating VRBs with high vanadium concentrations, as well as enough parameters to monitor the complex reactions in the VRBs.
4. Conclusions
We present an on-line electrolyte spectroscopic monitoring system (OESM) for long term monitoring of the electrolytes in the vanadium redox flow battery (VRB) system during charge–discharge cycling. We demonstrated experimentally that the transmittance spectra of the positive/negative electrolyte in a cycling VRB can be on-line monitored. With appropriate calibration, parameters such as the state of charge (SOC) of the electrolytes can be calculated from the monitored spectra. The OESM system offers a tool for further research on the complex relationships between the spectra and the composition of the electrolyte in a VRB, and provides a dynamic method to study the kinetics of the electrolyte imbalance in VRBs.
Acknowledgements
This research was made possible with the financial support from National Natural Science Foundation of China (61308119), Natural Science Foundation of Guangdong province (2015A030313), science and technology research program of Shenzhen (JCYJ20140509172959960, JCYJ20150331151358142).
Notes and references
- J. Noack, N. Boznyatovskaya, T. Herr and P. Fisher, Angew. Chem., Int. Ed., 2015, 54, 2 CrossRef PubMed.
- B. Dunn, H. Kamath and J. M. Tarascon, Science, 2011, 334, 928 CrossRef CAS PubMed.
- P. Leung, X. Li, C. P. de Leon, L. Berlouis, C. T. John Low and F. C. Walsh, RSC Adv., 2012, 2, 10125 RSC.
- M. Skyllas-Kazacos, M. Rychcik, R. G. Robins, A. G. Fane and M. A. Green, J. Electrochem. Soc., 1986, 133(5), 1057 CrossRef CAS.
- M. Skyllas-Kazacos, M. H. Chakrabarti, S. A. Hajimolana, F. S. Mjalli and M. Saleem, J. Electrochem. Soc., 2011, 158, R55 CrossRef CAS.
- C. Ding, H. Zhang, X. Li, T. Liu and F. Xing, J. Phys. Chem. Lett., 2013, 4, 1281 CrossRef CAS PubMed.
- G. Kear, A. A. Shah and F. C. Walsh, Int. J. Energy Res., 2012, 36, 1105 CrossRef CAS.
- A. Cunha, J. Martins, N. Rodrigues and F. P. Brito, Int. J. Energy Res., 2015, 39, 889 CrossRef CAS.
- W. Zhang, J. Xi, Z. Li, H. Zhou, L. Liu, Z. Wu and X. Qiu, Electrochim. Acta, 2013, 89, 429 CrossRef CAS.
- C. Flox, C. Fabrega, T. Andreu, A. Morata, M. Skoumal, J. Rubio-Garcia and J. R. Morante, RSC Adv., 2013, 3, 12056 RSC.
- Z. He, L. Liu, C. Gao, Z. Zhou, X. Liang, Y. Lei, Z. He and S. Liu, RSC Adv., 2013, 3, 19774 RSC.
- H. Zhou, J. Xi, Z. Li, Z. Zhang, L. Yu, L. Liu, X. Qiu and L. Chen, RSC Adv., 2014, 4, 61912 RSC.
- W. Dai, Y. Shen, Z. Li, L. Yu, J. Xi and X. Qiu, J. Mater. Chem. A, 2014, 2, 12423 CAS.
- B. Yin, Z. Li, W. Dai, L. Wang, L. Yu and J. Xi, J. Power Sources, 2015, 285, 109 CrossRef CAS.
- M. Skyllas-Kazacos and M. Kazacos, J. Power Sources, 2011, 196, 8822 CrossRef CAS.
- M. J. Watt-Smith, P. Ridley, R. G. A. Wills, A. A. Shah and F. C. Walsh, J. Chem. Technol. Biotechnol., 2013, 88, 126 CrossRef CAS.
- B. Tian, C. W. Yan, Q. Qu, H. Li and F. H. Wang, Battery Bimon., 2003, 33, 261 CAS.
- K. Ngamsai and A. Arpornwichanop, J. Power Sources, 2015, 282, 534 CrossRef CAS.
- K. Ngamsai and A. Arpornwichanop, J. Power Sources, 2015, 298, 150 CrossRef CAS.
- L. Liu, J. Xi, Z. Wu, W. Zhang, H. Zhou, W. Li and X. Qiu, J. Appl. Electrochem., 2012, 42, 1025 CrossRef CAS.
- L. Liu, J. Xi, Z. Wu, W. Zhang, H. Zhou, W. Li and Y. He, J. Spectrosc., 2013, 453980 Search PubMed.
- S. Rudolph, U. Schroder, I. M. Bayanov, K. Blenke and D. Hage, J. Electroanal. Chem., 2013, 694, 17 CrossRef CAS.
- R. P. Brooker, C. J. Bell, L. J. Bonville, H. R. Kunz and J. M. Fenton, J. Electrochem. Soc., 2015, 162, A608 CrossRef CAS.
- Z. Tang, D. S. Aaron, A. D. Papandrew and T. A. Zawodzinski, ECS Trans., 2012, 41(23), 1 CAS.
- Z. Tang, Characterization Techniques and Electrolyte Separator Performance Investigation for All Vanadium Redox Flow Battery, PhD diss., University of Tennessee, 2013, http://trace.tennessee.edu/utk_graddiss/2620.
- X. Gao, R. P. Lynch, M. J. Leahy and D. N. Buckley, ECS Trans., 2013, 45(26), 25 CrossRef.
- D. N. Buckley, X. Gao, R. P. Lynch, N. Quill and M. J. Leahy, J. Electrochem. Soc., 2014, 161, A524 CrossRef CAS.
- C. Petchsingh, N. Quill, J. T. Joyce, D. N. Edidhin, D. Oboroceanu, C. Lenihan, X. Gao, R. P. Lynch and D. N. Buckley, J. Electrochem. Soc., 2016, 163, A5068 CrossRef.
|
This journal is © The Royal Society of Chemistry 2015 |
Click here to see how this site uses Cookies. View our privacy policy here.