DOI:
10.1039/C5RA20996J
(Paper)
RSC Adv., 2015,
5, 98260-98268
Magnetic Fe3O4@MOFs decorated graphene nanocomposites as novel electrochemical sensor for ultrasensitive detection of dopamine
Received
10th October 2015
, Accepted 9th November 2015
First published on 10th November 2015
Abstract
A novel hybrid nanocomposite of magnetic Fe3O4@ZIF-8 (zeolitic imidazolate framework-8 coated Fe3O4 nanocomposites denoted as Fe3O4@ZIF-8) decorated RGO (reduced graphite oxide) was prepared by a simple method for the first time and denoted as Fe3O4@ZIF-8/RGO. After the Fe3O4/RGO was formed by solvothermal approach, the MOFs (ZIF-8) was coated on the surface of Fe3O4 to get the Fe3O4@ZIF-8/RGO nanocomposite. The resulted Fe3O4@ZIF-8/RGO nanocomposite was characterized by means of the transmission electron microscope (TEM), scanning electron microscopy (SEM), Fourier transform infrared spectra (FT-IR), X-ray diffraction spectrometry (XRD), X-ray photoelectron (XPS), and vibrating sample magnetometer (VSM). This nanocomposite was modified on the glassy carbon electrode to fabricate biosensor which used to electrochemical determination for dopamine (DA) in phosphate buffer solution. The results demonstrated the fabricated biosensor showed great potential applications in the detection of DA with remarkable enhanced effect on voltammetric response of DA. The linear relationship between the response peak currents and DA concentration was in range from 2.0 × 10⁻⁹ to 1.0 × 10⁻⁵ M, the limits of detection is 6.67 × 10⁻¹⁰ M. Moreover, the prepared biosensor also showed good selectivity for DA detection in the presence of ascorbic acid and uric acid and satisfactory result in real samples detection.
1. Introduction
Metal–organic frameworks (MOFs), as new structured hybrid materials that consist of inorganic connectors and organic linker molecules, have attracted enormous interest because of their large accessible surface areas, high porosity, tunable pore sizes, ordered crystalline structures and excellent mechanical stability.1–3 These remarkable characteristics helped MOFs showed great potential application in gas adsorption, catalysis, separation and purification.4 Because many metal ions used in MOFs are electrochemically active, MOFs are also received growing concerns in electrochemical biosensors field.5,6 To enhance the conductivity, stability in aqueous solution and electro-catalytic activities of target analytes, the introduction of the other highly conductive and mechanically durable materials into MOFs has been proposed.7,8
Graphene, composed of a single-atom-thick two-dimensional sheet of covalently bonded carbon atoms, has extraordinary electronic conductivity, high specific surface area, exceptional electron transfer rate, optical, structural and mechanical properties.9–11 In recent years, the graphene has been pay close attention to be the outstanding candidate for potential electrode modifying material because its bio-electrocatalytic properties and physical stability.12,13 As one kind of chemically derived graphene, reduced graphite oxide (RGO) with similar characteristics to graphene in many aspects has shown great utilization potentiality for application as highly sensitive biosensors.14 To overcome the poor dispersibility and being prone to aggregation owing to the strong stacking tendency in the synthesis process of bulk-quantity RGO, decorating the RGO nano-sheets with inorganic nanoparticles during the preparation is the reasonable way which not only decreases restacking for RGO nano-sheets but also enhances the physical and chemical properties.15
Dopamine (DA) is one of the most significant and representative catecholamine neurotransmitter mediating the transmission of messages within the central nervous system of mammals and humans. An abnormal dopaminergic neuron process may lead to neurological illnesses, such as Parkinson's, Alzheimer's and Schizophrenia diseases.16 As the trace level concentration of DA change has been related to various diseases, the rapid, sensitive and accurate measurement to detect the trace amount of DA is of extreme importance. Several methods have been established for DA detection, such as liquid chromatography, chemiluminescence, capillary electrophoresis, fluorescence, and absorbance and colorimetric methods. Because DA can be easily electrochemically oxidized, the electrochemical biosensors have been considered to be superior to other techniques for the determination of DA in view of its high accuracy, fast response, bulk modification with simple instruments, and low operation and instrumental expenses.17
Zeolitic imidazolate frameworks (ZIFs) is an attractive subfamily of MOFs due to their exceptional chemical and thermal stabilities and the ease of synthesis. In this work, we have developed a simple method to prepare a novel hybrid nanocomposite of magnetic Fe3O4@ZIF-8 decorated graphene with excellent dispersibility and stability in aqueous solution.18 In this process, Fe3O4 decorated RGO is formed firstly by the solvothermal approach, and then ZIF-8 is synthesized on the surface of Fe3O4 to get the final products, Fe3O4@ZIF-8/RGO nanocomposite. The designed novel structure of anchoring the Fe3O4@MOFs nanospheres on graphene nano-sheets could not only restrained restacking of the graphene nano-sheets, but also incorporated of a rapid response towards an assistant magnetic field and fascinating electro-catalytic properties. To explore the potential electrochemical application of the Fe3O4@ZIF-8/RGO, the nanocomposite was immobilized on a glassy carbon electrode (GCE) to form a sensing platform for the detection of DA. The results demonstrated that Fe3O4@ZIF-8/RGO modified electrode had a high sensitivity, favorable performance and reproducibility, and excellent selectivity for determination of DA.
2. Experiment
2.1. Materials and reagents
Ferric chloride hexahydrate (FeCl3·6H2O), sodium acetate, ethylene glycol (EG), and Zn(NO3)2·6H2O were obtained from Sinopharm Chemical Reagent, Co., Ltd (Shanghai, China). Stock solution of dopamine (0.01 mol L−1) was prepared by dissolving dopamine (0.1531 g) in 100 mL deionized water. The phosphate buffer solution (PBS, 0.1 mol L−1), which was prepared by mixing Na2HPO4 and NaH2PO4 stock solution and adjusted to the pH value of 5.0–7.5 with 0.1 mol L−1 H3PO4 or NaOH solution, was used as the supporting electrolyte during all measurements.
2.2. Apparatus
The FT-IR was recorded with a Nicolet Magna-IR spectrophotometer between 4000 and 450 cm−1 using the KBr pellet technique. Transmission electron microscopy (TEM, FEI Tecnai G20) was obtained to elucidate the dimensions of the nanoparticle. The crystalline structures of samples were characterized by X-ray diffraction (XRD) (RigakuD/max-2400). The chemical analysis for the composites were conducted by X-ray photoelectron spectroscopy (XPS, ESCALAB210, VG, UK). Magnetization measurements were performed on a vibrating sample magnetometry (VSM, LAKESHORE-7304, USA). Amperometric measurements were performed on a CHI 660E electrochemical workstation.
2.3. Preparation of Fe3O4/RGO nanocomposites
Graphite oxide (GO) was prepared according to the modified Hummers method.19 Then, Fe3O4/RGO nanocomposites were synthesized via the solvothermal approach. Typically, 40 mg of GO was introduced into 30 mL of ethylene glycol (EG) and sonicated for 30 min to get brown dispersion solution. Then 0.987 g of FeCl3·6H2O and 1.946 g of sodium acetate were dissolved in the EG solution of GO by stirring for 30 min. After that, the mixture was transferred to a Teflon-lined autoclave and treated at 200 °C for 8 h. The obtained Fe3O4/RGO nanocomposites were collected by magnetic decantation and washed with ethanol and distilled water thoroughly. Finally, the nanocomposites were dried at 60 °C of 24 h under vacuum.20
2.4. Preparation of Fe3O4@ZIF-8/RGO nanocomposites
0.12 g of Zn(NO3)2 was dissolved in 15 mL of 50% ethanol solution containing 2 mmol HCl. 0.35 g of obtained Fe3O4/RGO nanocomposites was dispersed in above solution by sonication for 20 min. After that, 30 mL of 50% ethanol solution containing 0.34 g 2-methylimidazole was added to the suspension and the mixture was stirred with ultrasound at room temperature for 10 min. The product, Fe3O4@ZIF-8/RGO nanocomposites, were collected by a magnet and washed with distilled water and ethanol thoroughly, then dried at 60 °C under the vacuum for 24 h.21
2.5. Preparation of Fe3O4@ZIF-8/RGO modified electrode
1 mg of Fe3O4@ZIF-8/RGO was dispersed in 1 mL of dimethyl formamide (DMF) and the mixture was sonicated for 30 min to achieve a well-dispersed suspension. Prior to modification, the bare GCE was polished to a mirror-like surface sequentially with 1.0, 0.3 mm and 0.05 μm of α-Al2O3, and then rinsed ultrasonically with water and ethanol and de-ionized water. After the solvent was evaporated, 5 μL of Fe3O4@ZIF-8/RGO suspension was cast onto the electrode surface. Thus the Fe3O4@ZIF-8/RGO nanocomposites modified electrode (Fe3O4@ZIF-8/RGO/GCE) was obtained after it was dried in air for approximately 3 h. For comparison, the Fe3O4@ZIF-8 modified GCE (Fe3O4@ZIF-8/GCE) and GO modified GCE (GO/GCE) were prepared only by replacing the Fe3O4@ZIF-8/RGO suspension with Fe3O4@ZIF-8 or GO suspension. Fig. 1 shows the preparation of Fe3O4@ZIF-8/RGO/GCE and its application for sensing analysis of DA.
 |
| Fig. 1 Scheme for the preparation of Fe3O4@ZIF-8/RGO, and its application for the determination of DA. | |
2.6. Electrochemical measurement
Electrochemical characterizations of the modified electrodes were performed in 0.1 M phosphate buffer solution (PBS) (pH 5.0) through cyclic scan in the potential range from −1.0 to 0.8 V. The electrochemical sensing test of the modified electrode was carried out with a CHI 660E electrochemistry workstation by a conventional three-electrode system, comprising a platinum wire as the auxiliary electrode, a saturated calomel electrode as the reference electrode and the modified GCE as the working electrode in the following procedure: a 15 mL solution containing an appropriate amount of dopamine and 0.1 M PBS was transferred into a voltammetric cell, and then cyclic voltammetry (CV) and differential-pulse voltammetry (DPV) measurements were recorded. Real samples determination was experimented by the standard addition method. The urine and serum samples were diluted with PBS (0.1 M, pH 5.5) and spiked with different amounts of known concentrations of DA, and measured under the optimal conditions.
3. Results and discussion
3.1. Characterization of Fe3O4@ZIF-8/RGO nanocomposites
The morphologies of the Fe3O4/RGO, Fe3O4@ZIF-8 and Fe3O4@ZIF-8/RGO are characterized by SEM and TEM, and the TEM and SEM images of each synthesized composites are shown in Fig. 2. As shown in Fig. 2a and d, Fe3O4 nanoparticles have been decorated on the surface of graphene nano-sheets with a diameter of about 200 nm. The monodisperse core–shell structure of Fe3O4@ZIF-8 is just like the reported.21 The nearly spherical shape of Fe3O4@ZIF-8 and the formation of the ZIF-8 shell could be observed by the SEM image (Fig. 2b) and TEM image (Fig. 2e). Compared with Fe3O4/RGO and Fe3O4@ZIF-8, the Fe3O4@ZIF-8/RGO nanocomposites (Fig. 2c and f) combined two features of each composites, the folds of graphene sheets and core–shell structure of Fe3O4@ZIF-8 are exhibited obviously in the images. Therefore, demonstrated by TEM and SEM results, the novel Fe3O4@ZIF-8/RGO nanocomposites have been successfully prepared.
 |
| Fig. 2 TEM images of the Fe3O4/RGO (a), Fe3O4@ZIF-8 (b) and Fe3O4@ZIF-8/RGO (c) and SEM images of the Fe3O4/RGO (d), Fe3O4@ZIF-8 (e) and Fe3O4@ZIF-8/RGO (f). | |
The chemical structures of the Fe3O4, Fe3O4/RGO, Fe3O4@ZIF-8 and Fe3O4@ZIF-8/RGO are characterized by FT-IR spectra, as presented in Fig. 3. The spectrum of Fe3O4 is just same to the report, and the peak at 580 cm−1 is related to the vibration of Fe–O functional groups.22 While in the FT-IR spectrum of Fe3O4/RGO, the bands at 3490 cm−1 and 1200 cm−1 appear, which correspond to the stretching vibration of C–H and C–N (in the –C–NH–C– group), respectively.23,24 Compared to the spectrum of Fe3O4, the spectrum of Fe3O4@ZIF-8 displays different peaks contributed by the ZIF-8 shell. The bands in region of 900–1330 cm−1 and band at 1440 cm−1 are attributed to the imidazole ring, and the band at 422 cm−1 could be assigned to the Zn–N stretch mode.21,25 The spectrum of Fe3O4@ZIF-8/RGO nanocomposites also combines the features of above composites, and shows the characteristic absorption bands of each constituent part. Overall, the FT-IR spectra confirmed the formation of Fe3O4@ZIF-8/RGO structure.
 |
| Fig. 3 FT-IR spectrum of Fe3O4, Fe3O4@ZIF-8, Fe3O4/RGO and Fe3O4@ZIF-8/RGO nanocomposite. | |
The crystal structure of the as prepared samples have been identified by X-ray power diffraction techniques and the XRD spectrum are show in Fig. 4. The intense and sharp peak at 10.6° in the spectrum of GO is attributed to the crystalline plane of graphite oxide, and the diffraction peaks of Fe3O4 can be assigned to a superposition of standard XRD pattern of face-centered cubic Fe3O4.26 However, the peak at 10.6° has entirely disappeared after the Fe3O4 decorated on the graphene through hydrothermal reaction because EG could reduce GO and Fe3+ to graphene and Fe2+, respectively.20,27 Simultaneously, standard Fe3O4 XRD pattern in the spectrum of Fe3O4/RGO demonstrating the Fe3O4 nanoparticles are successfully decorated on graphene sheets. The XRD pattern of Fe3O4@ZIF-8 is consistent with the characteristic peaks of Fe3O4 and the simulated pattern of published ZIF-8 structure data.21,28 The diffraction peaks of Fe3O4@ZIF-8/RGO are very similar to Fe3O4@ZIF-8, indicating the coexistence of Fe3O4@ZIF-8 and graphene in the resulted nanocomposite.
 |
| Fig. 4 XRD spectrum of Fe3O4, Fe3O4@ZIF-8, Fe3O4/RGO and Fe3O4@ZIF-8/RGO nanocomposite. | |
To investigate the chemical elements on the surface of the Fe3O4/RGO and Fe3O4@ZIF-8/RGO, the XPS analysis was performed. The wide-scan XPS spectra for Fe3O4/RGO and Fe3O4@ZIF-8/RGO are shown in Fig. 5a. The characteristic peaks of Fe 2p, Fe 3p, O 1s and C 1s appeared in the spectrum of Fe3O4/RGO. Compared with the Fe3O4/RGO, new peaks assigned to Zn 2p1, Zn 2p3 and N 1s are clearly observed in the spectrum of Fe3O4@ZIF-8/RGO, demonstrated the MOFs (ZIF-8) have been successfully reacted on the surface of Fe3O4. Moreover, as the ZIF-8 was covered on the Fe3O4, the peaks of Fe 2p and Fe 3p are disappeared and the peak of O 1s decreased sharply. Fig. 5b shows the C 1s spectrums of Fe3O4/RGO and Fe3O4@ZIF-8/RGO, the only peak at 527.95 eV could be assigned to the C–C in the spectrum of Fe3O4/RGO, and two peaks in Fe3O4@ZIF-8/RGO corresponding to C–C (183.51 eV) and C
C (186.16 eV) demonstrated the 2-methylimidazole has covered on the Fe3O4. The N 1s spectrum of Fe3O4@ZIF-8/RGO (Fig. 5c) shows two species of N 1s peak corresponding to –NH– (397.53 eV) and –N
(400.59 eV) which also characterized the 2-methylimidazole on the nanocomposite.20,29
 |
| Fig. 5 XPS spectra of (a) wide scan of Fe3O4/RGO and Fe3O4@ZIF-8/RGO; (b) N 1s of Fe3O4@ZIF-8/RGO; (c) C 1s of Fe3O4/RGO and Fe3O4@ZIF-8/RGO. | |
The magnetic property of Fe3O4@ZIF-8/RGO was studied using a superconducting quantum interference device (SQUID) magnetometer at room temperature, as shown in Fig. 6. The hysteresis loops of the Fe3O4 nanoparticle, Fe3O4/RGO, Fe3O4@ZIF-8 and Fe3O4@ZIF-8/RGO nanocomposite are characterized the magnetic measurements of each product. The saturation magnetization of Fe3O4, Fe3O4/RGO, Fe3O4@ZIF-8 and Fe3O4@ZIF-8/RGO is 79.08, 60.87, 50.41 and 41.65 emu g−1, respectively. Although the magnetic intensity of Fe3O4@ZIF-8/RGO decreases obviously after the ZIF-8 was reacted on the Fe3O4, the Fe3O4@ZIF-8/RGO nanocomposite can be easily separated conveniently by using magnetic field, and facilitated collection and operation.30
 |
| Fig. 6 VSM curves (B) of Fe3O4, Fe3O4@ZIF, Fe3O4/RGO and Fe3O4@ZIF-8/RGO nanocomposite. | |
3.2. Voltammetric behavior of DA at Fe3O4@ZIF-8/RGO/GCE
To exploit the potential application of the Fe3O4@ZIF-8/RGO nanocomposite, the electrochemical behaviors of DA were investigated on the Fe3O4@ZIF-8/RGO/GCE. Fig. 7 shows typical CVs of 1 mM DA on the bare GCE, the Fe3O4@ZIF-8/GCE, the Fe3O4/RGO/GCE and the Fe3O4@ZIF-8/RGO/GCE. On the bare GCE, DA exhibits a reversible electrochemical behavior and the small current indicates it is inefficient to detect of DA on the bare GCE. At the Fe3O4@ZIF-8, a couple of small redox peaks appeared and the oxidation peak current of DA enhanced notable, it is because that the relative large surface area of electrode increased significantly after immobilization of Fe3O4@ZIF-8. Due to the excellent electric conductivity of reduced graphite oxide, the anodic peak current at the Fe3O4/RGO/GCE is increased strikingly. However, when the Fe3O4@ZIF-8/RGO/GCE was applied for determination, the redox peaks of DA increased dramatically with a well-defined peak shape, and the redox process became more reversible as judged from the more symmetric peak profiles. Therefore, the component of MOFs (ZIF-8) material in the graphene nano-sheets have positive effect on improving the electrochemical response, which is likely caused by the outstanding porous structure and favorable electron transfer mediating function of the electroactive MOFs.7,31
 |
| Fig. 7 Cyclic voltammograms at the bare GCE, the Fe3O4@ZIF-8/GCE, the Fe3O4/RGO/GCE and the Fe3O4@ZIF-8/RGO/GCE in the presence of DA in PBS (0.1 M, pH 5.5). DA concentration: 1 mM, and scan rate: 20 mV s−1. | |
3.3. Electrochemical parameters of DA at Fe3O4@ZIF-8/RGO/GCE
The influence of the scan rate (ν) on the oxidation current of 0.1 mM DA was examined using Fe3O4@ZIF-8/RGO/GCE in 0.1 M pH 5.0 PBS by varying the scan rates from 10 to 50 mV s−1. As shown in Fig. 8, the anodic and cathodic peak currents are both increased gradually when increasing the scan rate. Farther more, with the increase of scan rate, the anodic peak potential and cathodic peak potential slightly shifted to more positive and negative potentials, respectively, indicating that the electron transfer rate decreased and the electrochemical reaction of DA tended to be less reversible. A good linear relationship among the scan rate, the values of the anodic peak current (Ipa) and the cathodic peak current (Ipc) is also obtained. The linear regression equation for the anodic peak current and cathodic current is Ipa (μA) = 5.6328 + 0.21468ν (mV s−1), and Ipc (μA) = −3.1756 − 0.1023ν (mV s−1), respectively, and the correlation coefficient is Rpa = 0.9965, Rpc = 0.9903, respectively. This result suggests that the electrochemical oxidation is an absorption-controlled process for DA at the Fe3O4@ZIF-8/RGO/GCE surface.32
 |
| Fig. 8 Cyclic voltammograms of 0.1 mM DA in 0.1 mM PBA at the Fe3O4@ZIF-8/RGO/GCE at scan rate of 10–50 mV s−1. The inset shows the plots of anodic and cathodic peak currents vs. scan rates. | |
Since the redox system was affected by the change of pH due to the involvement of protons in the electrode reaction and the electro-catalytic reaction at the Fe3O4@ZIF-8/RGO/GCE is a two electron, two proton process, the influence of pH on the biosensor performance was investigated by measuring the electrode response in 0.1 mM DA with pH values ranging from 5.0 to 7.5.33 As shown in Fig. 9, the oxidation peak potential (Epa) of DA shifted negatively with the increased of pH. A good linear relationship between Epa and pH was constructed and described with a linear equation: E (V) = −0.0704 pH + 0.7773 (R = 0.9935). Farther more, the oxidation peak current (Ipa) also changed with the pH of DA solution ranged from 5.0 to 7.5, and the maximum response current was obtained at pH of 5.5. Thus, a phosphate buffer solution of pH 5.5 was chosen as the optimum pH and used in all experiments below.
 |
| Fig. 9 Effects of pH on Epa and Ipa of 0.1 mM in 0.1 M PBS on the Fe3O4@ZIF-8/RGO/GCE. | |
3.4. Analytical performance and applications
Voltammetric current responses of successive additions of DA were recorded by differential pulse voltammetry (DPV) to check the sensitivity of the sensor under the optimal experimental conditions. As shown in Fig. 10, with the increasing concentration of DA, the oxidation peak current (Ipa) increased relatively. Linearly proportional of peak current and DA concentration is observed in the range from 2.0 × 10⁻⁹ to 1.0 × 10⁻⁵ M (inset of Fig. 10). The linear regression equations for DA is Ipa (μA) = 1.144 + 0.0056C (10−9 M) and the correlation coefficient is 0.9966. According to signal to noise (S/N) = 3, the detection limits of DA was estimated to be 6.67 × 10⁻¹⁰ M. Table 1 summarized the comparison of analytical results of the analytical performance Fe3O4@ZIF-8/RGO/GCE with other dopamine sensor reported recently. Through the comparison, the obtained biosensor in this work has comparable and even better performance than the others, demonstrating that Fe3O4@ZIF-8/RGO/GCE has extraordinary application potential in determination of DA.
 |
| Fig. 10 DPV for different concentration of DA at the Fe3O4@ZIF-8/RGO/GCE. The inset shows the relationship between the peak current and DA concentration. | |
Table 1 Comparison of analytical performance of DA at different modified electrodes
Modified materials |
Methods |
Linear ranges (M) |
Detection limits (M) |
Ref. |
GO |
DPV |
1 × 10⁻⁶ to 1.5 × 10⁻⁷ |
0.27 × 10⁻⁶ |
35 |
Fe3O4/RGO |
DPV |
4 × 10⁻⁷ to 1.6 × 10⁻⁴ |
8 × 10⁻⁸ |
36 |
Pd/graphene/chitosan |
DPV |
5 × 10⁻⁷ to 2 × 10⁻⁴ |
1 × 10⁻⁷ |
37 |
Polypyrrole@RGO |
DPV |
6 × 10⁻⁸ to 8 × 10⁻⁶ |
6 × 10⁻⁹ |
38 |
Cu(tpa)-EGR |
DPV |
1 × 10⁻⁶ to 5 × 10⁻⁵ |
2.1 × 10⁻⁷ |
7 |
Nafion/C/Al-MIL-53-(OH)2 |
DPV |
3 × 10⁻⁸ to 1 × 10⁻⁵ |
8 × 10⁻⁹ |
8 |
Porphyrin–RGO |
DPV |
1 × 10⁻⁶ to 7 × 10⁻⁵ |
9.5 × 10⁻⁹ |
39 |
RGO–MWNTs–PTA |
DPV |
5 × 10⁻⁷ to 2 × 10⁻⁵ |
1.14 × 10⁻⁶ |
40 |
Fe3O4@ZIF-8/RGO |
DPV |
2 × 10⁻⁹ to 1 × 10⁻⁵ |
6.67 × 10⁻¹⁰ |
This work |
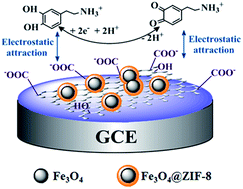
As an important parameter for a biosensor, discriminating the target between the interfering species in similar physiological environments is necessary to be investigated. For the determination of DA, the electrochemical behaviors of ascorbic acid (AA), and uric acid (UA) (usually coexist with DA) on Fe3O4@ZIF-8/RGO/GCE has be studied. As shown in Fig. 11, a couple of shape redox peaks is exhibited in the CV of 1 mM of DA, on the contrary, no obvious peak appeared in the CV of 1 × 10⁻³ M of AA and UA, which suggested that DA can be detected in the presence of AA and UA.34 To demonstrate the selectivity of Fe3O4@ZIF-8/RGO/GCE for DA more comprehensively, various potential organic compounds and inorganic ions such as NaCl, K2SO4, CaCl2 solutions, lysine, cysteine and glucose solutions were added to the 1 mM of DA solution. The peak currents of DA showed almost no interference in the presence of these influences since their peak currents changes were below 5%. A possible reaction mechanism was discussed here, the negatively charged Fe3O4@ZIF-8/RGO acted as electro-catalysts and selective reagents simultaneously, thus, the positively charged DA was attracted and electro-catalyzed on the sensor, otherwise, the negatively charged analytes such as AA and UA were repelled. Therefore, with a wide linear range, low detection potential, and high sensitivity, the Fe3O4@ZIF-8/RGO could be used as promising candidates to prepare the dopamine biosensors.
 |
| Fig. 11 Cyclic voltammograms of the Fe3O4@ZIF-8/RGO/GCE in 0.1 PBS with 1 mM DA, AA and UA, respectively. | |
3.5. Reproducibility of biosensor and real sample determination
The reproducibility and stability of the Fe3O4@ZIF-8/RGO/GCE were further examined. When the electrode was successively scanned in 1 mM DA in 0.1 M pH 5.0 PBS for 50 cycles, there were no obvious changes in the peak current in the CV curves. Repeated DPV experiment was also conducted in the same condition, and the relative standard deviation (RSD) was 2.13% after 15 successive measurements. The long-term stability of the electrode was investigated by measuring its CV response over a 10 day period. The fabricated electrodes were stored under normal conditions at room temperature, and no obvious changes were found when measured it periodically. Therefore, the results indicated the excellent reproducibility and stability of the prepared Fe3O4@ZIF-8/RGO/GCE biosensor. Real samples were analyzed by the standard addition method to evaluate the potential application of Fe3O4@ZIF-8/RGO/GCE biosensor. Urine and serum samples were diluted with PBS (0.1 M, pH 5.5) in order to avoid the interferences of the complicated matrix in the real samples and fit into the linear ranges of DA. Then the diluted samples were spiked with different amounts of known concentrations of DA, and measured under the optimal conditions. The analytical results are shown in Table 2. As can be observed, the recovery of the spiked samples was in the range of 98.20–102.73% (n = 5) with the relative standard derivation (RSD) values were calculated to be less than 2.69%, indicated that the method is reliable and sensitive for determination of DA in real samples.
Table 2 Determination of DA in real samples using Fe3O4@ZIF-8/RGO/GCE
Samples |
Added (μM) |
Found (μM) |
RSD (%) |
Recovery (%) |
Serum 1 |
— |
0.093 |
1.91 |
— |
0.200 |
0.301 |
2.23 |
102.73 |
0.500 |
0.597 |
2.54 |
100.81 |
Serum 2 |
— |
0.223 |
2.36 |
— |
0.200 |
0.429 |
1.87 |
101.42 |
0.500 |
0.719 |
1.61 |
99.44 |
Urine 1 |
— |
0.134 |
2.62 |
— |
0.200 |
0.328 |
2.69 |
98.20 |
0.500 |
0.639 |
2.28 |
100.88 |
Urine 2 |
— |
1.102 |
1.77 |
— |
0.200 |
1.309 |
1.89 |
100.73 |
0.500 |
1.597 |
2.01 |
99.61 |
4. Conclusions
In this paper, a novel hybrid nanocomposite of magnetic Fe3O4@ZIF-8 decorated graphene was prepared by a simple method for the first time. After the Fe3O4/RGO was formed by solvothermal approach, the MOFs (ZIF-8) was fabricated on the surface of Fe3O4 to get the Fe3O4@ZIF-8/RGO nanocomposite. By combing the unique properties of large specific surface area and high conductivity derived from both of MOFs and graphene, the Fe3O4@ZIF-8/RGO nanocomposites modified glassy carbon electrode was successfully constructed and used for electrochemical detection of DA. The fabricated biosensor showed great potential applications in the detection of DA with extraordinary advantages such as wide linear range (2.0 × 10⁻⁹ to 1.0 × 10⁻⁵ M), low detection limit (6.67 × 10⁻¹⁰) and good selectivity for DA detection in the presence of ascorbic acid and uric acid. Moreover, the prepared sensor also showed satisfactory result in real samples detection. Our present study demonstrated the combination of MOFs and graphene composites could fabricate a new kind of high sensitive biosensor for electrochemical detection.

Acknowledgements
The authors gratefully acknowledge financial supports from the National Natural Science Foundation of China (no. 21304040), Natural Science Foundation of Gansu Province (1308RJYA027) and Chinese Postdoctoral Funds (2013M532090). This paper is dedicated to memory of pro. Yanfeng Li, who passed away recently.
References
- J. R. Li, J. Sculley and H. C. Zhou, Chem. Rev., 2011, 112, 869 CrossRef PubMed.
- M. Yaghi, M. O'Keeffe, N. W. Ockwig, H. K. Chae, M. Eddaoudi and J. Kim, Nature, 2003, 423, 705 CrossRef PubMed.
- P. Chowdhury, C. Bikkina, D. Meister, F. Dreisbach and S. Gumma, Microporous Mesoporous Mater., 2009, 117, 406 CrossRef CAS.
- M. Zhao, S. Ou and C. D. Wu, Acc. Chem. Res., 2014, 47, 1199 CrossRef CAS PubMed.
- Y. Li, C. Huangfu, H. Du, W. Liu, Y. Li and J. Ye, J. Electroanal. Chem., 2013, 709, 65 CrossRef CAS.
- Y. Zhang, X. Bo, C. Luhana, H. Wang, M. Li and L. Guo, Chem. Commun., 2013, 49, 6885 RSC.
- X. Wang, Q. X. Wang, Q. H. Wang, F. Gao, F. Gao, Y. Z. Yang and H. X. Guo, ACS Appl. Mater. Interfaces, 2014, 6, 11573 CAS.
- Y. Wang, H. L. Ge, G. Q. Ye, H. H. Chen and X. Y. Hu, J. Mater. Chem. B, 2015, 3, 3747 RSC.
- X. Li, S. Zhu, B. Xu, K. Ma, J. Zhang, B. Yang and W. Tian, Nanoscale, 2013, 5, 7776 RSC.
- L. Li, A. R. O. Raji and J. M. Tour, Adv. Mater., 2013, 25, 6298 CrossRef CAS PubMed.
- B. Zhan, C. Liu, H. Chen, H. Shi, L. Wang, P. Chen, W. Huang and X. Dong, Nanoscale, 2014, 6, 7424 RSC.
- C. Z. Liao, M. Zhang, L. Y. Niu, Z. j. Zheng and F. Yan, J. Mater. Chem. B, 2014, 2, 191–200 RSC.
- X. M. Feng, Y. Zhang, J. h. Zhou, Y. Li, S. F. Chen, L. Zhang, Y. W. Ma, L. H. Wang and X. H. Yan, Nanoscale, 2015, 7, 2427 RSC.
- A. M. J. Haque, H. Park, D. Sung, S. Jon, S. Y. Choi and K. Kim, Anal. Chem., 2012, 84, 1871 CrossRef CAS PubMed.
- X. H. Li, H. Zhu, J. Feng, J. Zhang, X. Deng, B. Zhou, H. Zhang, D. Xue, F. Li, N. Mellors, Y. F. Li and Y. Peng, Carbon, 2013, 60, 488 CrossRef CAS.
- S. Ikemoto, Brain Res. Rev., 2007, 56, 27 CrossRef CAS PubMed.
- W. X. Zhang, J. Z. Zheng, C. H. Tan, X. Lin, S. R. Hu, J. H. Chen, X. L. You and S. X. Li, J. Mater. Chem. B, 2015, 3, 217–224 RSC.
- Y. C. Pan, Y. Y. Liu, G. F. Zeng, L. Zhao and Z. P. Lai, Chem. Commun., 2011, 47, 2071 RSC.
- H. Zhou, W. Yao, G. Li, J. Wang and Y. Lu, Carbon, 2013, 59, 495 CrossRef CAS.
- W. Yao, T. Ni, S. Chen, H. Li and Y. Lu, Compos. Sci. Technol., 2014, 99, 15 CrossRef CAS.
- J. N. Zheng, Z. Lin, G. Lin, H. H. Yang and L. Zhang, J. Mater. Chem. B, 2015, 3, 2185 RSC.
- Y. Wang, Y. Zhang, C. Hou, Z. Qi and X. He, Chemosphere, 2015, 141, 26 CrossRef CAS PubMed.
- Y. Q. Wang, B. F. Zou, T. Gao, X. P. Wu, S. Y. Lou and S. M. J. Zhou, Mater. Chem. Phys., 2012, 22, 9034 CAS.
- H. L. Ma, Y. W. Zhang, Q. H. Hu, D. Yan, Z. Z. Yu and Z. M. L. Zhai, J. Mater. Chem., 2012, 22, 5914 RSC.
- Y. Hu, H. Kazemian, S. Rohani, Y. N. Huang and Y. Song, Chem. Commun., 2011, 47, 12694 RSC.
- W. Fan, W. Gao, C. Zhang, W. W. Tjiu, J. S. Pan and T. X. Liu, J. Mater. Chem., 2012, 22, 25108 RSC.
- K. F. Zhou, Y. H. Zhu, X. L. Yang and C. Z. Li, New J. Chem., 2010, 34, 2950 RSC.
- K. S. Park, Z. Ni, A. P. Côté, J. Y. Choi, R. Huang, F. J. Uribe-Romo, H. K. Chae, M. O'Keeffe and O. M. Yaghi, Proc. Natl. Acad. Sci. U. S. A., 2006, 103, 10186 CrossRef CAS PubMed.
- L. Sun, L. Wang, C. G. Tian, T. X. Tan, Y. Xie and K. Y. Shi, RSC Adv., 2012, 2, 4498 RSC.
- Y. Wang, Y. Zhang, C. Hou, X. He and M. Liu, J. Taiwan Inst. Chem. Eng., 2015 DOI:10.1016/j.jtice.2015.05.044.
- C. L. Sun, H. H. Lee, J. M. Yang and C. C. Wu, Biosens. Bioelectron., 2011, 26, 3450 CrossRef CAS PubMed.
- M. Zheng, F. Gao, Q. Wang, X. Cai, S. Jiang, L. Huang and F. Gao, Mater. Sci. Eng., C, 2013, 33, 1514 CrossRef CAS PubMed.
- J. Yang, J. R. Strickler and S. Gunasekaran, Nanoscale, 2012, 4, 4594 RSC.
- X. Dong, X. Wang, L. Wang, H. Song, H. Zhang, W. Huang and P. Chen, ACS Appl. Mater. Interfaces, 2012, 4, 3129 CAS.
- F. Gao, X. Cai, X. Wang, C. Gao, S. Liu, F. Gao and Q. Wang, Sens. Actuators, B, 2013, 186, 380 CrossRef CAS.
- H. Teymourian, A. Salimi and S. Khezrian, Biosens. Bioelectron., 2013, 49, 1 CrossRef CAS PubMed.
- X. Wang, M. Wu, W. Tang, Y. Zhu, L. W. Wang, Q. J. Wang, P. J. He and Y. Z. Fang, J. Electroanal. Chem., 2013, 695, 10 CrossRef CAS.
- T. Qian, S. S. Wu and J. Shen, Chem. Commun., 2013, 49, 4610 RSC.
- S. F. Hou, M. L. Kasner, S. J. Su, K. Patel and R. Cuellari, J. Phys. Chem., 2010, 114, 14915 CAS.
- Y. Y. Ling, Q. A. Huang, M. S. Zhu, D. X. Feng, X. Z. Li and Y. J. Wei, Electroanal. Chem., 2013, 693, 9 CrossRef CAS.
|
This journal is © The Royal Society of Chemistry 2015 |
Click here to see how this site uses Cookies. View our privacy policy here.