Andrew Shinkoa,
Sadhan C. Jana*a and
Mary Ann Meadorb
aDepartment of Polymer Engineering, University of Akron, Akron, OH 44325, USA. E-mail: janas@uakron.edu
bNASA Glenn Research Center, 21000 Brookpark Road, Cleveland, OH 44135, USA
First published on 7th December 2015
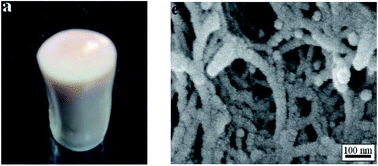
Mechanically robust polyurea aerogels with controlled porosity are synthesized from aromatic isocyanates, aromatic diamines, and a triamine crosslinker. Linear, isocyanate end-capped polyurea oligomers are first synthesized from the reactions between the diamine and 4,4′-diphenylmethane diisocyanate in anhydrous N-methyl-2-pyrrolidone (NMP). The oligomers are then cross-linked with 1,3,5-triaminophenoxylbenzene to produce the gels. The gels are dried under supercritical conditions of carbon dioxide after exchanging NMP with acetone and acetone with liquid carbon dioxide. The aerogels are mesoporous with mean pore diameter in the range of 9–16 nm, have a bulk density of 0.19–0.26 g cm−3, porosity of 79–86%, and surface areas between 106 and 309 m2 g−1. Pore size distributions broaden and shift to larger diameter as the crosslink density is reduced. The spectroscopic evidence suggests that hydrogen bonding is effective in reducing the shrinkage of aerogels, especially when linear oligomers of higher molecular weight are used. These materials show onset of thermal decomposition at 250 °C and offer high compressive moduli in the range of 12–69 MPa.
Aerogels were first reported by Kistler5 in 1931. He synthesized alcohol-based gels of silica, metal alkoxides, cellulose, and other materials. Kistler and co-workers6 explored the use of aerogels as catalyst supports and also reported low values of thermal conductivity for silica aerogels.7 In 1968, Tiechner and Nicolaon8 prepared aerogels via sol–gel process and were able to reduce the synthesis time from several days to a few hours.
In 1989, Pekala9,10 reported synthesis of resorcinol–formaldehyde (RF) aerogels from the reactions of resorcinol and formaldehyde. These aerogels had surface areas as high as 900 m2 g−1.10 Polyurethane aerogels11,12 were made up of flexible solid networks but had relatively low surface areas. Polyimide aerogels were synthesized from a variety of diamine and dianhydride moieties13–16 and were found to be robust and thermally stable. Tough polyimide aerogels with Young's modulus as high as 312 MPa have been reported.17 Syndiotactic polystyrene aerogels show macro- and microporosity and are hydrophobic,2 although their hydrophobicity can be tailored using additives, e.g., using polyethylene oxide18 or developing hybrids with silica aerogels.19 Light weight meso- and macroporous aerogels derived from natural materials such as cellulose,20–22 polysaccharide,23 and pectin24 have been reported. Specifically, cellulose aerogels provide mesopores as small as 10 nm with surface area 200 m2 g−1.20
The present work focuses on polyurea aerogels. Polyurea is used as coatings due to water and chemical resistance, good weatherability, and strong abrasion resistance.25–27 In this context, polyurea aerogels were first documented in a U.S. patent in 1994.28 Lee, Gould, and Rhine29 produced polyurea aerogels by reacting 4,4′-methylene diisocyanate (MDI) and polymeric MDI with long chain aliphatic triamines in the presence of triethylamine as the catalyst. The resultant aerogels had low density (0.12 g cm−3), low thermal conductivity (∼0.02 W mK−1), high porosity (90%), and relatively high surface area (190 m2 g−1). Leventis et al.30 obtained polyurea aerogels by reacting multifunctional isocyanates with water and reported high porosity (as high as 98.6%) and surface area as high as 320 m2 g−1. However, the scanning electron microscopy images reported in the work of Leventis et al.30 indicate the presence of a multitude of macropores, quite possibly originating due to CO2 evolution from the reactions between the isocyanate species and water.
To circumvent significant macropore formation in polyurea aerogels, the present work considered amine–isocyanate reactions in an organic medium and focused on the effects of crosslink density on the aerogel properties, especially on generation of mesopores. Specifically, polyurea gels were synthesized from aromatic diamines, such as 2,2′-dimethylbenzidine (DMBZ), and 4,4′-oxydianiline (ODA) in non-aqueous solvents as shown in Fig. 1. DMBZ and ODA were considered in this work to obtain, respectively, rigid and flexible polyurea aerogels. Meador and co-workers14–16 used these two diamines in the same manner to produce both flexible and rigid polyimide aerogel films. ODA-containing polyimide aerogel films were crack-free and had Young's moduli between 0.9 and 15.9 MPa, while DMBZ-containing polyimide aerogel films had higher moduli between 19.1 and 102 MPa and cracked easily on creasing.14 Similar trends in Young's modulus in polyimide aerogels were observed by Guo et al.15 and Meador et al.16 although different crosslinkers were used. Guo et al.15 used blends of two diamines to obtain moisture-resistant flexible polyimide aerogel films using a combination of 50% DMBZ and 50% ODA with octa-aminophenyl polysilsesquioxane crosslinkers (OAPS). Meador et al.16 used benzene tricarbonyl trichloride as the cross-linker, obtaining even higher modulus aerogels with the same polyimide backbones but found that even aerogels made using 100% DMBZ in the backbone absorbed some water. These effects were also investigated in the present study in the context of polyurea aerogels.
![]() | ||
| Fig. 1 Reaction scheme used in synthesis of crosslinked polyurea gels, showing (A) the polyurea oligomer, and (B) the polyurea network structure. | ||
:
1.05 (n + 1), where n was 3, 5, or 7; at higher values of n, the materials did not form gels. The polyurea networks were obtained by crosslinking the resultant oligomers with TAB in a 3
:
2 molar ratio. The crosslink density of the polyurea network was varied by changing the value of n. As an example, the preparation procedure for a gel containing oligomer with n = 5 and ODA as the diamine is presented here. Three separate solutions were prepared by dissolving ODA (0.7449 g, 3.7 mmol) in 5 mL anhydrous NMP, MDI (1.1365 g, 4.5 mmol) in 10.5 mL anhydrous NMP, and TAB (0.1728 g, 0.44 mmol) in 2 mL anhydrous NMP. The MDI solution was combined with the ODA solution and mixed for five minutes after which the TAB solution was added to the mixture. The solution turned from colorless to translucent dull yellow and then to translucent amber brown after the addition of TAB.
This solution was poured into cylindrical molds and covered with parafilm to prevent solvent evaporation. Gelation occurred in 15 minutes for this formulation but the gels were aged at room temperature for a period of 24 hours. Afterwards, NMP in the gel pores was exchanged in two 12 hour intervals with acetone by soaking the wet gel first in a mixture of 25
:
75 v/v acetone and NMP and then in 75
:
25 v/v acetone and NMP. This was followed by four washes with acetone to ensure complete exchange of NMP with acetone. The acetone-filled gels were placed in a 1 L supercritical fluid extractor autoclave and rinsed with liquid CO2 for four 2 hour rinse cycles. The autoclave was then heated to 35 °C and 9 MPa pressure to take the conditions above the supercritical point of CO2. Gaseous CO2 was slowly vented from the chamber at a rate of 4.5 m3 h−1. The aerogels recovered from the autoclave were outgassed at room temperature under vacuum for 24 hours. Five batches of each formulation were synthesized with two cylindrical monoliths in each batch, totaling ten different specimens for each formulation.
![]() | (1) |
![]() | (2) |
![]() | (3) |
In eqn (1)–(3), h corresponds to the height of the aerogel specimen and m refers to the mass of the aerogel specimen.
Attenuated total reflectance (ATR, Nicolet Nexus 470 FT-IR) infrared spectroscopy was used to investigate the nature of hydrogen bonding within the aerogel networks. The curve-fitting program Fityk was used to deconvolute the carbonyl peaks and to determine the percent of hydrogen bonded carbonyl peaks. A scanning electron microscope (SEM, Hitachi S-4700) with an operating voltage of 5 kV was used to obtain the cross-sectional images of aerogel specimens. Aerogel samples were cooled in liquid nitrogen for 15 minutes and then fractured to examine the microstructure of the break planes. The fractured specimens were sputter coated with silver before imaging. The thermal transition of aerogel specimens was investigated by differential scanning calorimetry (DSC, TA Q1000, TA instrument, New Castle, DE) at a ramp rate of 5 °C min−1. The thermal degradation behavior under air at a ramp rate of 10 °C min−1 was studied using thermal gravimetric analysis (TGA, TA 2950 HiRes). Pore size distribution and surface area (σ) were determined from nitrogen adsorption–desorption isotherms at 77 K using the Brunauer–Emmett–Teller (BET) method. The aerogel pore size distribution was obtained using the Barrett–Joyner–Halenda (BJH) method. Both methods were used in conjunction with the nitrogen adsorption–desorption data obtained from Tristar II (Micromeritics Instrument Corp., Norcross, GA) surface area analyzer.
The compressive mechanical properties of the aerogel specimens were evaluated at room temperature using cylindrical monoliths. A crosshead speed of 1.27 mm min−1 up to 80% strain was used in accordance with ASTM D695 testing method with tensile testing machine, Instron 5567. Aerogel specimens with diameter to height ratio of 1
:
1.5 were used to safeguard against any buckling. A centerless grinder was used to ensure uniform aerogel specimen diameter (∼15 mm). Monoliths were polished at both ends to establish complete contact with the compression platens. Five samples of each aerogel specimen were tested to obtain the average values of compressive properties. Young's modulus was calculated from the slope of the initial elastic deformation exhibited by the aerogel specimens.
:
75 v/v acetone and NMP mixture. This swelling persisted during the first two solvent exchange steps with mixed solvents of acetone (minor) and NMP (major). The gels underwent shrinkage and turned from amber brown color in NMP to an opaque white or dull brown color after NMP was fully exchanged with acetone.
The color of the gels depended on the value of crosslink density. Gels with ODA and n = 3 were dull brown while the ones with n = 7 were white. On the other hand, gels with DMBZ and n = 3 were a mauve color while the ones with n = 7 were white. The gels of DMBZ with n = 7 warped during the solvent exchange step. The aerogels after supercritical drying were found to be robust with no flaking or dusting observed. The aerogel specimens were outgassed at room temperature in vacuum oven to remove trace amounts of acetone present in the aerogel pores.
The extent of hydrogen bonding formed by the urea carbonyls were analyzed and correlated with the value of shrinkage of the aerogel specimens. A set of FTIR spectra of the aerogels is presented in Fig. 2(a). It is apparent from the absence of –NCO peaks at 2270 cm−1 that complete conversion of the isocyanates took place. The nature of hydrogen bonding in polyurea systems was analyzed by other researchers and appropriate bands for amine and carbonyl groups were assigned.31–33 In this work, the C
O stretching bands between 1630 cm−1 and 1700 cm−1 in Fig. 2(b) and the N–H stretching peak between 3260 cm−1 and 3450 cm−1 in Fig. 2(c) were considered for analysis. For this purpose, the peak for free non-H-bonded carbonyl between 1690 cm−1 and 1700 cm−1, disordered H-bonded carbonyl peak between 1650 cm−1 and 1670 cm−1, and an ordered H-bond carbonyl peak between 1630 cm−1 and 1645 cm−1 (ref. 31–33) were monitored by deconvoluting the original carbonyl peaks of the spectra. The peak location and the percent area of each peak are listed in Table 1. It is seen that the percent of hydrogen-bonded carbonyl groups in ODA-containing aerogels show strong dependence on the value of n, e.g., ∼64% for n = 3, ∼76% for n = 5, and ∼85% for n = 7. DMBZ-containing aerogels show little variation in hydrogen bonding index as the value of n increases. The difference can be interpreted based on the relative stiffness of the diamine species. ODA is less bulky with its centric oxygen and is much more flexible than DMBZ. This possibly allows for greater segmental motion and greater possibility for organization. At higher values of n, i.e., with lower crosslink density such segmental motion promotes hydrogen bonding.
![]() | ||
| Fig. 2 Infrared spectra of representative aerogel formulations. (a) Stacked spectra from 800 to 3500 cm−1 (b) carbonyl spectra from 1600 to 1700 cm−1 (c) NH-spectra from 3200 to 3500 cm−1. | ||
| n = 3 ODA | n = 5 ODA | n = 7 ODA | n = 3 DMBZ | n = 5 DMBZ | n = 7 DMBZ | ||
|---|---|---|---|---|---|---|---|
| Free carbonyl | Peak (cm−1) | 1698 | 1698 | 1697 | 1697 | 1697 | 1697 |
| Area (%) | 35.7 | 24.1 | 15.1 | 35.2 | 37.2 | 36.4 | |
| Hydrogen-bonded carbonyl (disordered) | Peak (cm−1) | 1658 | 1655 | 1654 | 1658 | 1658 | 1659 |
| Area (%) | 53.4 | 70.4 | 67.5 | 64.8 | 62.8 | 63.6 | |
| Hydrogen-bonded carbonyl (ordered) | Peak (cm−1) | 1644 | 1645 | 1643 | — | — | — |
| Area (%) | 10.9 | 5.48 | 17.4 | — | — | — | |
| Total hydrogen-bonded urea | Area (%) | 64.3 | 75.9 | 84.9 | 64.8 | 62.8 | 63.6 |
The stretching peaks of N–H urea linkage in Fig. 2(c) can be divided into three categories – (i) non-hydrogen bonded or free between 3445 cm−1 and 3450 cm−1, (ii) N–H to N–H hydrogen bonded between 3315 cm−1 and 3340 cm−1, and (iii) N–H to ether oxygen hydrogen bonds between 3260 cm−1 and 3290 cm−1,31–33 in addition to the bonding with carbonyls already discussed. It is apparent that the areas under the curve of ODA-containing aerogel peaks shown in Fig. 2(c) increases with n and that N–H to N–H bonding was prevalent in all aerogel specimens. The peaks for ODA-containing aerogels show a strong shift towards the amine-to-ether hydrogen bonds, especially at high n. Note that the longer chain segments between crosslinks further facilitate hydrogen bonding.
We now turn to the properties of aerogel specimens, presented in Table 2. We noted earlier that the aerogel specimens swelled when pushed out of the mold and subsequently shrank during solvent exchange from NMP to 100% acetone. Moderate shrinkage also occurred in supercritical drying step. The data in Table 2 show that diameter shrinkage for ODA-containing aerogels varied from ∼21% for n = 3 to ∼14% for n = 7, while for DMBZ-containing aerogels, the diameter shrinkage did not depend on the value of n and maintained a value of ∼22%. The shrinkage values also show correlation with the bulk density values, e.g., at lower crosslink density, the bulk density for ODA-containing aerogels is lower when the diameter shrinkage was also lower. In ODA-containing aerogels, the higher extent of the hydrogen bonding may be the primary factor to cause a reduction of the shrinkage.
| Sample name | Diameter shrinkage, δd (%) | Bulk density, ρba (g cm−3) | Skeletal density, ρsa (g cm−3) | BET surface area, σb (m2 g−1) | Average pore diameterb (nm) | Porosity, Π (%) | Free carbonyls (%) |
|---|---|---|---|---|---|---|---|
| a Ten samples from five separate batches used.b Three samples used.c | |||||||
| n = 3 ODA | 21.2 ± 0.3 | 0.247 ± 0.003 | 1.3117 ± 0.0022 | 264 ± 1 | 15.9 ± 2.0 | 81.2 | 35.7 |
| n = 5 ODA | 16.8 ± 2.5 | 0.203 ± 0.019 | 1.3364 ± 0.0009 | 257 ± 4 | 14.7 ± 1.1 | 84.8 | 24.1 |
| n = 7 ODA | 13.8 ± 2.3 | 0.188 ± 0.015 | 1.3478 ± 0.0010 | 234 ± 5 | 10.7 ± 0.4 | 86.0 | 15.1 |
| n = 3 DMBZ | 21.3 ± 0.3 | 0.241 ± 0.028 | 1.2687 ± 0.0020 | 309 ± 18 | 11.3 ± 0.9 | 81.0 | 35.2 |
| n = 5 DMBZ | 22.9 ± 2.7 | 0.258 ± 0.013 | 1.2326 ± 0.0004 | 292 ± 5 | 9.4 ± 0.3 | 79.1 | 37.2 |
| n = 7 DMBZ | 22.1 ± 1.8 | 0.238 ± 0.015 | 1.1304 ± 0.0090 | 106 ± 2 | 10.4 ± 2.1 | 78.9 | 36.4 |
The values of diameter shrinkage and bulk density have weak dependence on the values of n for DMBZ-containing aerogels. This trend is also corroborated by the weak dependence of hydrogen bonding index on n. The skeletal density of aerogel specimens produced with ODA shows strong dependence on the value of n and the extent of hydrogen-bonded carbonyl groups. In this context, note that as n increases, the ability of the polymer chains to organize and to form hydrogen bonds with one another increases. This causes denser packing of the polymer chains within the solid networks. For instance, ODA-containing aerogels with n = 3 have 36% free carbonyls with skeletal density ∼1.31 g cm−3 while the free carbonyl fraction becomes smaller at n = 7, e.g., ∼15% free carbonyls, leading to an increase of skeletal density to ∼1.35 g cm−3. On the other hand, the skeletal density decreased with an increase of n for aerogel specimens produced with DMBZ, e.g., 1.27 g cm−3 for n = 3, 1.23 g cm−3 for n = 5, and 1.13 g cm−3 for n = 7. This can be attributed to two separate phenomena. First, one may consider that the polymer chains of the gels containing DMBZ are stiffer and bulkier due to the larger size and higher stiffness of the DMBZ molecule compared to the ODA molecule. These factors should hinder the organization of the DMBZ segments into hydrogen-bonded domains. Second, the DMBZ diamine lacks the ether site that appears to be useful for ODA-containing aerogels in forming additional hydrogen bonds (Table 1). Accordingly, the stiffer and bulkier DMBZ domains do not allow the polymer chains to pack well within the solid networks, leading to a reduction of the skeletal density.
The values of porosity reported in Table 2 were obtained directly from the values of bulk and skeletal density. The porosity of ODA-containing aerogels shows an increase with n as the bulk density decreased and the skeletal density increased at higher values of n, e.g., from ∼81% for n = 3 to ∼86% for n = 7. The bulk density was weakly dependent on n and the skeletal density reduced with an increase of n for aerogels with DMBZ. Hence, for DMBZ-containing aerogels, the porosity decreased with n.
The polyurea aerogels studied in this work look different as is apparent from the images presented in Fig. 3. For example, aerogel films (∼1 mm think) with n = 3 synthesized from DMBZ show good translucency (Fig. 3(a)). Disc samples ∼5 mm thick were also fabricated. The thicker sample of DMBZ with n = 3 in particular displayed some iridescence and glossy surface appearance (Fig. 3(b)). DMBZ-containing aerogels retain their luster for aerogels with n = 5 (Fig. 3(d)). Aerogel discs synthesized with n = 5 from ODA appear white and pearly (Fig. 3(c)). An examination of the microstructure by SEM at the surfaces of these aerogel specimens (Fig. 4) revealed that the aerogel surfaces were much less porous than the bulk. Accordingly, the polymer strands at the surfaces aligned in the circumferential direction of the cylindrical specimens. Fig. 4 shows representative images and compares the core and the surface texture and the morphology of the aerogels at 5000 magnification. Fig. 4(a) presents an image of the glossy surface finish of the aerogels obtained with n = 5 and DMBZ. In addition, the aerogel with n = 5 and ODA has matte surface finish.
The DMBZ-containing aerogels appeared iridescent due to a 2–300 nm thick region of highly-organized compacted polymer strands at and near the surfaces. Such anisotropy is not seen in the core of the aerogel, as shown in Fig. 4(b). The aerogel of ODA, on the other hand, shows little surface gloss (Fig. 4(d)), contained random strand orientation at or near the surfaces (Fig. 4(f)), and showed an isotropic core (Fig. 4(e)).
The detailed microstructures of the isotropic core of these aerogel specimens are presented in Fig. 5. One can categorize these images to have two unique building blocks – fibrils and spheres. The images corresponding to aerogels of ODA (Fig. 5(a)–(c)) show fibrillar networks with fiber diameter ranging from 25 to 75 nm similar to what was reported for polyimide14,15 or polystyrene aerogels.17,18,34 The images of DMBZ-containing aerogels in Fig. 5(d) and (f) clearly show the abundance of spheres, while the image in Fig. 5(e) is more fibrillar and the image in Fig. 5(f) contains both fibrils and spheres. Pekala and Schaefer35 observed polymer network formation by reaction-induced phase separation during gelation of resorcinol–formaldehyde as a function of catalyst concentration. These authors reported formation of polymer domains as spherical aggregates via nucleation and growth mechanism at lower catalyst concentration. The regime changed to fibrillar networks via spinodal decomposition at higher catalyst concentration. In reference to work of Pekala and Schaefer35 and the images presented in Fig. 5, we infer that spinodal decomposition quite possibly occurred during gelation of DMBZ-containing aerogels while nucleation and growth played a significant role in polymer network formation in ODA-containing aerogels. In particular, Fig. 5(e) presents evidence that spinodal decomposition possibly occurred in tandem with nucleation and growth in determining the structure of ODA-containing aerogels. Gu et al.36 recently documented the role of solvents on polybenzoxazine aerogel morphology produced from the systems with the same solid content at the same reaction temperature. Specifically, these authors observed cylindrical strands and spherical building blocks respectively for N-methylpyrrolidone and dimethlysulfoxide as the solvent. A detailed analysis of the temporal structure evolution and the specific individual contributions of the nucleation and growth and the spinodal decomposition on solid network growth during gelation is beyond the scope of this work and will be addressed in a future study.
![]() | ||
Fig. 5 SEM images of polyurea aerogel specimens taken at 50 000 magnification. (a) n = 3 ODA, (b) n = 5 ODA, (c) n = 7 ODA, (d) n = 3 DMBZ, (e) n = 5 DMBZ, and (f) n = 7 DMBZ. | ||
An examination of the SEM images in Fig. 5 also reveals that the aerogels containing ODA show open pore structures with the polymer fibrils of diameter 75–125 nm while those containing DMBZ tend to have smaller pores with hierarchical structures and smaller fiber diameters of 10–75 nm. Past studies on polyurea aerogels microstructures indicate bead-like, coiled networks between 50 and 100 nm (ref. 29) or irregularly shaped clusters.30 In addition, these prior works reported macroporosity in polyurea aerogels29,30 and attributed it to the evolution of carbon dioxide produced from the hydrolysis of isocyanate groups trapped inside the networks at the time of gelation. The aerogel skeletal structures seen in Fig. 5 appear to have little macroporosity and instead appear to contain many pores in the mesoporous size range. The different microstructures presented in Fig. 5 should also result in differences in pore size distribution and surface area and will be discussed below.
The BET surface area of ODA- and DMBZ-derived aerogels are presented in Fig. 6. A strong correlation is apparent between the values of n and the surface area of DMBZ-derived aerogels. The surface area is reduced at higher values of n. In the case of ODA-derived aerogels, however, the effect of BET surface area on the value of n is smaller. We note here for ODA-containing aerogels that the polymer chains were more tightly packed at higher values of n, leading also to higher skeletal density. This may have reduced the solid network surface area somewhat leading to a reduction of BET surface area. The same argument cannot be invoked for DMBZ-containing aerogels. For example, both hydrogen bonding index and BET surface area decreased with an increase of the value of n. In this case, the microstructure transitioned from completely spherical to fibrils as n was increased. This may explain a reduction in surface area.
The BET isotherms shown in Fig. 7 correspond to type IV curves of IUPAC classification37 for mesoporous materials. These isotherms reached saturation at P/Po = 1. The pore size distributions were obtained following the BJH method. It is apparent from the inset in Fig. 7 that the aerogels of ODA had bimodal distribution of pores with a small peak between 3 and 4 nm in diameter, and large broad peak between 10 and 50 nm in diameter. The pore size distributions of aerogels of DMBZ, however, show one peak. The peak height decreases and shifts to the right, e.g., 14.7 nm for n = 3 to 27.6 nm for n = 7, at higher values of n. The peak height for DMBZ-derived aerogel with n = 3 was the largest with a single sharp distribution between 8 and 30 nm. The abundance of such small size pores in the aerogel of DMBZ with n = 3 possibly led to its good contact translucency.
![]() | ||
| Fig. 7 Nitrogen adsorption–desorption isotherms of the aerogels. Pore size distributions are presented in the inset. | ||
Fig. 8 shows the results of TGA scans of aerogel specimens. Two significant weight loss events are observed in Fig. 8 apart from the small weight loss incurred due to loss of moisture. The first significant weight loss, about 35 wt% of the initial weight, occurred at around 300 °C. A small weight loss also occurred from 430 °C to 510 °C, followed by another large weight loss event occurring at >550 °C. The chain residue in all cases is insignificant. The IR spectra of the gases produced from the degradation process were taken at two-minute intervals. The first gas from the weight loss event generated broad bands at 2360 cm−1 and 2330 cm−1 along with a sharp band at 668 cm−1, indicating evolution of CO2. The gas evolved from the second weight loss event revealed the evolution of CO2 and water as evident from the –OH bands at 930 cm−1, 965 cm−1, and 3010 cm−1. This coincides with the loss of urea segments, and agrees well with what was reported in literature.38 The trend in Fig. 8 shows that the crosslink density of DMBZ-containing aerogels did not influence the polyurea weight loss amounts.
We now analyze how the compressive properties were influenced by the crosslink density and the molecular structure of diamines. Such data are presented in Table 3. The compressive stress–strain curves are presented in Fig. 9. It is seen that all aerogel specimens underwent brief elastic deformation followed by yielding due to collapse of the pores. Once the pores collapsed, the stress grew rapidly with strain until the specimens reached a strain of 70%. The values of stress at 70% strain are listed in Table 3. The aerogel specimens with higher crosslink density, i.e., smaller values of n, show higher stress than those with lower crosslink density values for a given strain, e.g., 33.3 MPa for n = 3 DMBZ and 30.8 MPa for n = 3 ODA versus 22.0 MPa for n = 7 DMBZ and 7.7 MPa for n = 7 ODA. It is seen from the data in Table 3 that DMBZ-containing aerogels offered higher compressive stress than ODA-containing aerogels. Even when densities are similar, e.g., for n = 3, the bulk density in Table 2 were close, the DMBZ-containing aerogels showed a slightly higher stress at 70% strain. It was already noted that the inclusion of stiffer DMBZ molecules would make the solid network stiffer. For example, the modulus values of DMBZ-derived aerogels are 69.4 MPa at n = 3 and 38.5 MPa at n = 7 versus 48.2 MPa at n = 3 and 11.7 MPa at n = 7 for ODA-derived aerogels. We note here that modulus is influenced by a multitude of factors, including the stiffness of the moieties and bulk density. This dependence is unsurprising and agrees with previously reported data on polyimide aerogels derived from the same set of aromatic diamines.14 Meador et al.16 reported for polyimide aerogels higher modulus and higher bulk density at lower cross-link density, i.e., for higher values of n. The values of Young's modulus vary with bulk density as E ∼ ρbα with a power law exponent between 3 and 4.39–41 The aerogels of ODA in this work were found to follow a power law exponent of α = 5.11 and an R2 correlation of 0.9965. This relationship is plotted in Fig. 10. While this exponent may seem high, similar exponents were obtained by Gross and co-workers41 who determined the power law exponent for RF aerogels to be 4.8. These researchers claimed that the small range of density and increased connectivity of the RF aerogels in that density range may have led to an increase in the exponent. This was confirmed when researchers applied the power law relationship over a broader range of densities and found that in localized density regions the power law index can vary, proving the power law approximation to be more complex than previously thought. It can, therefore, be reasonably assumed that the overall power law exponent may decrease when data sets cover broader range of densities. We note here that the aerogels of DMBZ do not follow a power law correlation. This can be attributed to the very small range of density considered.
| Formulation | Stress at 75% straina (MPa) | Young's modulusa (MPa) | Yield stressa (MPa) |
|---|---|---|---|
| a Five samples tested. | |||
| n = 3 ODA | 30.8 ± 1.2 | 48.2 ± 2.1 | 3.21 ± 0.14 |
| n = 5 ODA | 19.9 ± 0.9 | 18.8 ± 3.0 | 1.27 ± 0.27 |
| n = 7 ODA | 7.7 ± 2.6 | 11.7 ± 4.5 | 1.23 ± 0.30 |
| n = 3 DMBZ | 33.3 ± 1.1 | 69.4 ± 2.0 | 5.55 ± 0.18 |
| n = 5 DMBZ | 25.3 ± 3.0 | 42.9 ± 3.4 | 3.21 ± 0.14 |
| n = 7 DMBZ | 22.0 ± 3.7 | 38.5 ± 3.1 | 3.46 ± 0.32 |
![]() | ||
| Fig. 10 Young's modulus of polyurea aerogels as a function of density. The trendline refers to aerogels of ODA. | ||
We now reflect on the role of hydrogen bonding on Young's modulus values. Although ODA-containing aerogels had more abundant hydrogen bonding, its Young's modulus values were not affected by this, especially at higher values of n. The value of yield stress represents a stress at which the aerogel material remains elastic and permanent deformation occurs only above this stress. The values of yield stress are also higher for DMBZ-containing aerogels (3.46–5.55 MPa) compared to ODA-containing aerogels (1.23–3.21 MPa). We once again invoke the higher stiffness of DMBZ molecules and higher density of the aerogel networks compared to ODA-containing aerogels to interpret such trends.
We note that Young's moduli of the polyurea aerogels vary from 69.4 MPa (ρb = 0.241 g cm−3) to 11.7 MPa (ρb = 0.188 g cm−3) in this study. Previous research on polyurea aerogels reported compressive moduli of 33 MPa at similar bulk density (ρb = 0.19 g cm−3).30 For reference, the value of Young's modulus for polyimide aerogels ranges from 0.9 to 102 MPa (ρb = 0.07–0.23 g cm−3) to ∼36.2 MPa (ρb = 0.190–0.23 g cm−3) respectively with non-fluorinated15 and fluorinated42 monomers.
| This journal is © The Royal Society of Chemistry 2015 |