Photochemical upconversion in metal-based octaethyl porphyrin–diphenylanthracene systems

Yaroslav V. Aulin , Martijn van Sebille, Michiel Moes and Ferdinand C. Grozema*
Optoelectronic Materials Section, Department of Chemical Engineering, Faculty of Applied Sciences, Delft University of Technology, Julianalaan 136, 2628BL Delft, The Netherlands. E-mail: f.c.grozema@tudelft.nl; Fax: +31 0 15 2787421; Tel: +31 0 15 2783914

Received 5th October 2015 , Accepted 1st December 2015

First published on 7th December 2015


Abstract

This paper studies photochemical upconversion in solutions of octaethyl porphyrin (OEP) and diphenyl anthracene (DPA). The system has been widely used as a standard model system in the field of photochemical upconversion. Although, the kinetics of elementary processes contributing to photochemical upconversion in it have been extensively studied, there has been no research on the efficiency of upconversion in the system, despite of the fact that this parameter is detrimental for potential applications of photochemical upconversion process. We determine the yield of photochemical upconversion in a number of metal based OEP/DPA systems. Additionally, we studied the dependence of kinetic, and efficiency parameters of the process on the core metal of the porphyrin. We showed that the overall efficiency of photochemical upconversion depends significantly on the core metal of the triplet sensitizer porphyrin molecule. We attribute this effect to the differences in efficiency of triplet energy transfer from metal based OEP to DPA depending on the core metal.

1 Introduction

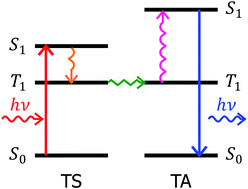
Photochemical upconversion1,2 is a process by which photons of low energy are converted to photons of higher energy by means of sensitized triplet–triplet annihilation.1,3,4 In order for photochemical upconversion process to occur, two types of molecules are required: (i) a triplet sensitizer (TS), and (ii) a triplet acceptor. The function of the triplet sensitizer is to absorb low energy photons and to create triplet excitons. Upon initial absorption of a photon by the triplet sensitizer it undergoes rapid intersystem crossing to create a triplet exciton.5 When the triplet sensitizer molecule in the excited triplet state encounters a triplet acceptor molecule in the ground state, the energy is transferred to the triplet acceptor molecule6 by Dexter energy transfer.7 When two triplet excited acceptor molecules collide, triplet–triplet annihilation occurs8,9 resulting in the creation of the lowest singlet excited state of the triplet acceptor. This singlet state rapidly decays to the ground state by emission of a photon. The combination of all the elementary processes described above is called photochemical upconversion.1 The Jablonski diagram for photochemical upconversion is presented in Fig. 1.
image file: c5ra20602b-f1.tif
Fig. 1 Jablonski diagram of photochemical upconversion process. Upon initial excitation of triple sensitizer (TS), singlet state S1 of a triplet sensitizer is created.

Typically, photochemical upconversion experiments are performed on samples in solution,1 however there are recent reports on upconversion in nano particles10,11 and in solid state samples.12–14 Photochemical upconversion can, in principle, improve the efficiency of solar cells by upconverting the low energy part of the solar spectrum that is normally not absorbed.15

In this work, photochemical upconversion has been studied in a number of triplet sensitizer–triplet acceptor mixtures.16,17 The kinetics of the upconversion process18 has been extensively studied as a function the concentrations of the components and the excitation intensity. The time resolved spectroscopy data are in good agreement with the theory based on rate equations. The most important factor for potential applications in the field of photovoltaics, i.e. the quantum yield of upconversion has been largely omitted in previous work, and there are only a few publications where it is reported. For example Cheng et al.19 showed in their experiments, that in the system of rubrene and palladium porphyrin, the quantum yield of photochemical upconversion is higher than the theoretical spin statistics limit for triplet–triplet annihilation process. This result is quite promising for potential photovoltaic applications, and is also extremely interesting from a fundamental point of view.

The system of a metal-based octaethyl porphyrin (OEP) and 9,10-diphenylanthracene has become a standard combination20–22 to probe the outcomes of kinetic theory of photochemical upconversion and study excitation intensity dependence, or dependence on concentration. Numerous publications have been devoted to these topics, for example in PtOEP/DPA, PdOEP/DPA,23 however there is no single report were the overall quantum yield of the process has been determined. In this work we attempt to fill this gap and to study quantum yield of photochemical upconversion in metal-based OEP/DPA mixtures, as well as to investigate the dependence of the upconversion efficiency on the porphyrin core metal.

2 Materials

In the photochemical upconversion experiments, 9,10-diphenylanthracene was used as triplet acceptor, octaethyl porphyrins were used as triplet sensitizers (PtOEP-platinum octaethylporphyrin, PdOEP-palladium octaethylporphyrin, ZnOEP-zinc octethylporphyrin, and fbOEP-free base octaethyl porphyrin).

The materials were purchased from Sigma Aldrich and used without any further purification. Spectroscopic grade chlorobenzene from Sigma Aldrich was used as a solvent. Molecular structures of the materials are provided in Fig. 2.


image file: c5ra20602b-f2.tif
Fig. 2 Molecular structures of compounds used, left to right, top to bottom: PtOEP-platinum octaethyl porphyrin, PdOEP-palladium octaethyl porphyrin, ZnOEP-zinc octaethylporphyrin, fbOEP-free base octaethyl porphyrin, DPA-di-phenyl anthracene.

3 Experimental

All experiments that are described were performed in chlorobenzene solution. The concentration of triplet sensitizer was 10−5 M while the concentration of the triplet acceptor was 10−3 M. Steady state absorption spectra were recorded using a Perkin Elmer Lambda 400 absorption spectrometer. The solution was placed in a custom designed vacuum tight quartz cell closed with a stopcock. At least 5 freeze–pump–thaw cycles were performed to degas the solutions and to prevent quenching of triplets by molecular oxygen.17,24 Steady state emission spectra were measured using a Quanta Master PTI Felix absorption spectrometer, exciting the sample at 400 nm. Time resolved emission and transient absorption spectra were acquired using an Edinburgh Instruments LP 920 transient absorption spectrophotometer with CW probe light produced by a Xe lamp. The samples were excited by ns laser pulses produced by Ekspla NT 342B OPO pumped by a Q-switched Nd:YAG laser.

4 Results and discussions

4.1 Steady state absorption and emission of components

Absorption and emission spectra of DPA are provided in Fig. 3(a). DPA is strongly fluorescent with a fluorescence quantum yield equal to 95%.25 The luminescence lifetime in chlorobenzene solution was found to be approximately equal to 10 ns,26 following single exponential decay kinetics as shown in Fig. 3(b).
image file: c5ra20602b-f3.tif
Fig. 3 Absorption and emission properties of donor and acceptor molecules for upconversion. DPA in chlorobenzene, concentration 10−6 M, absorption and emission spectra (a) and luminescence decay profile (b) with fluorescence lifetime of 10 ns, excitation at 400 nm. Absorption and emission spectra of octaethylporphyrins in chlorobenzene (c), concentration Jablonski 10−5 M excitation in the maxima of Q-band absorption: 535 nm for PtOEP, 540 nm for PdOEP, 570 nm for ZnOEP, 620 nm for fbOEP.

The absorption and emission spectra of octaethyl porphyrins27 are provided in Fig. 3(c). The absorption spectra for all compounds contain a pronounced Soret absorption band around 400 nm, and multiple less intense Q-band with the maximum in the range of 500–600 nm. The maxima of the Q-band absorption bands27,28 for the different porphyrins are as follows: PtOEP: 535 nm, PdOEP: 540 nm, ZnOEP: 570 nm, fbOEP: 500 nm, 530 nm, 570 nm, and 620 nm. As can be seen from Fig. 3(c) the metal containing porphyrins typically exhibit two absorption peaks in the Q-band region, corresponding to vibrational sublevels of the doubly degenerate lowest excited singlet state S1. For the free-base porphyrins, typically four maxima are observed in the Q-band range since in this case the two lowest excited states are non-degenerate and for each of these, two vibrational sub-levels are observed.

Upon excitation in the Soret or Q-band, emission was observed at longer wavelengths with the maxima of emission spectra as follows: 650 nm for PtOEP, 670 nm for PdOEP, 570 nm for ZnOEP, and 630 nm from fbOEP. For ZnOEP and fbOEP, the shift between the lowest energy vibronic band in the absorption spectrum and the highest energy vibronic band in the emission spectrum is very small and hence the emission is mainly attributed to fluorescence. For PtOEP and PdOEP the Stokes shift is larger than 100 nm and the emission is attributed mainly to phosphorescence.28

Since donor and acceptor molecules do not aggregate in the mixed solution, the absorption spectrum of a solution is the sum of absorption spectra of the individual components. However, as will be shown below, due to energy transfer and other processes in solution this statement does not hold for the emission spectra.

4.2 Upconverted emission from mixtures

Photochemical upconversion was obtained in degassed mixtures of metal-based octaethyl porphyrins with diphenyl anthracene and was absent for mixtures containing free base porphyrins as triplet sensitizers. Upon excitation in the Q-band of the porphyrins, an excited singlet state is formed, which rapidly converts to triplets by intersystem crossing. The time scale of intersystem crossing is faster than the time resolution of the transient absorption setup used, which is around 10 ns. Therefore, only triplet states of the porphyrins were observed for the neat porphyrin solutions.

Photoluminescence spectra at different time delays upon excitation for neat porphyrin solution of PtOEP and for the two-component mixture with DPA are provided in Fig. 4(a) and (b) respectively.


image file: c5ra20602b-f4.tif
Fig. 4 Photoluminescence spectra of freeze–pump–thaw degassed neat PtOEP solution (a) and in mixture with DPA (b) at various delays upon excitation by the 10 ns laser pulse at 535 nm. Concentration of PtOEP 10−5 M, concentration of DPA 10−4 M, excitation density corresponds to the concentration of initially excited porphyrin molecules equal to 4 × 10⁻⁶ M.

The samples were excited at the maximum of the absorption of the Q-band of porphyrin28 in solution at 535 nm. The neat porphyrin sample exhibited long-lived phosphorescence from the triplet state with a lifetime of the order of 100 μs, with a maximum around 650 nm. In the mixture, the emission in this band was substantially quenched and was observed on a time scale of a few microseconds. Strong emission in the 400–500 nm wavelength range was detected. The emission spectrum coincides with the emission spectrum of DPA from steady state experiments shown in Fig. 3(a).

In case of a neat porphyrin sample the initially excited singlet state S1 undergoes rapid conversion to the triplet T1 which is phosphorescent:

 
S0 + → S1 → T1′ + S0, (1)

In the case of mixture, the triplet state that is formed upon intersystem crossing is transfered to the DPA acceptor by Dexter energy transfer:

 
S0 + → S1 → T1(donor) → T1(acceptor) (2)

Upon annihilation of two DPA triplets, a radiative DPA singlet state is created:

 
T1 + T1 → S1′′ + S0. (3)

This is followed by emission from DPA after initial excitation of the porphyrins in the mixture. In the emission map for the PtOEP[thin space (1/6-em)]:[thin space (1/6-em)]DPA mixture in Fig. 5(a) it is clearly seen that emission from DPA does not rise instantaneously since energy transfer and triplet–triplet annihilation processes take some time to happen.


image file: c5ra20602b-f5.tif
Fig. 5 Typical kinetics of photoluminescence in OEP–DPA mixture: (a) emission map from PtOEP[thin space (1/6-em)]:[thin space (1/6-em)]DPA mixture solution in chlorobenzene, concentrations of the components: PtOEP 10−5 M, DPA 10−4 M, excitation at 535 nm, (b) kinetics of populations of PtOEP triplet state (black), and DPA singlet state-the photoluminescence decay profiles for DPA and PtOEP were obtained in the spectral regions of 420–475 nm and 630–660 nm respectively, (c) kinetics of DPA luminescence in the wavelength range of 420–475 nm, for the mixtures producing upconversion, PtOEP[thin space (1/6-em)]:[thin space (1/6-em)]DPA, PdOEP[thin space (1/6-em)]:[thin space (1/6-em)]DPA, ZnOEP[thin space (1/6-em)]:[thin space (1/6-em)]DPA, excitation in the maximum of Q-band of the porphyrin, PtOEP[thin space (1/6-em)]:[thin space (1/6-em)]DPA at 535 nm, PdOEP[thin space (1/6-em)]:[thin space (1/6-em)]DPA at 540 nm, ZnOEP[thin space (1/6-em)]:[thin space (1/6-em)]DPA at 570 nm.

The emission from DPA rises on microsecond time scale and is present for hundreds of microseconds. The kinetics of emission are diffusion limited and determined by how fast the molecules encounter a collision allowing the elementary process in photochemical upconversion to occur. This diffusion limited process is dependent on the concentrations and diffusion coefficients of the two components. Two time scales can be separated: (i) a fast time scale (several microseconds) where triplet energy transfer from triplet sensitizer to the triplet acceptor occurs, leading to quenching of the emission of the donor, and a rise of emission of the acceptor, (ii) a long time scale (tens-hundreds of microseconds) where the excited states are mostly triplets of the acceptor of which the population declines by triplet–triplet annihilation,29 leading to upconverted emission. Fig. 5(a) and (b) show photoluminescence data on a fast time scale from the mixture excited in the Q-band of the porphyrin. As it can be clearly seen, the emission band from the porphyrin at 650 nm appears immediately upon excitation and disappears within 1 μs, while the emission band from DPA at 400–470 nm is initially absent and rises within 1 μs, maintaining relatively constant intensity for at least 10 μs after that.

Upconverted emission has been observed for the mixtures of all the metal based octaethyl porphyrins considered in this work, however it was absent for the mixtures with free base porphyrin as triplet sensitizer. The normalized emission decay profiles of DPA in mixtures upon excitation at the maximum of the porphyrin Q-band are provided in Fig. 5(c).

Mixtures containing free base octaethyl porphyrins did not show any signs of energy transfer from fbOEP to DPA, nor quenching of fbOEP triplets. This absence of energy transfer can be understood since it is well known that the triplet energy level in the free base porphyrin is typically 0.2 eV lower than in metal-based porphyrins.30 The same trend is reflected in the lowest singlet levels as seen in Fig. 3, the lowest Q-bands for the free base porphyrin appear at longer wavelengths than for the metal-based porphyrins.

The rise time of the emission from DPA and the lifetime of triplets in the mixture are of the order of several microseconds. The quenching and energy transfer kinetics are largely intensity independent, since are determined by the local concentration of DPA molecules in the ground state in the vicinity of the initially excited porphyrin molecule. At the same time, the kinetics on a long time scale strongly depend on the excitation intensity, since this process is governed by the second order annihilation process of two DPA triplets. Fig. 5(b) shows the time profiles of the quenched emission of the donor and the rise time of acceptor emission in the PtOEP[thin space (1/6-em)]:[thin space (1/6-em)]DPA mixture. Similar kinetics was observed for the mixtures of PdOEP and ZnOEP, the kinetic profiles could be found in ESI.

4.3 Transient absorption

Transient absorption experiments allow to probe excited state species directly. Whereas photoluminescence only allows to probe the populations of radiative species, transient absorption technique gives information on both: radiative and non-radiative species, in our case singlet and triplet excitons respectively.

Typical results of transient absorption experiments for neat porphyrin solutions and mixtures with DPA are shown in Fig. 6(a) and (b).


image file: c5ra20602b-f6.tif
Fig. 6 Typical transient absorption maps for neat PtOEP sample (a), and PtOEP[thin space (1/6-em)]:[thin space (1/6-em)]DPA mixture on long (b) and short time scale (c). Concentration of PtOEP 10−5 M, concentration of DPA 10−4 M, excitation performed by 10 ns laser pulses at 530 nm. The data from neat PtOEP sample (a) shows photoinduced absorption of PtOEP triplets (420–500 nm and 550–700 nm) and long lifetime ground state bleach in the Q-band spectral region (500–550 nm). The mixture (b) shows photoinduced absorption of DPA and PtOEP triplets (420–500 nm) and short lifetime ground state bleach of PtOEP Q-band (500–550 nm) due to energy transfer to DPA. (c) shows the same data as (b) on the time scale of quenched PtOEP triplet lifetime in mixture.

Experiments for the neat samples of PtOEP reveal a strong triplet–triplet absorption band in the 400–490 nm range,31 a weaker triplet–triplet absorption band at 550–700 nm, and a negative feature at 500–550 nm corresponding to the bleach of Q-band of the porphyrins.

The data for the mixture on the long time scale differs somewhat from that of the neat solution, especially at longer times. For the neat solution a maximum in the induced absorption is observed at 430 nm, which gradually decays while the shape of the feature stays the same. The induced absorption for the mixture is initially very similar but at longer times develops into a different shape with a maximum around 450 nm.

The band at 525–545 nm corresponds to the Q-band bleach of the porphyrins, the band at 440–490 nm is the combination of the signals from PtOEP and DPA triplets. The triplets of the porphyrin molecule can be monitored selectively by looking at the ground state bleach of the Q-band, while the triplets of the DPA molecule in mixture can not be probed selectively and the signal of the porphyrin triplets has to be subtracted in order to obtain DPA triplet population kinetics.

The spectral data of the transient absorption experiments for the mixture consist of the sum of two signals originating from the triplets of PtOEP on a fast time scale, and triplets of DPA on the longer time scale. Immediately upon excitation (on the time scale faster than 1 s) the signal is dominated by the triplets of porphyrins and has a similar shape as for the neat porphyrin solution (compare the spectrum at 1 μs from Fig. 7(a) to the spectra in Fig. 7(b)). Within several microseconds triplet energy transfer from the porphyrins to DPA occurs. An indication of this is complete absence of the Q band bleach of porphyrins as well as of the weak triplet–triplet absorption of the porphyrin between 500 and 700 nm. The absorption band at 400–500 nm is present, however it has a different shape and is attributed to triplet–triplet absorption band of DPA. As it can be seen, the triplet–triplet absorption band of DPA largely overlaps with the triplet–triplet absorption band of the porphyrins. This makes selective probing of the DPA triplet state impossible. At the same time, the triplets of the porphyrins in the mixture can be probed selectively in the range of 500–550 nm where the signal from Q-band bleach appears, or at the triplet–triplet absorption band in the range of 550–700 nm.


image file: c5ra20602b-f7.tif
Fig. 7 Transient absorption spectra for neat PtOEP (a), and for PtOEP[thin space (1/6-em)]:[thin space (1/6-em)]DPA mixture (b) solutions in chlorobenzene. Concentration of PtOEP 10−5 M, concentration of DPA 10−4 M, excitation in Q-band of PtOEP at 530 nm. Negative feature at 500–530 nm-the bleach of Q-band of PtOEP, 550–700 nm-triplet–triplet absorption of PtOEP, 400–500 nm-overlaping bands of triplet–triplet absorption of DPA and PtOEP. Due to energy transfer from PtOEP to DPA, the lifetimes of PtOEP triplet–triplet absorption and PtOEP Q-band bleach are significantly shorter in mixture compared to neat PtOEP solution.

Similar spectra and type of kinetics were observed for the other metal based porphyrins. The spectra for the mixtures of DPA with PtOEP and PdOEP are provided in ESI. In contrast to the mixtures of DPA with metal based porphyrins, the mixture of DPA with free base porphyrin showed no upconverted emission when excited in the Q-band. At the same time, long lived triplet states of the free base porphyrin were present in both the neat solution and the mixture, transient absorption spectra are provided in Fig. 8(a) and (b). As can be clearly seen, the shapes of the spectra as well as the kinetics are identical in both cases. This indicates the absence of triplet energy transfer to triplet acceptor from free base porphyrins. This can be explained by lower energy of the triplet state for free base porphyrin compared to metal based porphyrin.


image file: c5ra20602b-f8.tif
Fig. 8 Transient absorption spectra for neat fbOEP (a), and for fbOEP[thin space (1/6-em)]:[thin space (1/6-em)]DPA mixture (b) solutions in chlorobenzene. Concentration of fbOEP 10−5 M, concentration of DPA 10−4 M, excitation in Q-band of fbOEP at 500 nm. Negative features at 490-650 nm-the bleach of Q-band of fbOEP, positive features at 420–490 nm and 500–700 nm are due to triplet–triplet absorption of fbOEP triplets. The spectra and kinetics are identical for neat solution and in mixture due to absence of energy transfer to DPA.

Transient absorption spectra of the mixtures of PdOEP and ZnOEP are provided in ESI and exhibit similar behavior as the one of PtOEP.

4.4 Triplet energy transfer

Triplet energy transfer32 can be studied by exploring the kinetics of the Q-band bleach. As can be seen, there is almost perfect quenching of porphyrin triplets for metal based porphyrins on a microscecond time scale, whereas the triplets of free base porphyrins are not quenched by DPA. This is illustrated in Fig. 9(a) for PtOEP and in Fig. 9(b) for fbOEP.
image file: c5ra20602b-f9.tif
Fig. 9 Normalized kinetics of Q-band ground state bleach in neat porphyrin solution (red) and in mixture (black) for PtOEP[thin space (1/6-em)]:[thin space (1/6-em)]DPA system (a) and fbOEP[thin space (1/6-em)]:[thin space (1/6-em)]DPA system (b), excitation at 530 nm for PtOEP and at 490 nm for fbOEP. The lifetime of PtOEP is significantly quenched in PtOEP[thin space (1/6-em)]:[thin space (1/6-em)]DPA mixture compared to neat PtOEP sample due to rapid and efficient triplet energy transfer to DPA. No quenching is observed for fbOEP[thin space (1/6-em)]:[thin space (1/6-em)]DPA compared to neat fbOEP solution indicating the absence or extremely inefficient energy transfer from fbOEP to DPA. Concentration of DPA 10−4 M, concentration of porphyrins 10−5 M, solvent: chlorobenzene.

The behavior of Pd and Zn based porphyrins is very similar to PtOEP, the data on kinetics of PdOEP and ZnOEP triplets in the neat solution and in the mixture with DPA can be found in ESI. This means that energy transfer from porphyrin to DPA occurs in all the porphyrins used, except for fbOEP, despite of high triplet yield in fbOEP.33,34 A plausible explanation of this effect is the lower lying triplet level of fbOEP which makes energy transfer from fbOEP triplet to DPA triplet level impossible.

4.5 Intensity dependence and quantum yield

Excitation intensity dependent experiments showed linear dependence of the upconverted emission intensity on excitation intensity in the high excitation intensity mode. The experimental data are provided in Fig. 10(a) with the lines indicating the best linear fit. The excitation intensity is represented as a function of the concentration of initially excited molecules. This approach allows for more direct comparison of experimental data for different mixtures due to differences in the absorption of the samples at the excitation wavelength. The quantum yield of upconversion can be determined using the neat DPA solution as a reference sample. A detailed description of the method is provided in ESI. As can be seen from Fig. 10(a), upconversion is absent for the mixture with free base porphyrins at all concentrations. All the mixtures of the metal porphyrins exhibit two modes: (i) a saturation mode at high concentration of initially excited states, and (ii) a non-saturated mode at low excitation intensities when the quantum yield is rising with excitation intensity.
image file: c5ra20602b-f10.tif
Fig. 10 Excitation intensity dependence of upconverted emission intensity (a), and excitation intensity dependence of upconversion quantum yield (b) for degassed OEP[thin space (1/6-em)]:[thin space (1/6-em)]DPA mixtures with different porphyrins (PtOEP, PdOEP, ZnOEP, fbOEP) with the concentration of porphyrins 10−5 M, concentration of DPA 10−4 M, chlorobenzene used as a solvent excitation with 10 ns laser pulse in the maximum of Q-band absorption: 535 nm for PtOEP, 540 nm for PdOEP, 570 nm for ZnOEP, 620 nm for fbOEP. The method of upconversion quantum yield determination is described in details in ESI.

The experimental dependence of the quantum yield of upconversion on excitation intensity can be understood if we consider the quantum yield as the product of the yields of contributing processes. These processes are intersystem crossing (ISC)35 of triplet sensitizer, triplet energy transfer (TET) from triplet sensitizer to triplet acceptor, triplet–triplet annihilation (TTA) between triplet acceptor molecules, and fluorescence of triplet acceptor singlet state (FL). Out of all the processes mentioned above the only process that is dependent on the concentration of excited states is triplet–triplet annihilation of triplet acceptor triplets.36 At high excitation densities, the concentration of the sensitized triplets of the triplet acceptor molecules is also high and all the molecules annihilate efficiently within their lifetime, while at low concentrations there is a substantial fraction of molecules that are not able to encounter a collision with another excited counterpart within their lifetime. This leads to the presence of two modes37,38 of upconversion dependent on the excitation density: (i) growth of upconversion yield at low excitation intensities, and (ii) the saturation mode at high excitation intensities. Another interesting observation is the difference in upconversion quantum yields in saturation mode for mixtures with different triplet sensitizers. The overall upconversion yield is as high as 30% for the mixture of DPA with PtOEP, slightly lower (around 25%) for PdOEP, significantly lower (around 12%) for ZnOEP and is equal to zero for the free base porphyrin. The replacement of triplet sensitizer affects only two processes that are involved in upconversion: ISC and TET. ISC occurs within the TS molecule, while TET occurs between the TS and TA molecules. The other processes (TTA and FL) only involve TA molecules. This allows us to conclude that the difference in upconversion yields between mixtures in saturation mode is determined by the product of the yields of ISC of the porphyrin and TET from the porphyrin to DPA. However, we can clearly pinpoint the difference to the TET process, due to the fact that even freebase porphyrin has about 80% triplet yield (ref needed), which is clearly seen in from our experiments as well, where long lived triplet population of fbOEP is detected in fbOEP[thin space (1/6-em)]:[thin space (1/6-em)]DPA mixture, meaning that TET from fbOEP to DPA is completely absent. By the same reasoning we can also conclude that the more than twofold difference between PtOEP and ZnOEP can not be solely explained by lower ISC yield in Zn based porphyrin compared to Pt based one.

5 Conclusions

We have shown that photochemical upconversion is quite efficient in degassed mixtures of metal based octaethyl porphyrins and diphenylanthracene with different maximal efficiencies dependent on the core metal ion in a triplet sensitizer. The upconversion is highly efficient for mixtures containing platinum and palladium based porphyrins, less efficient for zinc based porphyrin and practically absent for free base porphyrin. This difference is determined by different efficiencies of triplet energy transfer from metal based porphyrin to diphenylanthracene: highly efficient for Pt and Pd-based porphyrins, with lower efficiency for Zn-based porphyrin, and zero efficiency for freebase porphyrin. Further research on the origin of this phenomenon is required to elucidate whether it is due to energetics of the triplet state of the porphyrins or due to the presence of additional decay processes of the encounter complex that are competing with the energy transfer, for instance charge transfer.

Acknowledgements

The research leading to these results has received funding from the European Research Council under the European Union's Seventh Frame-work Programme (FP/2007–2013)/ERC Grant Agreement no. 240299 and 648433.

References

  1. T. N. Singh-Rachford and F. N. Castellano, Coord. Chem. Rev., 2010, 254, 2560–2573 CrossRef CAS.
  2. T. F. Schulze and T. W. Schmidt, Energy Environ. Sci., 2015, 8, 103–125 CAS.
  3. F. Deng, A. Francis, W. W. Weare and F. N. Castellano, Photochem. Photobiol. Sci., 2015, 14, 1265–1270 CAS.
  4. S. Baluschev, T. Miteva, V. Yakutkin, G. Nelles, A. Yasuda and G. Wegner, Phys. Rev. Lett., 2006, 97, 143903 CrossRef CAS PubMed.
  5. M. Penconi, F. Ortica, F. Elisei and P. L. Gentili, J. Lumin., 2013, 135, 265–270 CrossRef CAS.
  6. S. Baluschev, V. Yakutkin, T. Miteva, Y. Avlasevich, S. Chernov, S. Aleshchenkov, G. Nelles, A. Cheprakov, A. Yasuda and K. Müllen, et al., Angew. Chem., Int. Ed., 2007, 46, 7693–7696 CrossRef CAS PubMed.
  7. D. L. Dexter, J. Chem. Phys., 1953, 21, 836–850 CrossRef CAS.
  8. A. Suna, Phys. Rev. B: Condens. Matter Mater. Phys., 1970, 1, 1716 CrossRef.
  9. R. Kepler, V. Valencia, S. Jacobs and J. McNamara, Synth. Met., 1996, 78, 227–230 CrossRef CAS.
  10. K. Katta, D. Busko, Y. Avlasevich, R. Muñoz-Espí, S. Baluschev and K. Landfester, Macromol. Rapid Commun., 2015, 36, 1083 CrossRef.
  11. J. Rieffel, F. Chen, J. Kim, G. Chen, W. Shao, S. Shao, U. Chitgupi, R. Hernandez, S. A. Graves and R. J. Nickles, et al., Adv. Mater., 2015, 27, 1785–1790 CrossRef CAS PubMed.
  12. K. Sripathy, R. W. MacQueen, J. R. Peterson, Y. Y. Cheng, M. Dvořák, D. R. McCamey, N. D. Treat, N. Stingelin and T. W. Schmidt, J. Mater. Chem. C, 2015, 3, 616–622 RSC.
  13. R. Vadrucci, C. Weder and Y. C. Simon, J. Mater. Chem. C, 2014, 2, 2837–2841 RSC.
  14. P. B. Merkel and J. P. Dinnocenzo, J. Lumin., 2009, 129, 303–306 CrossRef CAS.
  15. Y. Y. Cheng, B. Fückel, R. W. MacQueen, T. Khoury, R. G. Clady, T. F. Schulze, N. Ekins-Daukes, M. J. Crossley, B. Stannowski and K. Lips, et al., Energy Environ. Sci., 2012, 5, 6953–6959 CAS.
  16. T. N. Singh-Rachford and F. N. Castellano, J. Phys. Chem. A, 2009, 113, 5912–5917 CrossRef CAS PubMed.
  17. B. Fuckel, D. A. Roberts, Y. Y. Cheng, R. G. Clady, R. B. Piper, N. Ekins-Daukes, M. J. Crossley and T. W. Schmidt, J. Phys. Chem. Lett., 2011, 2, 966–971 CrossRef CAS.
  18. T. W. Schmidt and F. N. Castellano, J. Phys. Chem. Lett., 2014, 5, 4062–4072 CrossRef CAS PubMed.
  19. Y. Y. Cheng, B. Fuckel, T. Khoury, R. G. Clady, M. J. Tayebjee, N. Ekins-Daukes, M. J. Crossley and T. W. Schmidt, J. Phys. Chem. Lett., 2010, 1, 1795–1799 CrossRef CAS.
  20. A. Monguzzi, R. Tubino and F. Meinardi, Phys. Rev. B: Condens. Matter Mater. Phys., 2008, 77, 155122 CrossRef.
  21. S. Baluschev, V. Yakutkin, G. Wegner, B. Minch, T. Miteva, G. Nelles and A. Yasuda, J. Appl. Phys., 2007, 101, 023101 CrossRef.
  22. V. Gray, D. Dzebo, A. Lundin, J. P. Alborzpour, M. Abrahamsson, B. Albinsson and K. Moth-Poulsen, J. Mater. Chem. C, 2015, 3, 11111 RSC.
  23. R. S. Khnayzer, J. Blumhoff, J. A. Harrington, A. Haefele, F. Deng and F. N. Castellano, Chem. Commun., 2011, 48, 209–211 RSC.
  24. A. U. Khan, J. Phys. Chem., 1976, 80, 2219–2228 CrossRef CAS.
  25. J. V. Morris, M. A. Mahaney and J. R. Huber, J. Phys. Chem., 1976, 80, 969–974 CrossRef CAS.
  26. U. Noomnarm and R. M. Clegg, Photosynth. Res., 2009, 101, 181–194 CrossRef CAS PubMed.
  27. A.-K. Bansal, W. Holzer, A. Penzkofer and T. Tsuboi, Chem. Phys., 2006, 330, 118–129 CrossRef CAS.
  28. M. Gouterman, J. Mol. Spectrosc., 1961, 6, 138–163 CrossRef CAS.
  29. J. Partee, E. Frankevich, B. Uhlhorn, J. Shinar, Y. Ding and T. Barton, Phys. Rev. Lett., 1999, 82, 3673 CrossRef CAS.
  30. K. Kalyanasundaram and M. Neumann-Spallart, J. Phys. Chem., 1982, 86, 5163–5169 CrossRef CAS.
  31. M. Gouterman, J. Chem. Phys., 1960, 33, 1523–1529 CrossRef CAS.
  32. P. J. Wagner and I. Kochevar, J. Am. Chem. Soc., 1968, 90, 2232–2238 CrossRef CAS.
  33. F. Kampas, K. Yamashita and J. Fajer, Nature, 1980, 284, 40–42 CrossRef CAS.
  34. H. N. Fonda, J. V. Gilbert, R. A. Cormier, J. R. Sprague, K. Kamioka and J. S. Connolly, J. Phys. Chem., 1993, 97, 7024–7033 CrossRef CAS.
  35. D. Eastwood and M. Gouterman, J. Mol. Spectrosc., 1970, 35, 359–375 CrossRef CAS.
  36. Y. Y. Cheng, T. Khoury, R. G. Clady, M. J. Tayebjee, N. Ekins-Daukes, M. J. Crossley and T. W. Schmidt, Phys. Chem. Chem. Phys., 2010, 12, 66–71 RSC.
  37. A. Monguzzi, J. Mezyk, F. Scotognella, R. Tubino and F. Meinardi, Phys. Rev. B: Condens. Matter Mater. Phys., 2008, 78, 195112 CrossRef.
  38. T. N. Singh-Rachford, R. R. Islangulov and F. N. Castellano, J. Phys. Chem. A, 2008, 112, 3906–3910 CrossRef CAS PubMed.

Footnotes

Electronic supplementary information (ESI) available. See DOI: 10.1039/c5ra20602b
Present address: Department of Chemistry, Temple University, 1901 North 13th Street, Philadelphia, Pennsylvania 19122, USA.

This journal is © The Royal Society of Chemistry 2015
Click here to see how this site uses Cookies. View our privacy policy here.