Alginate surfactant derivatives as an ecofriendly corrosion inhibitor for carbon steel in acidic environments

Salah M. Tawfik*
Egyptian Petroleum Research Institute, Nasr City, Cairo, Egypt. E-mail: salahtwfk85@yahoo.com; Tel: +20-1273615278

Received 1st October 2015 , Accepted 19th November 2015

First published on 23rd November 2015


Abstract

Biopolymer alginate surfactant derivatives were synthesized and their influences as a novel corrosion inhibitor on carbon steel in 1 M HCl were studied using gravimetric, electrochemical, EDX and SEM techniques. The compounds obtained were characterized using FTIR, 1H NMR and UV-vis spectroscopy studies. The inhibition efficiency increased with the increase in concentration and reached a maximum of 96.27% for AS–Cu at 5 × 10⁻³ M concentration. Potentiodynamic polarization results reveal that alginate derivatives could be classified as mixed-type corrosion inhibitors with predominant control of the cathodic reaction. The extent of inhibition exhibits a positive trend with an increase in temperature. The Langmuir isotherm provides the best description of the adsorption nature of the inhibitor. The results of EIS indicate that both the charge transfer resistance and inhibition efficiency tend to increase by increasing the inhibitor concentration. The thermodynamic parameter and activation parameters were calculated to investigate the mechanism of inhibition. Also, the relationship between the chemical structure and inhibition efficiency of the inhibitor was discussed.

1. Introduction

Carbon steel is a common constructional material for many industrial units because of its low cost and excellent mechanical properties. However, it suffers severe damage while in use, particularly in oil and gas production systems. The use of commercial hydrochloric and sulphuric acids leads to destructive effects on the metal surface during industrial cleaning processes such as: acid pickling, acid descaling, and oil-well acid in oil recovery, and in petrochemical processes. In oil fields, hydrochloric acid solution was recommended as the cheapest way to dissolve calcium carbonate, CaCO3, scale inside the pipelines under most conditions.1,2 Organic inhibitors get adsorbed easily on the metal surface by donating the lone pair of electrons on nitrogen, oxygen and sulphur to the vacant orbitals on the metal atoms. Electrons and long side chains in the inhibitor molecule also enhance adsorption on the metal surface.3 Polymers are the more preferred choice for inhibition, as they provide effective blanketing on the surface of the metal with a high chelating ability and large molecular size.4 Over the past few years, there has been a considerable intolerance towards the usage of molecules, inorganic salts and synthetic polymer inhibitors due to their toxic nature. Obviously, there is a paradigm to switch over to ecofriendly inhibitors. A great number of green inhibitors like plant extracts, vegetable oils, fruit juices, waste materials, etc. have been identified so far.5–13 Among the various green inhibitors, biopolymers are more preferred due to their excellent inhibiting properties with multiple adsorption sites such as lignin,14 polycaffeic acid,15 polyaspartic acid,16 hydroxyl propyl cellulose,17 and carboxy methyl cellulose.18 Plant extracts, drugs, amino acids, medicinal products, and natural polymers have been advocated by various researchers.19–27 Interest in natural polymers is principally due to its biodegradability and ecofriendliness in addition to the inherent stability and multiple adsorption centers. A number of naturally occurring polymers have been investigated and have been reported to show promising results as metal corrosion inhibitors in different corrosive environments. For instance the corrosion inhibiting effect of chitosan has been reported for mild steel and copper in acidic medium.28–31 Glucose, gellan gum, and hydroxyl propyl cellulose have been assessed as green inhibitors for cast iron in acidic environments by means of chemical and electrochemical techniques.32 Gum arabic has also been reported to be a promising corrosion inhibitor for aluminium and steel in different corrosive environments.33 Modified cassava starch has also been evaluated as a corrosion inhibitor of carbon steel under alkaline conditions in 200 mg L−1 NaCl solutions.34

Alginate is a linear polysaccharide present in the cell walls of the fronds of various seaweeds, including the giant brown kelp (Macrocystis pyrifera), horsetail kelp (Laminaria digitalis), and sugar kelp (L. saccharina). It consists of 1,4-β-D-mannuronic and 1,4-L-guluronic acid residues. It is regarded as biocompatible, non-toxic, non-immunogenic and biodegradable which makes it widely usable for industrial applications. Recently, alginate has been chemically modified to increase its hydrophobicity. Alginate has a number of free hydroxyl and carboxyl groups distributed along the backbone, therefore it is an ideal candidate for chemical functionalization.35 Several researchers deal with the synthesis and investigation of different kinds of surfactants as corrosion inhibitors in acidic medium.36–43 However, there is no published report on the corrosion inhibition effect of alginate surfactant derivatives for low carbon steel in HCl solution and electrochemical investigations highlighting the influence of alginate surfactant on the kinetics of the anodic and cathodic partial reactions of the corrosion process. Therefore, the present study was undertaken to assess the corrosion inhibition effect of alginate surfactant ant its metal complexes for carbon steel in 1 M HCl solution using chemical and electrochemical techniques. The associated activation energy of corrosion and other thermodynamic parameters such as enthalpy, entropy of activation, the adsorption–desorption equilibrium constant, standard free energy of adsorption, heat, and entropy of adsorption were calculated to elaborate the corrosion inhibition mechanism.

2. Experimental method

2.1. Materials

The corrosion measurements were performed on low carbon steel samples with the following composition (wt%): 11% C, 0.45% Mn, 0.04% P, 0.05% S, and 0.25% Si, and the reminder is Fe. Mild steel coupons of 3.5 × 1.5 × 0.04 cm dimensions were used for the weight loss study. For the electrochemical studies, the specimens were covered with an epoxy resin leaving an exposed surface area of 1 cm2 in aqueous solution. The specimens used for the analysis were polished with a series of emery paper (320–1200), washed with double-distilled water, degreased with acetone and dried at room temperature.

A commercially available alginic acid sodium salt, of low viscosity, derived from Macrocystis pyrifera was purchased from Sigma Chemical Co. This had a peak relative molecular mass (RMM) of 344[thin space (1/6-em)]000, as determined by gel permeation chromatography (GPC). 2-(dimethylamino)ethanol (99%), 1-bromododecane (97%), cobalt chloride anhydrous (97%), copper chloride anhydrous (97%) and zinc chloride anhydrous (97%) of analytical grade were obtained from Aldrich Chemical Company (Germany). All the reagents were analytical grade and used as received. Organic solvents were purchased from a commercial supplier and used without further purification.

2.2. Solutions

The corrosive solution was a 1.0 M hydrochloric acid solution diluted from concentrated acid (37%, Merck) with double-distilled water. This solution was used as the blank. The concentration range of the synthesized inhibitor used varied from 5 × 10⁻⁵ to 5 × 10⁻³ M for corrosion measurements. All tests were performed in non-deaerated solutions under unstirred conditions at 25, 45 and 60 °C.

2.3. Synthesis of inhibitors

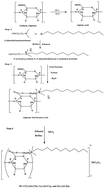
2.3.1. Synthesis of N-(2-hydroxyethyl)-N,N-dimethyldodecan-1-aminium bromide cationic surfactant. Cationic surfactants were obtained by direct reaction between equimolar amounts of 1-bromododecane (0.1 mol) and 2-(dimethylamino)ethanol (0.1 mol) in 50 ml ethanol. The reaction mixture was refluxed for 8 h and left overnight for complete precipitation of the cationic surfactant. The products were filtered off and recrystallized three times from ethanol to produce the desired N-(2-hydroxyethyl)-N,N-dimethyldodecan-1-aminium bromide cationic surfactant (Step 2)43 (Fig. 1).
image file: c5ra20340f-f1.tif
Fig. 1 The chemical structure of the synthesized alginate cationic surfactant and its metal complexes.
2.3.2. Synthesis of alginate derived cationic surfactant. N-(2-Hydroxyethyl)-N,N-dimethyldodecan-1-aminium bromide (0.1 mol) and alginic acid produced from the hydrolysis of sodium alginate using hydrochloric acid (Step 1) (0.1 mol) were esterified individually in xylene (50 ml) as the solvent under reflux conditions at 138 °C and 0.01% p-toluene sulphonic acid as the dehydrating agent, until the a zeotropic amount of water (0.1 mol, 1.8 ml) was removed. Then the solvent was removed using a vacuum rotary evaporator. The p-toluene sulphonic acid was extracted from the reaction medium using petroleum ether. Subsequent purification was done by means of vacuum distillation to remove the excess and residual materials.44 The product obtained was designated as AS in Step 3 (Fig. 1).
2.3.3. Synthesis of alginate derived cationic surfactant and its metal complexes. To a solution of the synthesized alginate derived cationic surfactant (AS) (0.01 mol) in ethanol (100 ml), a metal ion solution of anhydrous CoCl2, CuCl2 and ZnCl2 (0.005 mol) in ethanol (50 ml) was added separately and refluxed for 6 h. The reaction mixture was left overnight to complete the precipitation of the products. The products were filtered off and recrystallized twice from ethanol to obtain the crystalline products of the desired alginate surfactant metal complexes (AS–Co, AS–Cu and AS–Zn) in Step 445,46 (Fig. 1).

2.4. Methods

2.4.1. FTIR studies. Fourier transform infrared (FTIR) spectra were recorded for the synthesized inhibitors on an ATI Mattson Infinity Series™, Bench top 961 controlled by win first TM V2.01 software (Egyptian Petroleum Research Institute “EPRI”) at 25 °C. About 2 mg of sample with 100 mg of KBr was fully ground and mixed. The mixed samples were pressed into pills with a compressor and the prepared pellets were used for studies. All spectra were scanned against a blank KBr pellet background in the range of 4000–400 cm−1 with a resolution of 4.0 cm−1.
2.4.2. 1H NMR studies. The 1H NMR was measured in DMSO-d6 by a Spect Varian, GEMINI 200 (1H 200 MHz) (Micro-analytical Center, Cairo University). The synthesized inhibitors were dissolved in DMSO-d6 solvent.
2.4.3. UV-vis studies. UV-vis spectra of the synthesized inhibitors were measured at 200–800 nm using a 3–5 mm quartz cuvette using a UV-Vis Shimadzu, UV-2550, Japan. For the analysis, 5 ml of 2 mM aqueous solution of the synthesized alginate surfactant and its metal(II) complexes were put in a cuvette for measurement. All the measurements were carried out at room temperature.
2.4.4. Electrochemical methods. Electrochemical measurements were carried out using a Voltalab 40 Potentiostat PGZ 301 and a personal computer was used with Voltamaster 4 software at 25 °C and a frequency response analyzer in a three-electrode arrangement. Carbon steel was taken as the working electrode, platinum as the counter electrode and a saturated calomel electrode as the reference electrode. The working electrode was held in the electrolyte solution for 60 min before each measurement to attain a steady-state potential. For polarization studies, the potential was swept from the cathodic direction to the anodic direction with respect to the open circuit potential (−1000 mV to +100 mV) at a scan rate of 1 mV s−1. The point of intersection of the extrapolated Tafel lines gives the value of corrosion current density Icorr and corrosion potential Ecorr. The inhibition efficiency is calculated using the corrosion current density values in the absence and presence of various concentrations of the inhibitor. The electrochemical impedance spectroscopy (EIS) measurements were performed in the frequency range 100 kHz to 30 mHz, using AC signals of amplitude of 5 mV peak to peak. All the impedance values were measured at the open circuit potential. A Nyquist plot represents the results from the EIS measurements. The charge transfer resistance (Rct) and the capacitance of double layer (Cdl) were calculated from the Nyquist plot.47
2.4.5. Gravimetric method. Pre-cleaned carbon steel samples in triplicate were weighed and immersed for 24 h in 100 ml of 1 M HCl without and with different concentrations of inhibitor. Experiments were performed in aerated conditions at the temperatures 25, 45 and 60 °C and were left unstirred. After immersion, the steel specimens were washed with double-distilled water, dried and weighed again. The average weight loss is calculated. The inhibition efficiency is calculated for the synthesized inhibitors at each concentration.48
2.4.6. Energy dispersive analysis of X-rays (EDAX). An EDX system attached with a Joel 5400 scanning electron microscope was used for elemental analysis or chemical characterization of the film formed on the steel surface. As a type of spectroscopy, it relies on the investigation of a sample through interaction between electromagnetic radiation and the matter, so a detector was used to convert the X-ray energy into voltage signals. This information is sent to a pulse processor, which measures the signals.
2.4.7. Scanning electron microscopy (SEM). The CS specimens of size 7 cm × 3 cm × 0.5 cm were abraded with emery paper (grade 320–400–600–800–1000–1200) and given a mirror surface, then washed with distilled water and acetone. After immersion in 1 M HCl without and with the addition of 5 × 10⁻³ M of the synthesized alginate surfactants at 25 °C for 24 h, the specimens were cleaned with distilled water, dried with a cold air blaster, and then examined with a SEM Jeol JSM-5400.

3. Results and discussion

3.1. FTIR studies

Fig. 2 shows the FTIR spectra of AS, AS–Co, AS–Cu and AS–Zn. IR spectra provide a lot of valuable information on the coordination reaction. The IR spectra provide some important information regarding the skeleton of the complexes. In order to study the binding mode of the alginate surfactant to the metal in the complexes, the IR spectrum of the free ligand (alginate surfactant) was compared with the spectra of the complexes (Fig. 2). There were some minor differences between the metal (AS–Co, AS–Cu and AS–Zn) complexes and the free ligand (AS) upon chelation as expected. The IR spectra of the complexes show a sharp band in the range 3310–3493 cm−1, attributed to ν(OH), which is shifted to a higher frequency ongoing from the free ligand (at 3300 cm−1) to the complexes. This is an indication of the coordination of the hydroxyl group to the metal. New bands of low intensity are observed in the FTIR region in the range of 689–707 cm−1 which can be assigned to ν(M–O) stretching vibrations.49 On the other hand, ν(–C–O–), which occurs at 1020 cm−1 for the ligand, was moved to higher frequencies 1048–1080 cm−1 after complexation; this shift confirms the participation of phenolic oxygen of the ligand in complex formation. The bands present in the range 2910–2930 and 2830–2860 cm−1 may be assigned to v(–C–H) stretching. The bands due to ν((CH2)n) in this ligand appear at 1450 cm−1. These remain almost unchanged in the spectra of the complexes, indicating that long alkyl chains are not participating in coordination.50 In the free ligand, the sharp band observed at 1590 cm−1 is due to v(–CO). In all complexes, this band remains quite unchanged confirming the non-involvement of the carbonyl ester in complex formation.51
image file: c5ra20340f-f2.tif
Fig. 2 FTIR spectra of the synthesized alginate derived cationic surfactant and its metal complexes.

3.2. 1H NMR studies

The 1H NMR spectra of the alginate ligand and its metal complexes were recorded to confirm the structure. The spectra of the alginate derivatives (Fig. 3a–d) show a weak singlet peak at δ = 0.88 ppm which is assigned the to –CH3 protons. This peak remains quite unchanged in the spectra of the cobalt(II), copper(II) and zinc(II) complexes (Fig. 3), confirming the non-involvement of the methyl group in complex formation. The singlet peak of –OH in the AS ligand (4.65 ppm) was shifted to higher values at 5.51, 5.05 and 5.41 ppm in the cobalt(II), copper(II) and zinc(II) complexes, respectively; this confirms the participation of the –OH group in the complexation. The higher value of the proton for the –OH group can be assigned to the presence of intermolecular hydrogen bonds. The group of peaks (m, nH, (C[H with combining low line]2)n) in the δ = 1.23–1.81 ppm range is assigned to repeated methylene groups of the long alkyl chain, at δ = 1.65–2.61, 1.89–2.85, 2.35–3.05, 2.71–3.49 and 3.45–4.01 ppm for (t, 2H, C[H with combining low line]2N+), (m, 2H, C[H with combining low line]2CH2N+), (m, 3H, CH2N+(C[H with combining low line]3)2), (t, 2H, C[H with combining low line]2N+(CH3)2), and (t, 2H, C[H with combining low line]2CH2N+(CH3)2), respectively.52
image file: c5ra20340f-f3.tif
Fig. 3 1H NMR spectra of the synthesized alginate derived cationic surfactant and its metal complexes; (a) AS, (b) AS–Co, (c) AS–Cu and (d) AS–Zn.

3.3. Ultraviolet spectroscopy studies

UV-visible absorption spectra are very sensitive to the formation of metal complexes, due to metal complexes exhibiting intense absorption peaks corresponding to the bond formation between the metal ions and the ligands. Fig. 4 represents the UV spectra of the synthesized alginate surfactant (AS) and alginate surfactant–metal complexes. The new absorption band is due to the electronic transition of d-orbitals of the different transition metal ions incorporated in the metal complexes. Further analysis of the UV spectra revealed that the new absorption bands appeared at higher wavelengths for larger diameter ions (e.g., Zn at ca. 220 nm and Cu at ca. 218 nm), while for the smaller ion, Co(II), the absorption band appeared at a lower wavelength (212 nm). That indicates that a higher energy is required for d-electron transition in the case of Co(II) ions, due to its small ionic radius. In the case of Zn(II) and Cu(II), the ionic radii are larger and the energies required for d-electron transition are less than that of Co(II). Additionally, UV absorption spectra confirmed the formation of the metal complexes of the cationic surfactants.53
image file: c5ra20340f-f4.tif
Fig. 4 UV-visible spectra of the synthesized alginate derived cationic surfactant and its metal complexes.

3.4. Potentiodynamic polarization measurements

The potentiodynamic polarization curves for carbon steel in 1.0 M HCl without and with different concentrations of alginate surfactant (AS) are shown in Fig. 5. (Polarization curves of AS–Zn, AS–Co, and AS–Cu are in the ESI.) As can be seen in the figure, both the cathodic and anodic (more pronounced for the cathodic) current densities decrease considerably on the introduction of alginate derivatives into the corrodent (1.0 M HCl). Also the corrosion potential (Ecorr) in the presence of alginate derivatives is slightly displaced towards the negative direction compared to the blank solution. The cathodic polarization curves are also observed to give rise to parallel Tafel lines indicating that there is no modification of the hydrogen evolution reaction process on the introduction of alginate derivatives into the corrosive medium.54,55 This also suggests that alginate derivatives inhibit carbon steel corrosion by simply blocking the reaction sites without affecting the actual reaction mechanism.56 Values of electrochemical parameters derived from the polarization measurements, namely the corrosion current density (Icorr), corrosion potential (Ecorr), the anodic (βa) and cathodic (βc) Tafel slopes, surface coverage and inhibition efficiency (η, %) are listed in Table 1. The inhibition efficiency (ηp, %) was obtained from the following equation:57
 
image file: c5ra20340f-t1.tif(1)
where Icorr and I0corr are the uninhibited and inhibited corrosion current densities, respectively, determined by extrapolation of the Tafel lines to the corrosion potential.

image file: c5ra20340f-f5.tif
Fig. 5 Polarization curves for carbon steel in 1 M HCl in the absence and presence of different concentrations of inhibitor (AS) at 25 °C.
Table 1 Potentiodynamic polarization parameters for corrosion of carbon steel in 1 M HCl in the absence and presence of different concentrations of the synthesized inhibitors at 25 °C
Inhibitor Conc. of inhibitor (M) Ecorr (mV (SCE)) Icorr (mA cm−2) βa (mV dec−1) βc (mV dec−1) ηp (%)
Absence 0.00 491 0.735 ± 0.0018 150 149
AS 5 × 10⁻⁵ 517 0.235 ± 0.0015 173 157 68.03
1 × 10⁻⁴ 541 0.164 ± 0.0011 246 168 77.69
5 × 10⁻⁴ 541 0.144 ± 0.0010 282 168 80.41
1 × 10⁻³ 541 0.125 ± 0.0080 226 158 82.99
5 × 10⁻³ 520 0.088 ± 0.0014 128 107 88.03
AS–Zn 5 × 10⁻⁵ 519 0.203 ± 0.0017 160 167 72.38
1 × 10⁻⁴ 518 0.155 ± 0.0090 195 164 78.91
5 × 10⁻⁴ 570 0.138 ± 0.0010 348 169 81.22
1 × 10⁻³ 562 0.118 ± 0.0012 242 157 83.95
5 × 10⁻³ 600 0.056 ± 0.0015 399 121 92.38
AS–C 5 × 10⁻⁵ 529 0.186 ± 0.0021 190 166 74.69
1 × 10⁻⁴ 542 0.141 ± 0.0018 233 161 80.82
5 × 10⁻⁴ 549 0.111 ± 0.0012 234 155 84.90
1 × 10⁻³ 577 0.094 ± 0.0019 242 185 87.21
5 × 10⁻³ 573 0.048 ± 0.0011 223 129 93.47
AS–Cu 5 × 10⁻⁵ 533 0.170 ± 0.0016 221 162 76.87
1 × 10⁻⁴ 562 0.130 ± 0.0015 280 167 82.31
5 × 10⁻⁴ 509 0.076 ± 0.0014 162 138 89.66
1 × 10⁻³ 475 0.042 ± 0.0013 115 213 94.29
5 × 10⁻³ 484 0.033 ± 0.0012 118 170 95.51


The data in Table 1 show that Icorr decreased in the presence of alginate derivatives compared to the blank solution and further decreases as the concentration of the alginate derivatives increased. This is an indication that the alginate derivatives inhibited the acid-induced corrosion of low carbon steel. Inspection of Table 1 also reveals noticeable changes in both the anodic and cathodic Tafel slopes. It is clear that the presence of the inhibitors causes a marked decrease in the corrosion rate. The increase in inhibition efficiency is associated with a shift of both the cathodic and anodic branches of the polarization curves towards lower current densities, together with a negative shift in Ecorr, suggesting that the four inhibitors act as mixed-type inhibitors with a predominantly cathodic effect; i.e. the inhibitors reduce the anodic dissolution of mild steel and retard the cathodic hydrogen evolution reaction, but the effect on the cathodic hydrogen evolution reaction surface is more than that on the anodic dissolution reaction. Also the corrosion rate is observed to decrease in the presence of alginate derivatives in comparison to in its absence indicating decreased metal dissolution, and it further decreases with an increasing concentration. As also shown in Table 1, the inhibition efficiency increased with an increase in the concentration of alginate derivatives reaching the maximum value of 95.51% at the concentration (5 × 10⁻³ M) studied.

The interaction of transition metal complexes with mild steel is greatly affected by their standard electrode potentials, their reactivity and the nature of the ligand that could stabilize the metallic complexes. The standard electrode potential of divalent cations follows the order: Cu(II)/Cu (+0.34 V) > Co(II)/Co (−0.277 V) > Fe(II)/Fe (−0.44 V) > Zn(II)/Zn (−0.76 V). Reduction of Cu(II) and Co(II) species on the mild steel surface is possible due to their higher standard electrode potential compared to that of Fe(II). However, it should be noted that charged ligands could stabilize the higher oxidation states. Hence, the reduction of Cu(II) and Co(II) on the steel surface could be affected by the ligands surrounding them. Reduction of Cu(II) on steel could occur because of the much more positive standard electrode potential of Cu(II)/Cu (+0.34 V SHE) compared to that of Fe(II)/Fe (−0.44 V SHE). Although charged ligands could stabilize the higher oxidation states, it seems that the change can not overcome the big difference between the standard electrode potentials of Fe(II)/Fe and Cu(II)/Cu. Deposition of copper on the steel surface could lead to galvanic coupling which in turn results in a decrease of the charge transfer resistance and prevents carbon steel dissolution. The inhibition efficiency of the investigated inhibitors decreased in the following order: AS–Cu > AS–Co > AS–Zn > AS.58 The uncertainties associated with the polarization experimental data for three replicate experiments are shown in Table 1.

3.5. Electrochemical impedance spectroscopy (EIS)

3.5.1. Nyquist plots. The impedance responses of low carbon steel in 1 M HCl in the absence and presence of alginate surfactant (AS) are depicted in Fig. 6. (Impedance curves of AS–Zn, AS–Co, and AS–Cu are in the ESI.) It could be observed from the Nyquist plots that the impedance responses of low carbon steel in the acidic medium changed on the addition of the inhibitor. The Nyquist plot is characterized by one semicircle capacitive loop corresponding to one time constant in the Bode plot suggesting that the corrosion of carbon steel is controlled by a charge transfer process. The diameter of the semicircles in the Nyquist plot and the magnitude of the Bode modulus are observed to increase with the increasing concentration of alginate derivatives indicating the formation of an adsorption film on the steel surface. In all cases, the Nyquist plots are not perfect semicircles but depressed with a center under the real axis. These kinds of deviations are often referred to as the frequency dispersion of interfacial impedance.59 The anomaly is usually attributed to the inhomogeneity of the electrode surface arising from surface roughness or interfacial phenomena.59 The equivalent circuit (EC) model shown in the ESI was used to model the physical processes taking place at the steel/solution interface. The EC consists of solution resistance (Rs), charge transfer resistance (Rct) and a constant phase element (CPE). The CPE is substituted for the capacitive element to give a more accurate fit as specified in the CPE impedance shown in the following equation:
 
ZCPE = Q−1()n (2)
where Q and n stand for the CPE constant and exponent respectively, j = (−1) is an imaginary number and ω is the sine wave modulation angular frequency in rad s−1 (ω = 2πf, where f is the frequency in Hz). The corresponding impedance parameters obtained are listed in Table 2. Data in the table show that alginate derivatives caused an increase in the Rct value and a corresponding decrease in Cdl. Such an increase in the Rct value, synonymous with an increase in the diameter of the semicircle in the Nyquist plot as well as the increase in the magnitude of the absolute impedance in the Bode plot, point towards improved corrosion resistance due to the corrosion inhibiting action of the alginate derivatives. Cdl was computed using the expression:60
 
image file: c5ra20340f-t2.tif(3)
where fmax is the frequency at which the imaginary component of the impedance is a maximum.

image file: c5ra20340f-f6.tif
Fig. 6 Nyquist plots for CS in 1 M HCl in the absence and presence of different concentrations of inhibitor (AS) at 25 °C.
Table 2 EIS parameters for the corrosion of carbon steel in 1 M HCl in the absence and presence of different concentrations of the synthesized inhibitors at 25 °C
Inhibitor Conc. of inhibitor (M) Rs (Ω cm2) Cdl (μF cm−2) Rct (Ω cm2) ηI (%)
Absence 0.00 92.30 3.46 27.24 ± 1.2
AS 5 × 10⁻⁵ 656.3 5.19 48.49 ± 1.2 43.82
1 × 10⁻⁴ 554.4 3.12 71.76 ± 1.0 62.04
5 × 10⁻⁴ 36.39 4.53 215.2 ± 1.1 87.34
1 × 10⁻³ 41.79 3.92 240.6 ± 0.9 88.68
5 × 10⁻³ 185.7 3.78 383.8 ± 19 92.90
AS–Zn 5 × 10⁻⁵ 67.43 3.37 66.08 ± 1.7 58.78
1 × 10⁻⁴ 60.30 4.51 166.7 ± 1.5 83.66
5 × 10⁻⁴ 54.08 5.16 185.9 ± 2.4 85.35
1 × 10⁻³ 136.4 4.52 368.5 ± 2.3 92.61
5 × 10⁻³ 96.27 1.96 462.8 ± 1.4 94.11
AS–Co 5 × 10⁻⁵ 47.67 7.48 105.4 ± 1.5 74.16
1 × 10⁻⁴ 43.46 2.52 183 ± 1.30 85.11
5 × 10⁻⁴ 56.39 8.02 252.8 ± 1.2 89.22
1 × 10⁻³ 80.60 10.22 442.2 ± 1.3 93.84
5 × 10⁻³ 61.01 12.17 584.2 ± 1.4 95.34
AS–Cu 5 × 10⁻⁵ 90.29 4.03 197.4 ± 2.9 86.20
1 × 10⁻⁴ 84.80 3.91 210.1 ±2.1 87.03
5 × 10⁻⁴ 105.10 4.45 302.8 ± 1.8 91.00
1 × 10⁻³ 8.08 73.29 542.8 ± 2.3 94.98
5 × 10⁻³ 8.61 44.18 730.3 ± 1.1 96.27


In the case of electrochemical impedance spectroscopy, the inhibition efficiency was calculated using the charge transfer resistance according to the following equation:60

 
image file: c5ra20340f-t3.tif(4)
where Rct and R°ct are the charge transfer resistance values without and with an inhibitor for carbon steel in 1 M HCl, respectively.

The observed decrease in the values of Cdl, which normally arises from a decrease in the dielectric constant and/or an increase in the double layer thickness, is as a result of adsorption of the alginate derivatives onto the metal/electrolyte interface.61

The uncertainties associated with the impedance experimental data for three replicate experiments are shown in Table 2.

3.5.2. Bode plots. For a more complicated system, Bode plots can give more information. The Bode plots of the synthesized inhibitor (AS–Cu as a representative inhibitor) are presented in Fig. 7. The low frequency impedance modulus Zmod is one of the parameters which can be easily used to compare the corrosion resistance of different samples. A larger Zmod demonstrates a better protection performance.62
image file: c5ra20340f-f7.tif
Fig. 7 Bode plots and phase angle for carbon steel in 1.0 M HCl in the absence and presence of different concentrations of the inhibitor (AS–Cu) at 25 °C.

In Fig. 7, it is shown that Zmod increases as a function of the concentration of the synthesized inhibitor (AS–Cu). These phenomena can be explained as follows: the high frequency phase angle range (105 to 104 Hz) of the impedance spectra corresponds to the properties of an outer layer, the middle frequency range (104 to 102 Hz) reflects the properties of an inner barrier layer, while the low frequency range (less than 102 Hz) corresponds to the properties of the double electrical layer information. Therefore, the high frequency phenomenon may due to the thickness increase of the outer porous layer, and the middle frequency phenomenon can be attributed to the penetration of active chloride ions and water through the defect of the prepared inhibitor inner barrier layer, though the whole effect induced the increase of Zmod.

As seen from Fig. 7, the Bode plots refer to the existence of an equivalent circuit that contains a single constant phase element in the metal/solution interface. The increase of absolute impedance at low frequencies in the Bode plot confirmed the higher protection with increasing the concentration of the prepared inhibitors, which is related to the adsorption of the inhibitors on the carbon steel surface.63

The phase angle plots for the carbon steel in the presence and absence of the synthesized inhibitors (AS–Cu as a representative inhibitor) of different concentrations in 1.0 M HCl solution are given in Fig. 7. As seen from Fig. 7, the increase of the inhibitor concentration in the test solution indicated a superior inhibitive behavior due to adsorption on the metal surface of more prepared inhibitor molecules at higher concentrations. Furthermore, the depression of the phase angle at the relaxation frequency occurs with a decrease of the inhibitor concentration which indicated the decrease of capacitive response with the decrease of inhibitor concentration. Such a phenomenon could be attributed to a higher corrosion activity at low concentrations of the inhibitor.

3.6. Weight loss measurements

3.6.1. Effect of inhibitor concentration. The corrosion rate (k) was calculated from the following equation:64
 
image file: c5ra20340f-t4.tif(5)
where ΔW is the average weight loss of three parallel carbon steel sheets, S is the total area of one specimen, and t is immersion time.

The inhibition efficiency (ηw) of the prepared cationic surfactant inhibitors on the corrosion of CS are calculated from the following equation:65

 
image file: c5ra20340f-t5.tif(6)
where Wcorr and W°corr are the weight loss of carbon steel in the absence and presence of the inhibitors, respectively.

The inhibition efficiency values of CS with different concentrations of the synthesized inhibitors in 1.0 M HCl solution at 25 °C are shown in the ESI (Fig. 8). The inhibition efficiency values increase as the concentration of the inhibitor increases, i.e. the corrosion inhibition is enhanced with the inhibitor concentration. This behavior is due to the fact that the adsorption coverage of the inhibitor on the CS surface increases with the inhibitor concentration.


image file: c5ra20340f-f8.tif
Fig. 8 Variation of the inhibition efficiency of the synthesized inhibitors (AS, AS–Zn, AS–Co and AS–Cu) as a function of time at 25 °C.
3.6.2. Effect of complexation on the inhibition efficiency. An increase of the corrosion inhibition efficiency on complexation could be due to the increase in the hydrophobicity of these complexes in comparison to the parent alginate surfactant, which is due to the presence of two ligands coordinated to the metal ion within the giant structure of the complex containing a methylene group, i.e., more non-polar chains. Then the water/surfactant molecule interactions increased, which forced them to the air/water interface.66 In fact, these results suggest that two alkyl chains in one molecule linked by a metal ion enhance the adsorption and aggregation properties, by strengthening the inter- or intramolecular hydrophobic interaction. The advantage of the metal–surfactant coordination complexes lies in the fact that the bond between the head group and the tail part of the surfactant is a coordinate bond and the surfactant contains a higher charge on the head group which leads to greater repulsion in the bulk of the aqueous solution and increased adsorption onto the carbon steel surface. The inhibition efficiency results in Table 3 reveal that the efficiency was increased by increasing the electronegativity of the transition metal. The inhibition efficiency was increased in the following sequence: Cu2+ < Co2+ < Zn2+, because the electronegativity of the transition metals are as follows: Cu2+ = 1.90, Co2+ = 1.88 and Zn2+ = 1.65. This can be explained by the electronegativity of these ions, which increases their attraction for the metal surface; hence their complexes with the ligands will be polar in nature. The polarity will increase the adsorption of these metallo compounds on the carbon steel surface and consequently increase the inhibition efficiency.58
Table 3 Weight loss data for carbon steel in 1 M HCl without and with different concentrations of the synthesized inhibitors at various temperatures
Inhibitor Conc. (M) 25 °C 45 °C 60 °C
ΔW (mg) K (mg cm−2 h−1) θ ηw (%) ΔW (mg) k (mg cm−2 h−1) θ ηw (%) ΔW (mg) K (mg cm−2 h−1) θ ηw (%)
Absence 0.00 1114 ± 1.11 1.220 1361.6 ± 1.1 1.466 3559.2 ± 1.3 3.923
AS 5 × 10⁻⁵ 479.9 ± 0.63 0.529 0.56 56.4 50.9 ± 0.77 0.426 0.60 60.4 999.9 ± 1.11 1.102 0.72 71.9
1 × 10⁻⁴ 388.6 ± 0.44 0.428 0.65 64.7 42.2 ± 0.22 0.047 0.67 67.2 961.7 ± 0.91 1.060 0.73 73.0
5 × 10⁻⁴ 307.9 ± 0.41 0.339 0.72 72.0 34.2 ± 1.10 0.038 0.73 73.4 883.0 ± 0.45 0.973 0.75 75.2
1 × 10⁻³ 300.3 ± 0.60 0.331 0.73 72.7 28.1 ± 0.55 0.031 0.78 78.1 681.6 ± 0.66 0.751 0.81 80.8
5 × 10⁻³ 187.3 ± 0.44 0.206 0.83 83.0 16.7 ± 0.33 0.018 0.87 87.0 368.0 ± 0.67 0.406 0.90 89.7
AS–Zn 5 × 10⁻⁵ 407.5 ± 0.33 0.449 0.63 63.0 43.0 ± 1.30 0.047 0.67 66.6 993.0 ± 0.91 1.095 0.72 72.1
1 × 10⁻⁴ 321.5 ± 0.25 0.354 0.71 70.8 34.6 ± 1.45 0.038 0.73 73.1 798.6 ± 1.11 0.880 0.78 77.6
5 × 10⁻⁴ 234.2 ± 1.23 0.258 0.79 78.7 24.0 ± 0.65 0.026 0.81 81.3 556.0 ± 1.21 0.613 0.84 84.4
1 × 10⁻³ 182.6 ± 0.70 0.201 0.83 83.4 20.2 ± 0.66 0.022 0.84 84.3 452.2 ± 0.50 0.498 0.87 87.3
5 × 10⁻³ 146.4 ± 0.67 0.161 0.87 86.7 14.7 ± 0.22 0.016 0.89 88.6 319.7 ± 0.71 0.352 0.91 91.0
AS–Co 5 × 10⁻⁵ 370.6 ± 0.80 0.409 0.66 66.3 40.6 ± 0.31 0.045 0.68 68.4 920.6 ± 1.66 1.015 0.74 74.1
1 × 10⁻⁴ 311.2 ± 0.82 0.343 0.72 71.7 29.2 ± 1.60 0.032 0.77 77.3 799.2 ± 0.22 0.881 0.78 77.5
5 × 10⁻⁴ 191.8 ± 0.55 0.211 0.83 82.6 19.8 ± 1.71 0.022 0.85 84.6 431.8 ± 0.21 0.476 0.88 87.9
1 × 10⁻³ 141.7 ± 1.45 0.156 0.87 87.1 14.7 ± 1.44 0.016 0.89 88.6 381.7 ± 0.55 0.421 0.89 89.3
5 × 10⁻³ 107.5 ± 1.55 0.118 0.90 90.2 11.5 ± 1.55 0.013 0.91 91.1 301.5 ± 1.81 0.332 0.92 91.5
AS–Cu 5 × 10⁻⁵ 331.0 ± 1.10 0.365 0.70 69.9 35.8 ± 1.66 0.039 0.72 72.2 731.0 ± 0.91 0.806 0.79 79.5
1 × 10⁻⁴ 296.3 ± 0.90 0.327 0.73 73.1 28.3 ± 1.10 0.031 0.78 78.0 708.3 ± 0.33 0.781 0.80 80.1
5 × 10⁻⁴ 163.4 ± 0.55 0.180 0.85 85.1 17.4 ± 0.37 0.019 0.86 86.5 447.4 ± 0.21 0.493 0.87 87.4
1 × 10⁻³ 94.0 ± 0.61 0.104 0.91 91.5 9.0 ± 0.91 0.010 0.93 93.0 194.0 ± 0.55 0.214 0.95 94.5
5 × 10⁻³ 69.5 ± 0.88 0.077 0.94 93.7 7.5 ± 0.41 0.008 0.94 94.2 139.5 ± 0.88 0.154 0.96 96.1


3.6.3. Effect of temperature. Temperature plays an important role in the progress of corrosion reactions of metal in acidic media. It is sometimes used as a gauge to determine whether an inhibitor is physically or chemically adsorbed on a metal surface to inhibit corrosion, as an increase in inhibition efficiency with an increase in temperature is often associated with chemisorption phenomenon, while the reverse signifies physisorption. To assess the effect of temperature on the corrosion and corrosion inhibition of carbon steel without and with alginate derivatives, weight loss experiments were undertaken at 25, 45 and 60 °C using different concentrations of the inhibitors. The results obtained for a 24 h immersion period are presented in Table 3 and show that the corrosion rates of carbon steel in 1 M HCl in the absence and presence of alginate derivatives decreased with an increase in temperature. Further inspection of Fig. 9 (ESI) reveals that the inhibition efficiency increased with an increase in temperature. For instance, at 25 °C, the values of inhibition efficiency obtained at 5 × 10⁻⁵ and 5 × 10⁻³ M for AS–Cu were 69.9 and 93.7% respectively. As the temperature was raised to 60 °C, the η (%) value was increased to 79.5 and 96.1% respectively. The data revealed that the inhibition efficiency increased with increasing temperature, indicating that the inhibitor was more effective at a higher temperature up to 60 °C. This could be explained by chemisorption of the adsorbed inhibitor on the carbon steel surface.
image file: c5ra20340f-f9.tif
Fig. 9 Langmuir isotherm adsorption model of an inhibitor (AS–Cu) on the carbon steel surface in 1 M HCl at different temperatures.

The uncertainties associated with the weight loss experimental data for three replicate experiments are shown in Table 3.

3.6.4. Effect of the exposure time in the corrosive media. It has been shown that the inhibiting ability of organic molecules strictly depends on exposure time in the aggressive solutions.67 To assess the retarding behavior of corrosion inhibitors on a time scale, weight loss measurements were carried out in 1 M HCl solution in the absence and in the presence of the synthesized inhibitors (AS, AS–Zn, AS–Co and AS–Cu) at 5 × 10⁻³ M for different exposure times (24, 50, 100, 200 and 300 h) at 25 °C. Inhibition efficiencies calculated from eqn (6) were plotted against immersion time as seen in Fig. 8. It is clear that the inhibition efficiencies of the different inhibitors are gradually decreased by increasing the immersion time, and the maximum inhibition efficiency values are seen after 24 h of immersion in inhibited solutions. The increase in inhibition efficiencies after 24 h for the tested inhibitors reflects their strong adsorption on the carbon steel surface, which results in a more protective layer. The high inhibition efficiency after 24 h can be attributed to the formation of a protective film, which is time-dependent, on the steel surface. It has been stated that stable, two-dimensional layers of inhibitor molecules are formed on metal surfaces after an immersion time of 24 h.

From Fig. 8 it is possible to note that the inhibition efficiency diminishes linearly up to 200 h, though after this time it remains practically constant. This is because the increase of immersion time increases the values of anodic current and cathodic current, while it decreases the surface and polarization resistances, which reflects on the increase of the corrosion rate with time; the obtained results are similar to the published data.68

3.7. Adsorption isotherm

Different adsorption isotherm models were assessed in order to determine the nature of interaction between the alginate derivatives and carbon steel surface. The value of the correlation coefficient (R2) was used to determine the best fit adsorption isotherm that best described the adsorption of alginate derivatives onto the steel surface. The best result was obtained with the Langmuir isotherm (R2 close to 1). The construction of the isotherm was made possible by the degree of surface coverage (θ) determined from the following equation:65
 
image file: c5ra20340f-t6.tif(7)
where Wcorr and W°corr are the weight loss without and with an inhibitor, respectively.

The equation that fits our results is that due to the Langmuir isotherm and is given by the general equation:69

 
image file: c5ra20340f-t7.tif(8)
where C is the inhibitor concentration, Kads is the adsorptive equilibrium constant and θ is the surface coverage.

The surface coverage (θ) was tested graphically for fitting a suitable adsorption isotherm as indicated in Fig. 9. Plotting C/θ vs. C yielded a straight line with a correlation coefficient (R2) equal to 1 as seen in Table 4. This indicates that the adsorption of these inhibitors can be fitted to a Langmuir adsorption isotherm. The strong correlation of the Langmuir adsorption isotherm may confirm the validity of this approach.

Table 4 Thermodynamic parameters of adsorption on the carbon steel surface in 1 M HCl containing different concentrations of the synthesized inhibitors
Inhibitor T (°C) Slope R2 Kads (M−1) × 103 ΔG0ads (kJ mol−1) ΔH0ads (kJ mol−1) ΔS0ads (J mol−1 K−1)
AS 25 1.131 0.9994 12.50 −33.3 3.3 111.7
45 1.074 0.9995 14.29 −35.9 112.9
60 1.001 0.9995 14.29 −37.6 112.9
AS–Zn 25 1.044 0.9999 25 −35.0 1.9 117.5
45 1.082 0.9999 25 −37.4 117.5
60 1.133 0.9999 33.33 −39.9 119.9
AS–Co 25 1.001 1 25 −35.0 5.1 117.5
45 1.020 1 33.33 −38.1 119.9
60 1.098 1 50 −41.0 123.3
AS–Cu 25 1.160 1 33.33 −35.7 3.3 119.9
45 1.050 1 50 −39.2 123.3
60 1.080 0.9999 100 −43.0 129.0


The slight deviation of the slope obtained from the Langmuir isotherm plot from unity indicates that a monolayer inhibitor film is not formed on the steel surface and there are interactions between the adsorbed inhibitor molecules (deviation from ideal Langmuir postulates). This is not surprising given the fact that alginate consists of macromolecules with multiple adsorption centers/sites that may adsorb differently on the metal surface. Such adsorbed species may interact by mutual repulsion or attraction. Similar observations have been reported in previous studies on adsorption and corrosion inhibition of chitosan, gum arabic and carboxy methyl cellulose (biopolymers) for mild steel in acidic media.24,26,32

The equilibrium constant (Kads) for the adsorption–desorption process of these compounds can be calculated from the reciprocal of the intercept. The adsorptive equilibrium constant (Kads) values are listed in Table 4. It is clear that the large values indicate a strong adsorption of the synthesized inhibitors on the surface of carbon steel in 1 M HCl at relatively higher temperatures. This may be due to the formation of coordinated bonds between the prepared cationic surfactants and the d-orbital of iron on the surface of steel. Kads values usually indicate the adsorption strength of the desorbate on the adsorbent. The relatively low value obtained at 25 °C is suggestive of weak adsorption of the inhibitor on the metal surface, hence the low inhibition efficiency at this temperature.

3.8. Thermodynamic parameters

The standard adsorption free energy (ΔG0ads) can be obtained according to the following equation:70–72
 
image file: c5ra20340f-t8.tif(9)
where R is the gas constant (8.314 J mol−1 K−1), T is the absolute temperature, and the value 55.5 is the concentration of water in the solution expressed in M.

The negative values of ΔG0ads indicate that the adsorption of the inhibitor molecule onto the steel surface is a spontaneous process. Generally values of ΔG0ads up to 20 kJ mol−1 are consistent with the electrostatic interaction between the charged molecules and the charged metal (physical adsorption) while those more negative than −40 kJ mol−1 involve sharing or transfer of electrons from the inhibitor molecules to the metal surface to form a coordinate type of bond (chemisorption).73–75 The calculated ΔG0ads values indicated that the adsorption mechanism of the prepared inhibitors on carbon steel in 1 M HCl solution is chemical adsorption.76

The adsorption heat can be calculated according to the van’t Hoff equation:77

 
image file: c5ra20340f-t9.tif(10)
where ΔH0ads and Kads are the adsorption heat and adsorptive equilibrium constant, respectively.

To obtain the standard enthalpy, plotting ln[thin space (1/6-em)]Kads vs. 1/T (Fig. 10) yields a straight line according to eqn (10) with a slope equal to −ΔH0ads/R. The ΔH0ads values were equal to 3.3, 1.9, 5.1 and 3.3 kJ mol−1 for AS, AS–Zn, AS–Co and AS–Cu, respectively. The positive values of ΔH0ads indicate that the adsorption of the investigated inhibitors on the carbon steel surface is endothermic.


image file: c5ra20340f-f10.tif
Fig. 10 The relationship between ln[thin space (1/6-em)]Kads and 1/T for carbon steel in 1 M HCl solution containing different concentrations of inhibitors.

The entropy of the inhibitor adsorption ΔS0ads can be calculated using the following equation:78

 
image file: c5ra20340f-t10.tif(11)

The obtained ΔS0ads values are listed in Table 4. The positive values of ΔS0ads mean that the adsorption process is accompanied by an increase in entropy, as was expected, since the endothermic adsorption process is always accompanied by an increase of entropy which is the driving force for the adsorption of the inhibitor onto the carbon steel surface.79

3.9. Activation parameters

The apparent activation energy, Ea, of the corrosion reaction was determined using Arrhenius plots. The Arrhenius equation could be written as:80
 
image file: c5ra20340f-t11.tif(12)
where Ea represents the apparent activation energy, R is the gas constant, T is the absolute temperature, A is the pre-exponential factor, and k is the corrosion rate.

The apparent activation energy of the corrosion reaction in the presence and absence of the inhibitor could be determined by plotting ln[thin space (1/6-em)]k against 1/T, which gives a straight line with a slope permitting the determination of Ea. Fig. 11 shows these plots in the absence and presence of different concentrations of inhibitor (AS–Cu). The calculated values of the apparent activation corrosion energies in the absence and presence of inhibitors are listed in Table 5. The lower activation energy values in the presence of inhibitors support the results obtained from the weight loss and indicate chemisorption of the inhibitors.81


image file: c5ra20340f-f11.tif
Fig. 11 ln[thin space (1/6-em)]k versus 1/T curves for carbon steel dissolution in the absence and presence of different concentrations of inhibitor (AS–Cu) in 1 M HCl solution.
Table 5 Activation parameter values for carbon steel in 1 M HCl in the absence and presence of different concentrations of the synthesized inhibitors
Inhibitor Conc. of inhibitor (M) Ea (kJ mol−1) ΔH*ads (kJ mol−1) ΔS*ads (J mol−1 K−1)
AS 0.00 23.58 40.13 −173.73
5 × 10⁻⁵ 17.38 14.40 −177.51
1 × 10⁻⁴ 21.53 16.40 −187.31
5 × 10⁻⁴ 24.22 19.17 −200.85
1 × 10⁻³ 18.58 19.17 −213.00
5 × 10⁻³ 16.10 26.27 −234.28
AS–Zn 5 × 10⁻⁵ 20.89 16.42 −189.79
1 × 10⁻⁴ 21.54 18.31 −190.17
5 × 10⁻⁴ 20.94 18.36 −192.80
1 × 10⁻³ 21.94 18.96 −194.11
5 × 10⁻³ 19.01 19.37 −204.50
AS–Co 5 × 10⁻⁵ 21.97 16.42 −186.87
1 × 10⁻⁴ 22.34 18.31 −187.38
5 × 10⁻⁴ 18.90 18.36 −189.33
1 × 10⁻³ 23.66 18.96 −190.23
5 × 10⁻³ 24.17 19.37 −203.21
AS–Cu 5 × 10⁻⁵ 18.94 13.59 −193.30
1 × 10⁻⁴ 19.80 14.06 −197.07
5 × 10⁻⁴ 22.50 16.33 −198.30
1 × 10⁻³ 16.67 17.19 −216.86
5 × 10⁻³ 16.21 19.89 −220.80


Eqn (12) shows that −Ea/R is the slope of the straight line ln[thin space (1/6-em)]k vs. 1/T, so the value of Ea could elucidate the effect of temperature on corrosion inhibition. This behavior indicates that the adsorption of the inhibitors on the carbon steel in 1 M HCl is chemisorption.

The enthalpy and entropy of activation (ΔH* and ΔS*) were calculated from the transition state theory82 and are listed in Table 5.

 
image file: c5ra20340f-t12.tif(13)
where h is Planck’s constant, NA is Avogadro’s number, R is the universal gas constant, ΔH* is the enthalpy of activation and ΔS* is the entropy of activation. Plotting ln(k/T) against 1/T (eqn (13)) for carbon steel dissolution in 1 M HCl in the absence and presence of different concentrations from the synthesized inhibitors gives straight lines as illustrated in Fig. 12. The data in Table 5 represent the values of ΔH* and ΔS*, which were calculated from the slope of −ΔH*/R and the intercept of ln(R/NAh) + ΔS*/R of the straight lines. The values of ΔH* and ΔS* were calculated and are listed in Table 5. Inspection of these data revealed that the positive signs of the enthalpy (ΔH*) reflected the endothermic nature of the steel dissolution process and indicated that the dissolution of steel was difficult.83 It is clear from Table 5 that the ΔS* values in the absence and presence of the prepared alginate derivatives have a negative sign; this implies that the activated complex in the rate determining step represents association rather than dissociation, indicating that there is more order going from the reactant to the activate complex.84 The values of the entropy of activation ΔS* in the tested solutions are large and negative. The table illustrates that the values of ΔS* move towards more negative values with the increasing inhibitor molecular weight. However many authors have discussed this phenomenon. As in the free acid solutions, the transition state of the rate determining recombination step represents a more orderly arrangement relative to the initial state. Hence, a large negative value for the entropy of activation is obtained. In the presence of the inhibitors, the rate determining step is the discharge of hydrogen ions to form adsorbed hydrogen atoms. The discharge of hydrogen ions at the metal surface will be retarded by adsorption of inhibitor molecules on the surface metal. This causes the system to pass from a more orderly to a less orderly arrangement, hence the less negative values of activation entropy are observed.


image file: c5ra20340f-f12.tif
Fig. 12 Arrhenius plots of ln(k/T) versus 1/T for carbon steel in 1 M HCl solution without and with different concentrations of the synthesized inhibitor (AS–Cu).

3.10. Energy dispersive X-ray (EDX) analysis

EDX micrographs of the surfaces of carbon steel were recorded in order to see the changes that occurred during the corrosion process in the absence and presence of the inhibitors as shown in the ESI, Fig. S10a and b. The EDX spectrum of carbon steel in uninhibited 1.0 M HCl (ESI, Fig. S10a) shows the characteristic peaks of the elements constituting the carbon steel sample which show the oxide film formed (8.4%). However, the EDX spectrum of inhibited carbon steel (ESI, Fig. S10b) in the presence of 5 × 10⁻³ M of the synthesized alginate surfactant (AS–Cu) shows the oxide percentage (0.64%). These indicated that the surfaces were covered with a protective film of the inhibitor molecules. The inhibitor molecules were strongly adsorbed on the carbon steel surface.

3.11. Scanning electron microscopy (SEM)

The SEM micrographs of the corroded carbon steel in the presence of 1 M HCl solution are shown in the ESI, Fig. S11a.) The faceting seen in this figure is a result of pits formed due to the exposure of carbon steel to the acid. The influence of the inhibitor addition (5 × 10⁻³ M) on the carbon steel in 1 M HCl solution is shown in the ESI, Fig. S11b. The faceting observed in the figures disappeared and the surface was free from pits and it was smooth. It can be concluded from the ESI, Fig. S11b that corrosion does not occur in the presence of the inhibitor and hence corrosion was inhibited strongly when the inhibitor was present in the hydrochloric acid.

3.12. Mechanism of inhibition

The results obtained from all the experimental techniques reveal that addition of alginate derivatives to the acidic corrosive medium retarded the corrosion of carbon steel. The corrosion inhibition process no doubt occurs by virtue of an adsorption mechanism where the oxygen and nitrogen heteroatoms present in the alginate molecular structure serve as adsorption centers to contain excessive negative charges. The thermodynamic data suggest that the adsorption of alginate derivatives on the steel surface follows the chemisorption mode at a higher temperature. In acidic medium, the anodic dissolution of iron is accompanied by the cathodic hydrogen evolution reaction as follows:
 
Fe → Fe2+ + 2e (14)
 
2H+ + 2e → H2 (15)

Potentiodynamic polarization results indicate that the alginate derivatives follow a mixed inhibition mechanism. The chemical structure of the alginate derivative repeat unit (Fig. 1) reveals the presence of ammonium–N+, –COOCH2CH2 and –OH functional groups. It could be assumed that the cationic form of alginate may be adsorbed on the cathodic sites of carbon steel and this inhibits the cathodic hydrogen evolution reaction. On the other hand, –OH groups have lone pairs of electrons and can be adsorbed on the anodic sites of the metal surface via interaction with the vacant d-orbital of iron and this inhibits the anodic metal dissolution reaction. These processes effectively help in isolating the metal surface from the aggressive ions present in the acidic medium, thereby inhibiting corrosion. It is also known that in the acidic corrosive medium, the inhibitor (alginate derivative) may be protonated and exists as a polycation and the surface of Fe is positively charged, hence the occurrence of mutual repulsion between them. However, the specific adsorption of chloride ions (Cl) and the replacement of hydroxyl groups on the metal surface would render the metal surface negatively charged and increase the surface activity of the surfactants.27,85–89 Hence alginate in the form of polycations will be adsorbed on the negatively charged metal surface and inhibit corrosion.

4. Conclusions

Electrochemical and chemical techniques of monitoring corrosion as well as the surface analysis approach were employed to evaluate the potential of alginate derivatives (biopolymers) as an inhibitor for carbon steel corrosion in an acidic environment. The results obtained show that alginate derivatives act as a good inhibitor for acid-induced corrosion of carbon steel. The corrosion inhibition effect was found to be inhibitor concentration and temperature dependent; the inhibition efficiency increased with increasing the alginate derivative concentration and the solution temperature. Potentiodynamic polarization studies reveal that the alginate derivatives function as a mixed-type inhibitor but under cathodic control. Alginate derivatives are assumed to function as an inhibitor by virtue of adsorption of its molecules onto the steel surface which can be approximated by the Langmuir adsorption isotherm model. The results obtained from the weight loss measurements were in good agreement with those obtained from the potentiodynamic polarization and EIS methods.

References

  1. A. M. Al-Sabagh, H. M. Abd-El-Bary, R. A. El-Ghazawy, M. R. Mishrif and B. M. Hussein, Egypt. J. Pet., 2011, 20, 33–45 CrossRef CAS.
  2. M. A. Migahed, M. Abd-El-Raouf, A. M. Al-Sabagh and H. M. Abd-El-Bary, Electrochim. Acta, 2005, 50(24), 4683–4689 CrossRef CAS.
  3. E. E. Oguzie, S. G. Wang, Y. Li and F. H. Wang, J. Phys. Chem. C, 2009, 113, 8420 CAS.
  4. R. Uffana, S. M. Ashraf and S. Ahmad, Prog. Org. Coat., 2007, 59, 138 CrossRef.
  5. A. K. Satapathy, G. Gunasekaran, S. C. Sahoo, K. Amit and P. V. Rodrigues, Corros. Sci., 2009, 51, 2848–2856 CrossRef CAS.
  6. P. C. Okafor, M. E. Ikpi, I. E. Uwah, E. E. Ebenso, U. J. Ekpe and S. A. Umoren, Corros. Sci., 2008, 50, 2310–2317 CrossRef CAS.
  7. A. Bouyanzer and B. Hommouti, Pigm. Resin Technol., 2004, 33, 287–292 CrossRef CAS.
  8. A. Chetouani, B. Hommouti and M. Benkaddour, Pigm. Resin Technol., 2004, 33, 26 CrossRef CAS.
  9. A. Singh, V. K. Singh and M. A. Quraishi, J. Mater. Environ. Sci., 2010, 1, 162–174 Search PubMed.
  10. S. K. Gopal Ji, P. Shukla, S. Dwivedi, E. E. Sundaram, R. Ebenso and R. Prakash, Int. J. Electrochem. Sci., 2012, 7, 12146–12158 Search PubMed.
  11. M. A. Quraishi, I. H. Farooqi and P. A. Saini, Corrosion, 1999, 55, 493–497 CrossRef CAS.
  12. T. H. Ibrahim, Y. Chehade and M. A. Zour, Int. J. Electrochem. Sci., 2011, 6, 6542–6556 CAS.
  13. T. Ibhrahim and M. Habbab, Int. J. Electrochem. Sci., 2011, 6, 5357–5371 Search PubMed.
  14. A. Altwaiq, S. Khouri, S. Al-luaibi, R. Lehmann, H. Driicker and C. Vogt, J. Mater. Environ. Sci., 2011, 2, 259–270 CAS.
  15. F. S. de Souza and A. Spinelli, Corros. Sci., 2009, 51, 642–649 CrossRef CAS.
  16. B. Qian, J. Wang, M. Zheng and B. Hou, Corros. Sci., 2013, 75, 184–192 CrossRef CAS.
  17. V. Rajeswari, D. Kesavan, M. Gopiraman and P. Viswanathamurthi, Carbohydr. Polym., 2013, 95, 288–294 CrossRef CAS PubMed.
  18. E. Bayol, A. A. Gvrten, M. Dursun and K. Kayakirilmaz, Acta Phys.-Chim. Sin., 2008, 24, 2236–2242 CrossRef CAS.
  19. J. Fu, S. Li, Y. Wang, X. Liu and L. Lu, J. Mater. Sci., 2011, 46(10), 3550–3559 CrossRef CAS.
  20. J. Fu, H. Zang, Y. Wang, S. Li, T. Chen and X. Liu, Ind. Eng. Chem. Res., 2012, 51(18), 6377–6386 CrossRef CAS.
  21. G. Gece, Corros. Sci., 2011, 53(12), 3873–3898 CrossRef CAS.
  22. A. R. Hosein Zadeh, I. Danaee and M. H. Maddahy, J. Mater. Sci. Technol., 2013, 29(9), 884–892 Search PubMed.
  23. P. Roy, A. Pal and D. Sukul, RSC Adv., 2014, 4(21), 10607–10613 RSC.
  24. M. M. Solomon, S. A. Umoren, I. I. Udosoro and A. P. Udoh, Corros. Sci., 2010, 52(4), 1317–1325 CrossRef CAS.
  25. S. A. Umoren, M. J. Banera, T. Alonso-Garcia, C. A. Gervasi and M. V. Mirífico, Cellulose, 2013, 20(5), 2529–2545 CrossRef CAS.
  26. S. A. Umoren, Z. M. Gasem and I. B. Obot, Ind. Eng. Chem. Res., 2013, 52(42), 14855–14865 CrossRef CAS.
  27. M. N. El-Haddad and A. S. Fouda, J. Dispersion Sci. Technol., 2013, 34(10), 1471–1480 CrossRef CAS.
  28. M. M. Hussein, M. El-Hady, H. H. Shehata, M. Hegazy and H. H. Hefni, J. Surfactants Deterg., 2013, 16(2), 233–242 CAS.
  29. A. M. Alsabagh, M. Z. Elsabee, Y. M. Moustafa, A. Elfky and R. E. Morsi, Egypt. J. Pet., 2014, 23, 349–359 CrossRef.
  30. V. Rajeswari, D. Kesavan, M. Gopiraman and P. Viswanathamurthi, Carbohydr. Polym., 2013, 95(1), 288–294 CrossRef CAS PubMed.
  31. H. Bentrah, Y. Rahali and A. Chala, Corros. Sci., 2014, 82, 426–431 CrossRef CAS.
  32. S. A. Umoren, Cellulose, 2008, 15(5), 751–761 CrossRef CAS.
  33. S. A. Umoren, I. B. Obot, E. E. Ebenso, P. C. Okafor, O. Ogbobe and E. E. Oguzie, Anti-Corros. Methods Mater., 2006, 53(5), 277–282 CrossRef CAS.
  34. M. Bello, N. Ochoa, V. Balsamo, F. López-Carrasquero, S. Coll, A. Monsalve and G. González, Carbohydr. Polym., 2010, 82(3), 561–568 CrossRef CAS.
  35. I. Braccini and S. Pérez, Biomacromolecules, 2001, 2, 1089–1096 CrossRef CAS PubMed.
  36. N. A. Negm, F. M. Ghuiba, S. A. Mahmoud and S. M. Tawfik, Eng. Life Sci., 2011, 11(5), 496–510 CrossRef CAS.
  37. N. A. Negm, Y. M. Elkholy, M. K. Zahran and S. M. Tawfik, Corros. Sci., 2010, 52, 3523–3536 CrossRef CAS.
  38. S. M. Tawfik, A. Sayed and I. Aiad, J. Surfactants Deterg., 2012, 15, 577 CrossRef CAS.
  39. A. Abd-Elaal, I. Aiad, S. M. Shaban, S. M. Tawfik and A. Sayed, J. Surfactants Deterg., 2014, 17, 483–491 CrossRef CAS.
  40. N. A. Negm, F. M. Ghuiba and S. M. Tawfik, Corros. Sci., 2011, 53, 3566–3575 CrossRef CAS.
  41. I. Aiad, S. M. Tawfik, S. M. Shaban, A. Abd-Elaal and M. El-Shafie, J. Surfactants Deterg., 2014, 17, 391–401 CrossRef CAS.
  42. S. M. Shaban, A. Sayed, S. M. Tawfik, A. Abd-Elaal and I. Aiad, J. Ind. Eng. Chem., 2013, 19, 2004 CrossRef CAS.
  43. S. M. Tawfik, J. Mol. Liq., 2015, 209, 320–326 CrossRef CAS.
  44. N. A. Negm, Y. M. Elkholy, F. M. Ghuiba, M. K. Zahran, S. A. Mahmoud and S. M. Tawfik, J. Adsorp. Sci. Technol., 2011, 32, 512–518 CAS.
  45. S. M. Tawfik and M. F. Zaky, J. Surfactants Deterg., 2015, 18, 863–871 CrossRef CAS.
  46. M. F. Zaki, I. A. Aiad and S. M. Tawfik, J. Ind. Eng. Chem., 2015, 21, 1174–1182 CrossRef.
  47. N. A. Negm, S. M. Tawfik, E. A. Badr, M. I. Abdou and F. M. Ghuiba, J. Surfactants Deterg., 2015, 18, 413–420 CrossRef CAS.
  48. N. A. Negm, F. M. Ghuiba and S. M. Tawfik, Corros. Sci., 2011, 53, 3566–3575 CrossRef CAS.
  49. M. H. M. Hussein, M. F. El Hady, W. M. Sayed and H. Hefni, J. Polym. Sci. Ser. A, 2012, 54, 113–124 CrossRef CAS.
  50. A. M. A. Alaghaz, H. A. Bayoumi, Y. A. Ammar and S. A. Aldhlmani, J. Mol. Struct., 2013, 1035, 383–399 CrossRef CAS.
  51. M. Hwang, L. Lin and W. Hwang, Progress In Electromagnetics Research Symposium Proceedings, Taipei, 2013, 28, 372–375 CrossRef.
  52. T. A. davis, F. llanes, B. volesky, G. diaz-pulido, L. mccook and A. mucc, Appl. Biochem. Biotechnol., 2003, 110, 75–90 CrossRef CAS PubMed.
  53. A. S. El-Tabl, R. M. El-Bahnasawy, M. M. E. Shakdofa and A. E. Abdalah, J. Chem. Res., 2010, 88, 210 Search PubMed.
  54. A. A. Farag and M. A. Hegazy, Corros. Sci., 2013, 74(0), 168–177 CrossRef CAS.
  55. X. He, Y. Jiang, C. Li, W. Wang, B. Hou and L. Wu, Corros. Sci., 2014, 83(0), 124–136 CrossRef CAS.
  56. J. Hu, D. Zeng, Z. Zhang, T. Shi, G. L. Song and X. Guo, Corros. Sci., 2013, 74(0), 35–43 CrossRef CAS.
  57. S. Haruyama, T. Tsuru and B. Gijutsu, J. Jpn. Soc. Corros. Eng., 1978, 27, 573 Search PubMed.
  58. S. M. Tawfik and M. F. Zaky, Res. Chem. Intermed., 2015, 41, 8747–8772 CrossRef CAS.
  59. S. Martinez and M. Metikoš-Huković, J. Appl. Electrochem., 2003, 33(12), 1137–1142 CrossRef CAS.
  60. S. M. Tawfik, A. A. Abd-Elaal and I. Aiad, Res. Chem. Intermed.  DOI:10.1007/s11164-015-2076-4.
  61. S. A. Umoren, M. M. Solomon, U. M. Eduok, I. B. Obot and A. U. Israel, J. Environ. Chem. Eng., 2014, 2(2), 1048–1060 CrossRef CAS.
  62. M. A. Hegazy, A. M. Hasan, M. M. Emara, M. F. Bakr and A. H. Youssef, Corros. Sci., 2012, 65, 67–76 CrossRef CAS.
  63. H. Keles, M. Keles, I. Dehri and O. Serindag, Mater. Chem. Phys., 2008, 112, 173–179 CrossRef CAS.
  64. S. M. Tawfik, J. Mol. Liq., 2015, 207, 185–194 CrossRef CAS.
  65. O. K. Abiola and J. O. E. Otaigbe, Corros. Sci., 2009, 51, 2790 CrossRef CAS.
  66. S. Ghareba and S. Omanovic, Corros. Sci., 2010, 52, 2104 CrossRef CAS.
  67. E. E. Oguzie, C. Unaegbu, C. N. Ogukwe, B. N. Okolue and A. I. Onuchukwu, Mater. Chem. Phys., 2004, 84, 363–368 CrossRef CAS.
  68. X. Li, S. Deng and H. Fu, Corros. Sci., 2011, 53, 3241–3247 CrossRef CAS.
  69. M. Palomar-Pardavé, M. Romero-Romo, H. Herrera-Hernández, M. A. Abreu-Quijano, N. V. Likhanova, J. Uruchurtu and J. M. Juárez-García, Corros. Sci., 2012, 54, 231–243 CrossRef.
  70. S. M. Tawfik and N. A. Negm, Res. Chem. Intermed., 2015 DOI:10.1007/s11164-015-2233-9.
  71. G. Moretti, F. Guidi and G. Grion, Corros. Sci., 2004, 46, 387 CrossRef CAS.
  72. S. M. A. Hosseini and A. Azimi, Corros. Sci., 2009, 51, 728 CrossRef CAS.
  73. F. Bentiss, M. Lebrini and M. Lagrenee, Corros. Sci., 2005, 47, 2915–2931 CrossRef CAS.
  74. W. H. Li, Q. He, S. T. Zhang, C. L. Pei and B. R. Hou, J. Appl. Electrochem., 2008, 38, 289–295 CrossRef CAS.
  75. E. Bensajjay, S. Alehyen, M. El Achouri and S. Kertit, Anti-Corros. Methods Mater., 2003, 50, 402–409 CrossRef.
  76. N. A. Negm, E. A. Badr, S. M. Tawfik and A. F. El Farargy, J. Appl. Chem., 2014, 7(6), 13 CAS.
  77. T. P. Zhao and G. N. Mu, Corros. Sci., 1999, 41, 1937 CrossRef CAS.
  78. A. M. Badawi, M. A. Hegazy, A. A. El-Sawy, H. M. Ahmed and W. M. Kamel, Mater. Chem. Phys., 2010, 124, 458–465 CrossRef CAS.
  79. H. Ashassi-Sorkhabi, B. Shaabani and D. Seifzadeh, Appl. Surf. Sci., 2005, 239, 154–164 CrossRef CAS.
  80. M. M. Saleh, Mater. Chem. Phys., 2006, 98, 83–89 CrossRef CAS.
  81. A. Popova, M. Christov and A. Vasilev, Corros. Sci., 2007, 49, 3276–3289 CrossRef CAS.
  82. H. Ashassi-Sorkhabi, B. Shaabani and D. Seifzadeh, Electrochim. Acta, 2005, 50, 3446–3452 CrossRef CAS.
  83. M. S. Morad and A. M. Kamal El-Dean, Corros. Sci., 2006, 48, 3398–3412 CrossRef CAS.
  84. A. S. Fouda, A. A. Al-Sarawy and E. E. El-Katori, Desalination, 2006, 201, 1–13 CrossRef CAS.
  85. N. A. Negm, S. M. Tawfik, M. I. Abdou, E. A. Badr and F. M. Ghuiba, J. Surfactants Deterg., 2015, 18, 309–319 CrossRef.
  86. S. M. Tawfik, J. Ind. Eng. Chem., 2015, 28, 171 CrossRef CAS.
  87. M. F. Zaki and S. M. Tawfik, J. Oleo Sci., 2014, 63, 921 CrossRef CAS PubMed.
  88. G. H. Sayed, F. M. Ghuiba, M. I. Abdou, E. A. Badr, S. M. Tawfik and N. A. Negm, Colloids Surf., A, 2012, 393, 96 CrossRef CAS.
  89. R. Yıldız, T. Doğan and İ. Dehri, Corros. Sci., 2014, 85, 215–221 CrossRef.

Footnote

Electronic supplementary information (ESI) available. See DOI: 10.1039/c5ra20340f

This journal is © The Royal Society of Chemistry 2015
Click here to see how this site uses Cookies. View our privacy policy here.