Optimization and hydrolysis of cellulose under subcritical water treatment for the production of total reducing sugars

Mood Mohana, Robinson Timunga, Narendra Naik Deshavathb, Tamal Banerjee*a, Vaibhav V. Goud*ab and Venkata V. Dasubc
aDepartment of Chemical Engineering, Indian Institute of Technology Guwahati, Guwahati, Assam 781039, India. E-mail: tamalb@iitg.ernet.in; vvgoud@iitg.ernet.in; Fax: +91 361 2582291; Tel: +91-361-2582266, +91-361-2582272
bCentre for the Environment, Indian Institute of Technology Guwahati, Guwahati, Assam 781039, India
cDepartment of Biosciences and Bioengineering, Indian Institute of Technology Guwahati, Guwahati, Assam 781039, India

Received 1st October 2015 , Accepted 19th November 2015

First published on 23rd November 2015


Abstract

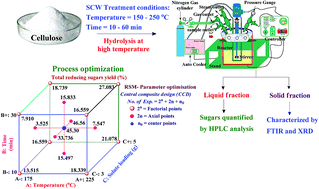
Subcritical water (SCW) treatment has gained enormous attention as an environmentally friendly technique for organic matter and an attractive reaction medium for a variety of applications. In this work, hydrolysis of cellulose was studied under SCW conditions in a batch reactor to attain total reducing sugars (TRS) within a reaction temperature and time range of 150 to 250 °C and 10–60 min, respectively. From the experimental results, the highest yield of TRS was 45.04% as obtained at 200 °C and 20 min of hydrolysis time. The characterisation techniques, namely X-ray diffraction (XRD) and Fourier transform infrared (FTIR) spectroscopy were used as to determine the structural and compositional changes in the hydrolysed material. Reaction parameters such as temperature, time, and solute loading have been optimised using response surface methodology based on a central composite design. From ANOVA analysis, it was described that the second-order response surface model is highly significant as per Fisher's F-test and P-value. A first-order reaction kinetic model was formulated to describe the hydrolysis of cellulose for TRS formation and decomposition. For TRS formation, the activation energy and pre-exponential factor of the Arrhenius equation was found to be 29.16 kJ mol−1 and 0.088 min−1 for 60 min, respectively.

Introduction

Lignocellulosic biomass is a renewable energy resource for the production of biofuels. There is an extensive study which reports the production of environmentally friendly energy and its value added chemicals from lignocellulosic biomass.1,2 Further, biomass produced energy has been shown to reduce carbon dioxide emission.3,4 Natural lignocellulosic biomass is dominated by cellulose (30–50%), hemicellulose (25–35%) and lignin (5–30%). The lignocellulosic biomasses are acknowledged as tempting feedstock for the production of fuel alcohol, due to their accessibility in huge amounts at lower prices.5 Cellulose is the primary constituent in any biomass which produces monomeric sugar (glucose). Hemicellulose is the secondary most abundant polymer in biomass and produces pentose (xylose, arabinose) and hexose sugars (galactose, glucose and mannose).6 Thus, the main aim of lignocellulosic biomass pretreatment is to alter the structure of cellulosic biomass by removing hemicellulose/lignin, in order to make cellulose more accessible to adsorbate. Consequently, the separated components can be easily hydrolysed to fermentable sugars using enzymes or mineral acids. Further, the fermentable sugars can be converted into valuable bio-based chemicals.7

Cellulose is the most abundant and the studied organic matter on earth.8 Cellulose is a homopolymer, where 100 to 3000 glucose molecules are combined at the β(1 → 4) position. It is a valuable renewable energy resource, which on hydrolysis yields cellobiose, glucose, fructose and other value added products.9 Each glucose molecule has three hydroxyl groups in cellulose, and it has a high affinity to water. Due to this reason, cellulose can be dissolved in water at high temperature. Because of, cellulose molecule has strong intramolecular and intermolecular hydrogen linkages through the hydroxyl groups, and forms crystal structure at normal conditions.10,11

The significant innovations proposed for the hydrolysis of lignocellulosic biomass pretreatment with acid or base is not satisfactory because of ecological issues, and enzymatic hydrolysis which are time consuming processes.12 On the other hand, sub or a supercritical water treatment has been showing promise as an eco-friendly technique with an extensive variety of provisions. Moreover, it is cheap, non-toxic, non-flammable, non-explosive and having many advantages compared to other substances, mainly in the field of “green chemistry”.13–15 Subcritical water (SCW) is hot water at temperature ranging between 100 to 374 °C under high pressure, such that it retains as liquid state. During this process, decrease in the dielectric constant is seen from 80 (at room temperature) to nearly 27 (at 250 °C). It was also observed that the viscosity and density of water decreases with ionization constant, while on the contrary diffusivity of water increases at subcritical condition.16–18

However, the selection of process variables namely temperature, time and pressure required design of experiments. In this regard, response surface methodology (RSM) is a set of mathematical and statistical approaches that is used to find out the appropriate relationship between independent variables and the response of interest.19,20 The RSM technique has many advantages: it is less expensive, less time consuming and can investigated several number of factors at a time with a performance of minimum number of experiments. Thus, it evaluates the interaction between the independent variables and response. Central composite design (CCD) is the most popular design for optimization of independent variables.21 The choice of CCD is justified by several advantages such as providing adequate statistics on the independent variables and overall experimental error with a minimum number of experiments.22 Preliminary experiments are performed to find out the levels of the independent variables by the changing one variable at a time. At the same time, other variables are fixed at one level for studying the effect of variables on the response.

Over the past few years, several researchers reported the hydrolysis of cellulose under sub and supercritical water treatment to produce valuable chemicals. Sasaki et al.9,11 studied the hydrolysis of cellulose under sub and supercritical water treatment at temperature ranging from 290 to 400 °C and 25 MPa of pressure. The results demonstrated that the cellulose can be effectively converted to hydrolysis products such as oligosaccharides, cellobiose, glucose and fructose. Further, the decomposed products from glucose namely 5-hydroxymethyl furfural, furfural, erythrose, glycolaldehyde and dihydroxyacetone were also formed within seconds using a flow type reactor. In 2002, Ehara and Saka,23 examined the chemical conversion of cellulose in batch and flow type reactors. At 380 °C, 29.5% and 18.9% yield of hexose sugars (glucose and fructose) was obtained using batch (100 MPa) and flow type (40 MPa) reactors, respectively. Using a flow type reactor, Ehara and Saka,13 reported 22.7% yield of water soluble sugars such as glucose, fructose and cellobiose at 280 °C and 40 MPa. In case of supercritical water treatment, the flow type reactor yielded 46.7% of sugars at 400 °C and 40 MPa. In a similar study, a batch type reactor yielded 37% at 378 °C.13,24 Kumar et al.8 reported 24.4% yield of hydrolysis products (16.1% oligomers, 2.8% cellobiose, 5% glucose and 0.5% fructose) at 303 °C and 27.6 MPa with cellulose using a flow type reactor.

From the aforementioned discussions, it was clear that the hydrolysis of cellulose requires high temperature and pressure for the production of reducing sugars. To overcome this issue, the current study attempts to maximise the TRS yield from cellulose in a batch-type reactor at lower operating conditions. The current study also focuses on optimizing the effective process parameters such as temperature, time and solute loading by using a RSM technique via central composite design (CCD). In course of the study, treated and untreated cellulose samples were characterised by X-ray diffraction (XRD) and Fourier transforms infrared (FTIR) spectroscopy. In the concluding part, the kinetics studies on cellulose hydrolysis were also investigated.

Materials and methods

Materials

Microcrystalline cellulose (MCC) powder was used in this study as a feedstock. The chemicals used for high performance liquid chromatography (HPLC) analysis were as follows: glucose (≥99.5%), fructose (≥99%), cellobiose (≥98%), 5-(hydroxymethyl) furfural (5-HMF, ≥99%), and furfural (≥98%). All the chemicals were purchased from Sigma-Aldrich, Germany and were used without purification.

Experimental procedure

The SCW treatment and hydrolysis experiments have been detailed discussed in our earlier work on bamboo,25 which was carried out in a 1734-type batch reactor (manufactured by Amar equipment Pvt. Ltd., India). The system consists of 500 ml reaction vessel, magnetic driven stirrer with 60 ml minimum stirring volume, temperature controller, U-type internal cooling coil and electric heater. Hydrolysis of cellulose under SCW condition was performed between 150 °C to 250 °C with the interval of 25 °C for 10 to 60 min (10 min interval).

Experiments were performed in 500 ml reaction vessel containing a 4 g of cellulose in 100 ml of deionised water. To maintain the constant volume of solution mixture, an extra amount (20 ml) of deionised water was added to the system due to the loss of water during the hydrolysis process. Inside temperature of the reactor was measured using a thermocouple and controlled at operating temperature. The pressure inside the reactor was maintained at 4.7, 8.9, 16.8, 25.4, and 39.6 bar with corresponding temperatures as 150, 175, 200, 225, and 250 °C, respectively. It can also be controlled slightly above by using nitrogen as a pressurised gas, which was done to assure that water remained as liquid. During the hydrolysis process, the reaction content was mixed for 60 min continuously via magnetic driven stirrer at desired temperature. At these conditions, liquid samples were collected through a sample outlet at different reaction time intervals, and then immediately quenched to provide truly representative samples. This was further utilized for HPLC analysis. In the case of cellulose residue, the samples were cooled up to room temperature within the reactor. Finally, the collected residual sample was dried at 60 °C for 24 h and characterized using XRD and FTIR analysis. All the experiments were performed in duplicate and standard values are reported. After each experiment, the emptied reactor was pressurized to 15 bar with water before the reaction, in order to avoid any choking problem.

HPLC analysis

The liquid and a solid portion of hydrolysed product was separated from the collected liquid samples at each time interval by centrifugation and then collected liquid samples were filtered with 0.2 μm nylon membrane filter paper (diameter: 25 mm purchased from AXIVA, India) through a 0.22 μm syringe filter before HPLC analysis. Quantitative estimation of reducing sugars (cellobiose, glucose, fructose), and degraded products were analysed by HPLC (Perkin Elmer Series 200, USA) with a sugar column SUPECOGEL Ca connected to SUPELCOGEL Ca* guard column, which were purchased from Sigma-Aldrich. The products were analyzed with a refractive index (RI) detector at a column temperature of 80 °C with 0.8 ml min−1 flow rate and the milli-Q water was used as an eluent. HPLC peaks were identified by the comparison of sample peak retention time with the help of calibration plots of pure compounds.26–28

Fourier transforms infrared (FTIR) spectroscopy

FTIR spectroscopy (Shimadzu, IR Affinity 1, Japan) was used to study the changes of functional groups which are present in treated and untreated cellulose materials. 20 mg of the cellulose sample was mixed with 30 mg of the spectroscopic grade dried KBr. FTIR analysis was conducted at the wave number range of 4000–400 cm−1, with a resolution of 2 cm−1 and 30 scans per sample. The background spectrum of pure dried KBr was deducted from the sample spectrum.29,30 Baseline and other necessary corrections for the penetration depth and frequency variations were applied using Shimadzu IR solution 1.5 software.

X-ray diffraction (XRD) analysis

X-ray diffractometer (Brucker D8 Advanced XRD measurement system, Japan) was used to analyse the crystallinity of cellulose before and after treatment. The Rigaku miniflex powder XRD was equipped with Cu Kα (λ = 1.541 Å) radiation settled at 40 kW voltages and 40 mA current. The diffraction angle (2θ) was 10 to 30° at a scan speed of 1° min−1 and step size 0.05°. The crystallinity index (Crl) was calculated based on the diffraction intensities of crystalline and amorphous regions as given by the following equation:8,29,30
 
image file: c5ra20319h-t1.tif(1)
where, I002 = peak intensity corresponding to the 002 lattice plane of a cellulose molecule at 2θ = 22.4°, and Iam = peak intensity of amorphous region at 2θ = 18.5°. I002 symbolizes both crystalline and amorphous material while Iam represents amorphous material.31

Experimental design and statistical analysis

A three level-three factor CCD design was employed with the six replicates at central points, six axial points (α = ±1.68), and eight orthogonal factorial points, requiring a total of 20 experimental runs. The experimental data obtained in the hydrolysis process was statistically analysed by RSM technique. The selection of independent variables and their levels for TRS yield were: temperature (175 to 225 °C, X1), time (10 to 30 min, X2), and solute loading (3 to 5 g, X3) according to the preliminary results. All the experiments were performed in the batch reactor at a desired temperature, solute loading, and dissimilar time intervals. Table 1 summarised the design matrix of independent variables, obtained and predicted the response (TRS yield) of cellulose hydrolysis under SCW condition. Design expert software® trial version 7 (Stat-Ease, inc., Minneapolis, MN, USA) was used for regression and graphical analysis of obtained results. The statistical analysis was based on the relationship between the coded (Zi) and the real values (Xi) according to the following equation:32–34
 
image file: c5ra20319h-t2.tif(2)
where, Zi is a dimensionless coded value of an independent variable, Xi is its corresponding real value of the independent variable, Xo is the real value of an independent variable (Xi) at the centre point, and ΔXi is the step change content of uncoded variable i. Each independent variable was varied over three levels such as axial points (+ and −), factorial points (+ and −) and the centre point. The behaviour of the system can be explained by a second-order polynomial model, which was generated to express the responses as a function of the independent variables.35–37
 
image file: c5ra20319h-t3.tif(3)
where, Y is the predicted response (TRS yield), β0, βi, βii, and βij, are the intercept, linear, quadratic and interaction coefficients, respectively. Xi, Xj is uncoded independent variables, and εijk is the random error. The number of variables represented by i, j, k, and n should be integers. When i < j, βij represents the interaction effects of the variables Xi and Xj. The analysis of a variance (ANOVA) test was used to evaluate the statistical significance of the model via probability value (P < 0.05), and Fisher's satirical test (F-test) i.e., in the form of F-value.32 The value of regression coefficient (R2) indicated that the adequacy of fitting between the experimental and predicted response.
Table 1 Extraction process variables of CCD matrix and its corrresponding experimental and predicted responsesa
Std. order Run order Temp. (X1) Time (X2) S.L. (X3) TRS yield (%)
Experimental Predicted
a Temp. = temperature, S.L. = solute loading.
1 16 175 10 3 10.30 13.50
2 3 225 10 3 17.38 18.33
3 2 175 30 3 6.25 7.90
4 6 225 30 3 18.75 16.55
5 19 175 10 5 10.94 16.55
6 7 225 10 5 19.31 21.07
7 9 175 30 5 16.27 18.73
8 1 225 30 5 26.87 27.07
9 5 158 20 4 2.53 3.51
10 10 242 20 4 6.34 7.56
11 4 200 3.18 4 20.72 15.51
12 15 200 36.8 4 15.46 15.85
13 18 200 20 2.32 34.25 33.75
14 12 200 20 5.70 49.48 46.56
15 14 200 20 4 44.40 45.30
16 8 200 20 4 45.04 45.30
17 11 200 20 4 46.67 45.30
18 13 200 20 4 43.08 45.30
19 20 200 20 4 46.03 45.30
20 17 200 20 4 45.75 45.30


Results and discussion

The microcrystalline cellulose powder was hydrolysed under SCW condition to convert it into valuable products. The components of cellulose decomposition in SCW treatment are reducing sugars i.e., cellobiose, glucose, fructose and various degradation products such as 5-HMF, furfural, erythrose, acids and other intermediate products. Reducing sugars such as cellobiose, glucose, and fructose were accounted as total reducing sugars. Reaction time, temperature, and solute loading were considered to investigate the affecting parameters on TRS yield. The concentration of reducing sugars was calculated on the basis of weight. It was then converted to yield percentage by using the following equation.
image file: c5ra20319h-t4.tif
here, CB is the concentration of the reducing sugars obtained from cellulose hydrolysis (mg ml−1), V the obtained hydrolysate volume (ml), and CA0 the initial mass of cellulose (mg). During the hydrolysis process, ∼10% of water loss may be caused due to evaporation and ∼5% of water loss may be entrained in the cellulose residue. The average sampling volume was 1.5 ml at each reaction time interval. The volume of water remained during the hydrolysis is 103, 101.5, 100, 98.5, 97, and 95.5 ml at the corresponding time periods of 10, 20, 30, 40, 50 and 60 min, respectively.

Effect of reaction temperature on TRS yield by SCW treatment

The effect of reaction temperature on the TRS yield is shown in Fig. 1. From the Fig. 1, it was found that the yield of TRS increases from 150 °C to 200 °C, while it decreased at 225 °C and 250 °C due to a higher rate of formation of degraded products at their specific temperatures. In order to avoid the sugars decomposition, the hydrolysis of cellulose was not studied beyond 250 °C. The highest yield of TRS was found to be 45.04% at 200 °C when the reaction time was 20 min. By contrast, the TRS yields were 1.96%, 14.56%, 26.64% and 4.44% when the reaction temperature was 150 °C, 175 °C, 225 °C and 250 °C at 20 min reaction time. The decrease in the TRS yield at higher temperatures (beyond 200 °C) resulted due to higher conversion of reducing sugars into degraded products.
image file: c5ra20319h-f1.tif
Fig. 1 Effect of reaction temperature on the total reducing sugar yield at 20 min reaction time.

Decomposition of cellulose under SCW treatment effects the formation of water soluble oligomers (cellotetraose, cellotriose, and cellobiose) and individual monomeric sugar units (glucose and fructose). Fig. 2 shows the individual sugars and TRS yield as a function of temperature against time. Fig. 2a represents the yield of glucose increased with temperature from 150 °C to 200 °C (22.20% at 200 °C and 20 min) and then decrease at 225 °C and 250 °C. It should be noted that glucose can isomerise into fructose or degrade to 5-HMF, erythrose, glyceraldehydes plus dihydroxyacetone and acids etc.26 Produced fructose can also decompose to glyceraldehydes plus dihydroxyacetone, erythrose, and 5-HMF.9 In contrast, fructose is less stable than glucose at SCW conditions.16 As the maximum yield of fructose was found to be increased from 150–200 °C (i.e., 18.02% at 200 °C and 30 min) subsequently results in decreased yield with an increase hydrolysis temperature (Fig. 2b). From Fig. 2c, it can seen that the yield of cellobiose increased at 150 °C and 175 °C, and then decrease with further increase in the temperature. This implies that cellobiose decomposes to hexoses and then converts to degradation products such as 5-HMF, furfural and other organic products. From Fig. 2c and a, it was observed that the yield of cellobiose was more than the glucose at a temperature close to 175 °C (i.e., 10.47% at 175 °C and 40 min). The cellobiose yield was also found to decrease with an increase temperature. This resulted in the formation of the glucose and other products due to the decomposition of cellobiose at higher temperatures. At high temperatures, the monomeric sugars decomposed rapidly to degraded products. The yield of degraded products was found to increase with an increase in reaction temperature and time (ESI Fig. S1). Thus, in summary, the glyceraldehydes molecules convert to dihydroxyacetone, while glyceraldehydes and dihydroxyacetone get dehydrated into pyruvaldehyde. Although degraded products such as erythrose, pyruvaldehyde, and glycolaldehyde further decomposes to form smaller species which are mainly acids and aldehydes.9,38 Apart from 5-HMF, furfural was also formed due to dehydration of glucose and fructose.39,40 The detailed possible reaction mechanism of cellulose hydrolysis was presented in Fig. 3.9,38,39


image file: c5ra20319h-f2.tif
Fig. 2 Yield of sugars as obtained in cellulose at different temperature plotted against reaction time, (a) glucose, (b) fructose, (c) cellobiose, (d) total reducing sugars.

image file: c5ra20319h-f3.tif
Fig. 3 Possible reaction mechanism of cellulose hydrolysis under subcritical water treatment (adapted from Sasaki et al.,9 Ooms et al.,38 Niu et al.39).

The hydrolysis rate of cellulose and oligosaccharide increased with an increase in the SCW temperature. However, the yield of hexose sugars (glucose and fructose), was found to be decreased after attaining the maximum yield, mainly because of the formation of degradation products at high temperature 225 °C and 250 °C.41 Here, the hexose sugars production was influenced by the reaction time and temperature. At the higher temperature, the degree of polymerization of the solubilised oligosaccharides has decreases due to increase in the ionization constant of water (Kw).25 This shows that it is possible to destroy the glycosidic bonds in cellulose and oligosaccharides at a higher temperature before converting it into monomers.42

Effect of reaction time on TRS yield by SCW treatment

The effect of reaction time on the TRS yield at different temperatures was studied in detail and shown in Fig. 2d. From the Fig. 2d, it can be seen that the yield of TRS increased with an increase in the reaction time up to certain period, thereafter degradation of the product was noticed.17,43 Fig. 2d depicts the highest yield of TRS i.e., 45.04% at 200 °C at 20 min reaction time. A subsequent increased in the reaction time results in the decrease of TRS yield and formation of more degraded products. On the other hand, the TRS yield was 35.40% and 36.25% when the reaction time was 10 min and 30 min at 200 °C, respectively. However, the maximum yield of glucose and fructose was 22.02% and 18.12% as obtained at 200 °C, at 20 and 30 min of reaction time, respectively. Further increase in the reaction time resulted in the conversion of degraded products (5-HMF, furfural, erythrose etc.). On the other hand, the optimized yield of hexose sugars was obtained as 39.97% (i.e., 22.02% of glucose and 17.76% of fructose) at 200 °C and 20 min of reaction time. It was confirmed that by increasing the solute loading yield of TRS was also found to be increased.

Fig. 1 and 2 reveals that the highest yield of TRS was obtained at the lower temperature (200 °C), but reaction time was longer (20 min). Hence, the reaction kinetics was carried in a batch reactor at entire reaction duration (i.e., 60 min) for a better understanding of the cellulose hydrolysis under SCW condition.

Comparison of hexose sugars production in batch and flow type reactors

The results obtained in this study using a batch type reactor have been compared with the available literature data obtained with the batch and flow type reactors. The production of hexose sugars (39.97%) compares well with the reported experiments of Zhao et al.14 where the maximum yield of hexose was found to be 39.5% at 280 °C, 10 MPa, and a residence time of 44 s. The flow type reactor produced a maximum hexose yield of 31.5% at 240 °C, 9 MPa, and 48.5 s residence time.41 Ehara and Saka performed the decomposition of cellulose in a flow type reactor. They reported a maximum yield of 35.6% (29.2% glucose and 6.4% fructose) under combined treatment (sub and supercritical water).13 They also reported a maximum yield of TRS was 22.7% under SCW treatment (at 280 °C, 40 MPa). This can be compared with the previous work by Kumar et al.8 where the hydrolysis of cellulose was conducted using a flow type reactor. The yield of hydrolysis products was found to be 24.4% (i.e., 16.1% oligomers, 2.8% cellobiose, 5% glucose and 0.5% fructose) at 303 °C, 27.6 MPa. Zhao et al.24 reported the yield of TRS was 37% at 378 °C. The comparative analysis showed that the batch type reactor requires less pressure and temperature (1.7 MPa and 200 °C) compared to a flow type reactor. On the contrary, the residence time as expected was lower in a flow type reactor.

During the hydrolysis process, reaction temperature, time, and pressure are the key parameters which influence the yield of cellulose hydrolysis. A higher temperature and pressure lead to a faster hydrolysis rate of hexose sugars, subsequently leading to a relatively lower yield of hexoses.14 Results of the study were also compared with our earlier findings on hydrolysis of bamboo under SCW condition in batch type reactor for the production of TRS.25 Slightly higher decomposition temperature and time was observed in bamboo hydrolysis (i.e., cellulose fraction in bamboo) compared to pure cellulose. This may be due to the hard structure of bamboo biomass; however a similar yield of TRS was also achieved at 220 °C and 30 min reaction time.

ANOVA analysis

According to the three level-three factor CCD design, the obtained values of response (TRS yield) are shown in Table 1. The results were analysed by Design-Expert Software. Summary output of the model fit revealed that the quadratic model was statistically significant for the obtained response. Results of the second-order polynomial model in the form of ANOVA for TRS yield are shown in Table 2. From the ANOVA analysis, it describes that the model is highly significant as per F-value (35.72) and with a low probability value i.e., (prob > F) is <0.0001. Thus, there is only a 0.01% chance that a model F-value having a larger noise. On the other hand, the effect of temperature (X1) and solute loading (X3); the second-order effect of temperature (X12) and time (X22) are the most significant terms on the TRS yield which has P-value <0.05. The lack of fit for an F-value is 17.30, which implies that the model is significant. There is only a 0.36% chance that a lack of fit F-value so large could occur due to a noise. On the other hand, the adequacy of a model can also be represented by the determination of regression coefficient (R2 = 0.97), which indicates that only 3% of the total variation was not explained by the model. The value of the adjusted regression coefficient (adj R2 = 0.94) also indicates that the model is highly significant.44 The predicted regression coefficient (pred R2 = 0.78) is in reasonable agreement with the adjusted regression coefficient. Simultaneously, a relatively low value of the coefficient of variation (C.V. = 14.83%) indicates good accuracy and reliability of the experiments.45 The detail regarding the statistical analysis is clearly reported by Lawson and Erjavec.46 The regression model equation resulting from ANOVA analysis in terms of coded factors for the production of TRS is given below
 
TRS yield (%) = 45.30 + 3.29X1 + 0.10X2 + 3.39X3 + 0.96X1X2 − 0.076X1X3 + 1.95X2X3 − 15.30X12 − 10.47X22 − 2.07X32 (5)
Where, X1, X2 and X3 are the coded factors of temperature (T), reaction time (t) and solute loading (SL), respectively. Furthermore, the relationship between the predicted and experimental TRS yield plot is shown in Fig. 4, which gave satisfactory correlation (R2 = 0.97). It was observed that the points around the diagonal line reveal that the deviation between the corresponding values is very less (Fig. 4). The predicted values of a response of these conditions using eqn (5) are given together with the experimental data (Table 1).
Table 2 Analysis of variances (ANOVA) for response surface quadratic model
Source Sum of squares DF Mean square F-Value P-Value (prob > F)
Model 4883.80 9.00 542.64 35.72 <0.0001
X1 148.00 1.00 148.00 9.74 0.0109
X2 0.14 1.00 0.14 0.012 0.9264
X3 157.13 1.00 157.13 10.34 0.0092
X1X2 7.32 1.00 7.32 0.48 0.5036
X1X3 0.05 1.00 0.05 0.0036 0.9570
X2X3 30.30 1.00 30.30 1.99 0.1882
X12 3373.32 1.00 3373.32 222.02 <0.0001
X22 1580.30 1.00 1580.30 104.01 <0.0001
X32 61.51 1.00 61.51 4.05 0.0719
Residual 151.94 10.00 15.19    
Lack of fit 143.63 5.00 28.73 17.30 0.0036
Pure error 8.30 5.00 1.66    
Cor total 5035.73 19.00      
Std. dev. 3.90   R2 0.97  
Mean 26.29   Adj R2 0.94  
C.V.% 14.83   Pred R2 0.78  
PRESS 1102.20   Adeq precision 17.71  


image file: c5ra20319h-f4.tif
Fig. 4 Predicted and actual values of TRS yield.

Fig. 5 represents the 3D response surface and contour plots of the interaction effect of independent variables on the TRS yield. The 3D surface and contour plots of the RSM is drawn as a function of two factors at a time, keeping the other factor at a fixed level (at zero level). These plots are very helpful in understanding the interaction effects of two variables on the response of the model.22,35 Fig. 5a indicates that the maximum percentage of TRS yield increases at the center of the region i.e., zero level, which involves the interaction between the temperature with time (200 °C and 20 min). In addition, changing the levels of temperature and time (other than zero level) reveals a decrease TRS yield. Fig. 5b and c shows the interaction between solute loading with temperature and solute loading with time on the TRS yield. As seen in Fig. 5b and c, varying the concentration of the solute loading (any level) at a fixed zero level of temperature and time enhances the yield of TRS. While varying the levels of affecting variables such as temperature and time (high or low) at a fixed zero level of solute loading, results in decreased TRS yield. This may be due to the formation of degraded products at a higher level.


image file: c5ra20319h-f5.tif
Fig. 5 Response surface (3D) and contour plots indicating the interaction effects of independent variables on total reducing sugars yield; (a) time and temperature, (b) solute loading and temperature, (c) solute loading and time.

Validation of predicted response at the optimum condition

The optimum condition for the production of TRS under the SCW condition was obtained at T = 203 °C, t = 21 min and SL = 5 g, while the predicted response of TRS yield was 46.67%. Additional experiments were performed at the model predicted optimum conditions to examine the suitability of the model equation. The TRS yield value obtained through the experimental result was 47.74% and was in close agreement with the model predicted TRS yield (i.e., 46.67%). The results of this study demonstrate that this model can be effectively applied to the optimization of the process variables under SCW condition for TRS production.

Structural changes in the cellulose samples before and after SCW treatment

FTIR spectroscopy. FTIR spectroscopy was used to determine the chemical changes in the cellulose structure and understanding the solubilisation process. The FTIR spectra for the treated (200, 225 and 250 °C) and untreated materials of cellulose are shown in Fig. 6 where the peaks of cellulose were confirmed by reported literature.8,27,29
image file: c5ra20319h-f6.tif
Fig. 6 FTIR spectra of untreated and treated cellulose sample under subcritical water treatment.

The peak in the 3247–3476.80 cm−1 region was due to OH-stretching indicating hydrogen bonds. The weak absorption peak at 2905 cm−1 arises from C–H stretching. The peak at 1705 cm−1, corresponds to the bending mode of absorbed water, and the peak at 1441.70 cm−1 was assigned to a symmetric CH2 bending vibration.47–49 This peak is also known as the “crystallinity peak”. The peak at 1370 cm−1 corresponds to the symmetry of C–H and O–C–O stretching. Similarly, the absorption peak at 1120 cm−1 corresponds to the symmetry of O–H, and C–O stretching. The FTIR absorption peak at 897 cm−1 was assigned to C–O–C stretching at β(1 → 4)–glycosidic linkages and designed as an “amorphous” absorption band.27,50,51 From Fig. 6, insignificant changes was observed in the bonding arrangements of the cellulose sample before and after treatment (at 225 °C), whereas, at 250 °C, there was an absence of functional groups (see Fig. 6). The presence of a band at 897 cm−1 suggests that the macromolecular structure of cellulose is partially destructed after the SCW treatment.52 After 225 °C, an absence of a peak at 897 cm−1 can be attributed to the breaking of β(1 → 4)–glycosidic bonds (cellobiose to glucose) between the cellobiose molecules. At this stage, glucose is formed which is further decomposed to other products. This is depicted at 250 °C where the yield of cellobiose is zero Fig. 2c. As per the present study, the yield of TRS is higher at 200 °C as compared to 225 °C and 250 °C (Fig. 2).

XRD analysis. XRD patterns of the treated and untreated samples were used to calculate the crystallinity of cellulose at different temperature ranges as shown in Fig. 7. The crystallinity index of cellulose is calculated by the diffraction intensities ratio of crystalline area (002) plane at 2θ = 22.5°, and amorphous region 2θ = 18.5° using eqn (1). It is tabulated in Table 3, where the crystallinity index of untreated cellulose was found to be 85.26%. After SCW hydrolysis, the crystallinity index of cellulose sample was found to be increased from 86.4% to 88.86% with an increase in the temperature 150–200 °C and then decreased with temperature (i.e., at 225 °C and 250 °C). These results indicate that the treated sample was associated with decrystallization which is due to a phase change occurring between 200 °C to 250 °C.8,29 Moreover, with an increase in the temperature, the kinetic energy and reactivity of cellulose molecules also showed a profound effect. Consequently, high-temperature results in the weakening of intermolecular hydrogen bonds. A change in reaction condition improves the solubilisation of cellulose in water.8 The highest crystallinity index value of 88.86% was obtained at 200 °C at which maximum reducing sugars was produced. Increase in the crystallinity index of treated sample indicates that the hydrolysis effect on amorphous zone was more compared to crystalline zone.53
image file: c5ra20319h-f7.tif
Fig. 7 XRD patterns of cellulose samples before and after treatment as a function of temperatures.
Table 3 Crystallinity index (C.I.) of cellulose samples
Sample Crl (%)
Untreated 85.26
Treated at 150 °C 86.40
Treated at 175 °C 87.86
Treated at 200 °C 88.86
Treated at 225 °C 69.00
Treated at 250 °C 28.34


Estimation of reaction kinetic parameters

The reaction kinetics of cellulose was carried out for the determination of rate constant and activation energy for cellulose hydrolysis under SCW condition. The kinetic data for the cellulose rate of reaction at 250 °C is depicted in Fig. 8. The slope of the line indicates the reaction rate constant for TRS formation. The rate constant for TRS formation and decomposition at other temperatures was also obtained in a similar manner. Here, the rate constants of TRS formation and decomposition was estimated by using a simplified kinetic model as reported in our previous work Mohan et al.25 Table 4 represents the rate constant values of TRS formation (k1) and decomposition (k2) for 60 min of reaction time (which includes 10, 20, 30, 40, and 50 min of reaction time data as well). From the observation of Table 4, it was noticed that the rate constant values of TRS formation and decomposition increases with an increase in temperature. At 200 °C, the rate of TRS formation was more as compared to the rate of decomposition. The yield for TRS is somewhat complementary to the degradation products as given in Fig. S1. Here, the rise in degradation products is sharp from 20 min and increases close to 12% at the end of the reaction. This is more pronounced for temperature 225 °C and 250 °C where the total degraded products reaches to 23%. On the contrary, at low-temperature operation (150 °C and 175 °C) produces less than 1% degraded products (Fig. S1), which makes the yield of TRS increases with reaction time (Fig. 2d). A similar trend was observed by Li et al.;54 Rogalinski et al.;12 Lin et al.55 and Mohan et al.,25 during their study on sugarcane bagasse, biopolymers, rice straw and bamboo hydrolysis, respectively. It is also observed that at temperature greater than 200 °C, the rate constant (k1) of TRS formation was decreased as compared to rate constant (k2) of TRS decomposition at 225 °C and 250 °C. Further, as an evident from Table 4, the kinetic rate constant k2 is around six and twenty times higher than k1 at 225 °C and 250 °C, respectively. This implies a higher rate of formation for degraded products which is around 23% as per Fig. S1. Thus, the yield of reducing sugars was lower than that of 200 °C.
image file: c5ra20319h-f8.tif
Fig. 8 Kinetic data for (a) reaction rate equation of cellulose hydrolysis at 250 °C and (b) Arrhenius equation.
Table 4 Reaction rate constants of TRS formation (k1) and decomposition (k2) as a function of temperatures for 60 min of reaction time
Rate constant 150 °C 175 °C 200 °C 225 °C 250 °C
k1 (min−1) 0.0025 0.0050 0.0084 0.0104 0.0121
k2 (min−1) 0.0021 0.0038 0.0045 0.0638 0.2134


According to the Arrhenius equation, the activation energy and pre-exponential factor was obtained via a logarithmic form of rate constant against temperature (Fig. 8). Form the Fig. 8, the activation energy of TRS formation and decomposition was obtained as 29.16 kJ mol−1 and 87.14 kJ mol−1 for 60 min of reaction time, respectively. These results propose that the hydrolysis of cellulose in batch type reactor takes place at the lower temperature, but with a longer residence time.

Conclusions

In summary, it was noticed that two main reactions were observed in the cellulose hydrolysis i.e., formation of reducing sugars from cellulose and decomposition of reducing sugars to degradation products. A three level-three factor CCD design was employed for the parameter optimization using RSM technique, which corresponds to a good agreement with experimental data. Under the optimal condition of T = 203 °C, t = 21 min and SL = 5 g, TRS yield achieved was 47.74%. From the results, cellulose hydrolysis under SCW treatment might be a suitable technique for the production of TRS at lower temperatures in batch mode, which can give a safe and economically favourable operation. Kinetics of this study can also provide vital evidence and key parameters for its application in the conversion of biomass waste into useful products. The optimised reaction condition also allows us to operate hydrolysis process at lower temperature and corresponding pressure (17 bar) for obtaining the highest yield of TRS from lignocellulosic biomass. Further, there is a need to focus on the diminution of reaction time for the production of higher total reducing sugar under batch type, which is under progress.

Acknowledgements

The work reported in this article was financially supported by a research grant received under Fast Track Scheme from Department of Science and Technology (DST), Government of India (No. SR/FTP/ETA-0018/2010). The authors thankfully acknowledge the Department of Chemical Engineering and Centre for Instrument Facility, (IIT Guwahati) for providing necessary facilities for carrying out this research.

References

  1. M. Mohan, C. Balaji, V. V. Goud and T. Banerjee, J. Solution Chem., 2015, 44, 538–557 CrossRef CAS .
  2. M. Mohan, V. V. Goud and T. Banerjee, Fluid Phase Equilib., 2015, 395, 33–43 CrossRef CAS .
  3. F. S. Asghari and H. Yoshida, Carbohydr. Res., 2010, 345, 124–131 CrossRef CAS PubMed .
  4. J. Wang, Y. Zheng and S. Zhang, in Clean Energy Systems and Experiences, ed. K. Eguchi, InTech, 2010, pp. 71–84 Search PubMed .
  5. R. M. N. Roque, M. N. Baig, G. A. Leeke, S. Bowra and R. C. D. Santos, Resour., Conserv. Recycl., 2012, 59, 43–46 CrossRef .
  6. V. B. Agbor, N. Cicek, R. Sparling, A. Berlin and D. B. Levin, Biotechnol. Adv., 2011, 29, 675–685 CrossRef CAS PubMed .
  7. J. Holm and U. Lassi, in Ionic Liquids: Applications and Perspectives, ed. P. A. Kokorin, InTech, 2011, pp. 545–560 Search PubMed .
  8. S. Kumar, R. Gupta, Y. Y. Lee and R. B. Gupta, Bioresour. Technol., 2010, 101, 1337–1347 CrossRef CAS PubMed .
  9. M. Sasaki, B. Kabyemela, R. Malaluan, S. Hirose, N. Takeda, T. Adschiri and K. Arai, J. Supercrit. Fluids, 1998, 13, 261–268 CrossRef CAS .
  10. B. M. Kabyemela, M. Takigawa, T. Adschiri, R. M. Malaluan and K. Arai, Ind. Eng. Chem. Res., 1998, 37, 357–361 CrossRef CAS .
  11. M. Sasaki, Z. Fang, Y. Fukushima, T. Adschiri and K. Arai, Ind. Eng. Chem. Res., 2000, 39, 2883–2890 CrossRef CAS .
  12. T. Rogalinski, K. Liu, T. Albrecht and G. Brunner, J. Supercrit. Fluids, 2008, 46, 335–341 CrossRef CAS .
  13. K. Ehara and S. Saka, J. Wood Sci., 2005, 51, 148–153 CrossRef CAS .
  14. Y. Zhao, W.-J. Lu, H.-T. Wang and D. Li, Environ. Sci. Technol., 2009, 43, 1565–1570 CrossRef CAS PubMed .
  15. T. M. Aida, N. Shiraishi, M. Kubo, M. Watanabe and R. L. Smith, J. Supercrit. Fluids, 2010, 55, 208–216 CrossRef CAS .
  16. O. Pourali, F. S. Asghari and H. Yoshida, Food Chem., 2009, 115, 1–7 CrossRef CAS .
  17. G. Zhu, X. Zhu, Q. Fan and X. Wan, J. Anal. Appl. Pyrolysis, 2011, 90, 182–186 CrossRef CAS .
  18. Y. A. Tsigie, L. H. Huynh, I. N. Ahmed and Y. H. Ju, Bioresour. Technol., 2012, 111, 201–207 CrossRef CAS PubMed .
  19. M. S. Galadima, A. S. Ahmed, A. S. Olawale and I. M. Bugaje, Nig. J. Basic Appl. Sci., 2012, 20, 368–372 Search PubMed .
  20. T. Y. Peng, M. M. Don and M. A. Tahrel, J. Phys. Sci., 2012, 23, 65–82 Search PubMed .
  21. C. A. Velis, C. Franco-Salinas, C. OSullivan, J. Najorka, A. R. Boccaccini and C. R. Cheeseman, Environ. Sci. Technol., 2014, 48, 7527–7535 CrossRef CAS PubMed .
  22. A. L. Ahmad, S. Ismail and S. Bhatia, Environ. Sci. Technol., 2005, 39, 2828–2834 CrossRef CAS PubMed .
  23. K. Ehara and S. Saka, Cellulose, 2002, 9, 301–311 CrossRef CAS .
  24. Y. Zhao, W.-J. Lu and H.-T. Wang, Chem. Eng. J., 2009, 150, 411–417 CrossRef CAS .
  25. M. Mohan, T. Banerjee and V. V. Goud, Bioresour. Technol., 2015, 191, 244–252 CrossRef CAS PubMed .
  26. B. M. Kabyemela, T. Adschiri, R. M. Malaluan and K. Arai, Ind. Eng. Chem. Res., 1999, 38, 2888–2895 CrossRef CAS .
  27. Y. H. Ju, L. H. Huynh, N. S. Kasim, T. J. Guo, J. H. Wang and A. E. Fazary, Carbohydr. Polym., 2011, 83, 591–599 CrossRef CAS .
  28. S. H. D. Cruz, B. S. Dien, N. N. Nichols, B. C. Saha and M. A. Cotta, J. Ind. Microbiol. Biotechnol., 2012, 39, 439–447 CrossRef CAS PubMed .
  29. I. Ozturk, S. Irmak, A. Hesenov and O. Erbatur, Biomass Bioenergy, 2010, 34, 1578–1585 CrossRef .
  30. K. Ninomiya, H. Soda, C. Ogino, K. Takahashi and N. Shimizu, Bioresour. Technol., 2013, 128, 188–192 CrossRef CAS PubMed .
  31. S. Kumar and R. B. Gupta, Energy Fuels, 2009, 23, 5151–5159 CrossRef CAS .
  32. M. K. Akitha Devi and P. Giridhar, J. Agric. Food Chem., 2014, 62, 3143–3149 CrossRef CAS PubMed .
  33. M. Homayoonfal, F. Khodaiyan and M. Mousavi, Food Chem., 2015, 174, 649–659 CrossRef CAS PubMed .
  34. K. Pakshirajan and J. Mal, Int. J. Hydrogen Energy, 2013, 38, 16020–16028 CrossRef CAS .
  35. S. Ghasempur, S. F. Torabi, S. O. R. Siadat, M. J. Heravi, N. Ghaemi and K. Khajeh, Environ. Sci. Technol., 2007, 41, 7073–7079 CrossRef CAS PubMed .
  36. C. Pinho, A. Melo, C. Mansilha and I. M. Ferreira, J. Agric. Food Chem., 2011, 59, 50–55 CrossRef CAS PubMed .
  37. R. Timung, M. Mohan, B. Chilukoti, S. Sasmal, T. Banerjee and V. V. Goud, Biomass Bioenergy, 2015, 81, 9–18 CrossRef CAS .
  38. R. Ooms, M. Dusselier, J. A. Geboers, B. Op de Beeck, R. Verhaeven, E. Gobechiya, J. A. Martens, A. Redl and B. F. Sels, Green Chem., 2014, 16, 695–707 RSC .
  39. M. Niu, Y. Hou, S. Ren, W. Wang, Q. Zheng and W. Wu, Green Chem., 2015, 17, 335–342 RSC .
  40. F. S. Asghari and H. Yoshida, Ind. Eng. Chem. Res., 2006, 45, 2163–2173 CrossRef CAS .
  41. Y. Zhao, H.-T. Wang, W.-J. Lu and H. Wang, Chem. Eng. J., 2011, 166, 868–872 CrossRef CAS .
  42. M. Rubio, J. F. Tortosa, J. Quesada and D. Gomez, Biomass Bioenergy, 1998, 16, 483–491 CrossRef .
  43. J. M. Prado, L. A. Follegatti-Romero, T. Forster-Carneiro, M. A. Rostagno, F. Maugeri Filho and M. A. A. Meireles, J. Supercrit. Fluids, 2014, 86, 15–22 CrossRef CAS .
  44. A. I. Khuri and J. A. Cornell, Response surfaces: designs and analyses, Marcel Dekker, New York, 2nd edn, 1987 Search PubMed .
  45. R. O. Kuehl, Design of Experoments: Statistical Principles of Research Design and Analysis, Duxbury Press, Pacific Grove, CA, 2nd edn, 2000 Search PubMed .
  46. J. S. Lawson and J. Erjavec, Modern Statistics for Engineering and Quality Improvement, Duxbury Press, 1st edn, 2001 Search PubMed .
  47. D. Stewart, H. M. Wilson, P. J. Hendra and I. M. Morrison, J. Agric. Food Chem., 1995, 43, 2219–2225 CrossRef CAS .
  48. R. C. Sun, X. F. Sun and X. H. Ma, Ultrason. Sonochem., 2002, 9, 95–101 CrossRef CAS PubMed .
  49. R. Liu, H. Yu and Y. Huang, Cellulose, 2005, 12, 25–34 CrossRef CAS .
  50. X. Lu and S. Saka, Biomass Bioenergy, 2010, 34, 1089–1097 CrossRef CAS .
  51. D. Ciolacu, F. Ciolacu and V. I. Popa, Cellul. Chem. Technol., 2011, 45, 13–21 CAS .
  52. A. Xu, X. Guo and R. Xu, Int. J. Biol. Macromol., 2015, 81, 1000–1004 CrossRef CAS PubMed .
  53. R. Sindhu, M. Kuttiraja, P. Binod, R. K. Sukumaran and A. Pandey, Renewable Energy, 2014, 62, 362–368 CrossRef CAS .
  54. C. Li, Q. Wang and Z. K. Zhao, Green Chem., 2008, 10, 177–180 RSC .
  55. R. Lin, J. Cheng, L. Ding, W. Song, F. Qi, J. Zhou and K. Cen, Bioresour. Technol., 2015, 186, 8–14 CrossRef CAS PubMed .

Footnote

Electronic supplementary information (ESI) available: The plots of degraded products have been reported in supplementary information along with this manuscript. See DOI: 10.1039/c5ra20319h

This journal is © The Royal Society of Chemistry 2015