Adsorption of perrhenate ion by bio-char produced from Acidosasa edulis shoot shell in aqueous solution

Hui Hu *, Bangqiang Jiang , Jubin Zhang and Xiaohui Chen
School of Chemical Engineering, Fuzhou University, Fuzhou, 350116, China. E-mail: huhui@fzu.edu.cn

Received 30th September 2015 , Accepted 20th November 2015

First published on 23rd November 2015


Abstract

The adsorption of perrhenate ions by the bio-char prepared from Acidosasa edulis shoot shell at 773 K is investigated under acidic conditions. The effects of some important parameters including initial pH (1.0–6.0), adsorbent dose (0.8–8.0 g L−1), contact time (2–480 min) and initial perrhenate ion concentration (10–100 mg L−1), on the recovery of perrhenate ions from aqueous solution in batch experiments are tested. The adsorbent was characterized by scanning electron microscopy equipped with an energy-dispersive X-ray spectroscopy (SEM-EDX), attenuated total reflection Fourier transform infrared spectroscopy (ATR-FTIR) and specific surface area analysis. The adsorption data are well described by Freundlich isotherm and maximum perrhenate ions adsorption capacities of 14.6 mg g−1 for Acidosasa edulis shoot shell bio-char under the optimum conditions. Kinetics of adsorption are found to follow the pseudo-second-order rate equation. Thermodynamic analysis suggested that the adsorption is an endothermic process and occurs spontaneously. FTIR analysis confirmed the major involvement of hydroxyl and carboxyl groups during perrhenate ion adsorption. Further, more than 94% of total rhenium adsorbed could be recovered using 0.1 mol L−1 KOH as a desorption medium. The mechanism analysis indicates that the outer-sphere complexes and electronic attraction mechanism were involved in the adsorption of perrhenate ions. The results indicate that Acidosasa edulis shoot shell waste derived bio-char can act as an effective adsorbent material for perrhenate ions recovery from copper smelting acidic wastewater.

1. Introduction

Rhenium (Re) is an important rare metal, the average abundance of rhenium less than one part per billion in the earth's crust.1 According to statistics, identified rhenium resources in the world are estimated to be as low as 2500 tonnes.2 Considering the declining rhenium resources and increasing demand, efforts are needed to search for new sources of rhenium.

Copper concentrate, the raw material used by the copper smelting industry, contains trace amounts of rhenium. In the pyrometallurgical processing of copper concentrates, more than 80% of rhenium is distributed in copper smelting acidic wastewater in the form of HReO4.3 Copper smelting acidic wastewater has high acidity (pH value ∼ 1) and low rhenium concentration (∼10 mg L−1). Currently, solvent extraction,4 ion exchange5 and chemical precipitation6 are the major methods that have been applied to recover rhenium from copper smelting acidic wastewater. However, these methods have their own inherent limitations such as the complexity of technological process, secondary pollution, high energy requirements and high cost in the processing of low concentration rhenium recovery. Adsorption, is a promising technique, and has proven to be a simple and economical technology for metals recovery.7,8 Various adsorbents have been developed and used for perrhenate ions recovery, including persimmon residua,9 orange peel,10 brown algae11 and impregnated resin.12 However, some of these adsorbents have low adsorption capacities or have limited regeneration and reuse abilities. Therefore, it is necessary to develop an adsorbent with high adsorption capacity and high-efficiency that is environmentally-friendly and can be applied to recover rhenium from copper smelting acidic wastewater.

Bio-char is a pyrogenic carbon material produced by combustion of biomass, such as wood and dairy manure under a limited oxygen atmosphere and at relatively low temperatures (<973 K).13–16 Bio-char has been widely applied in soil improvement,17 fertility enhancement18 and carbon sequestration.19 Moreover, Bio-char, due to its large specific surface area, porous structure, enriched surface functional groups and mineral components, makes it possible to be used as a potential adsorbent with high adsorption capacity to recover metal ions of low concentration from aqueous solutions.20 The conversion of agricultural and forest residues into bio-char by biomass carbonization technology to dispose sewage and recover metal ions is a recent resource utilization technology.

Acidosasa edulis is cultivated in the Fujian province of China, and the shoot output is approximately 20 tons per hectare. Acidosasa edulis shoot shell (AESS), a by-product of the bamboo shoot processing industry, is an abundant and renewable agricultural residue. However, it is usually eliminated by either burning or discarding it in the fields, causing severe environmental contamination. The investigation of AESS as an adsorbent to recover copper ions from sewage has been completed in our previous paper.21 The results showed that AESS could be used as an effective and low-cost biosorbent for Cu2+ removal from aqueous solutions, but its adsorption capacity is not strong enough. Similar results were also reported in the study of copper adsorption by Freely Suspended Sargassum,22 Exhausted Coffee23 and Pretreated Aspergillus Niger.24 In order to solve this problem, AESS was here made into Acidosasa edulis shoot shell bio-char (ASBC) as a potential adsorbent for the recovery of perrhenate ions. Until now, there are no reports on such a bio-char as an adsorbent for the recovery of rhenium.

The main objective of this study is to investigate the adsorption ability of Re(VII) by ASBC in aqueous solution. In this study, bio-char was characterized by scanning electron microscopy equipped with an X-ray detector (SEM-EDX), attenuated total reflection Fourier transform infrared spectroscopy (ATR-FTIR) and Brunauer–Emmett–Teller (BET) analysis. Batch experiments were used to study the adsorption of Re(VII) by ASBC. In addition, the kinetics and isotherms of rhenium adsorption onto ASBC were investigated to understand the underlying mechanism, and the thermodynamic functions variations (ΔH0, ΔS0, and ΔG0) are also evaluated and discussed.

2. Materials and methods

2.1 Bio-char preparation

AESS was collected from a market in Minhou County, Fujian Province, PR China. Firstly, the collected AESS was washed several times with tap water and then distilled water to clean off any dirt. Then the AESS was dried in the oven at 333 K for over 48 h. The dried AESS was ground and sieved through a 180 µm sieve. Finally, the resulting product was stored in an airtight container for later use.

The method of bio-char preparation could be described as follows.25 The ground AESS was placed in a ceramic crucible with a lid and pyrolyzed in a muffle furnace under oxygen-limited conditions. Feedstock was carbonized at the peak temperature of 773 K for 1 h. The resulting sample was cooled to room temperature inside the furnace and then washed with distilled water to neutral. The residue was dried at 353 K for 24 h to remove any moisture. The obtained bio-char was then stored in desiccators.

2.2 Bio-char characterization

The pore structure characteristics of the resulting bio-char were determined by nitrogen adsorption at 77 K using an automatic adsorption instrument with ±0.15% accuracy (ASAP2020M+C, USA). Prior to gas adsorption measurements, the samples were degassed at 523 K in a vacuum for 6 h. Adsorption data were obtained over a relative pressure, P/P0, ranging from approximately 10−5 to 1. The specific surface area of ASBC was measured by using the BET nitrogen adsorption isotherm method. The total pore volumes (Vt, m3 g−1) were estimated to be the liquid volumes of N2 at a high relative pressure near unity (∼0.99).

The surface morphology of the ASBC before and after adsorption was analyzed by SEM (HIROX SH-4000M). EDX analyses were conducted by using X-flash six model energy dispersive X-ray microanalysis system (Bruker Corporation, USA) attached to a SEM. Accelerating voltage was kept constant at 20 kV, to facilitate the emission of secondary X-rays.

ATR-FTIR (Thermo Nicolet iS50 ATR-FTIR, USA) was used to determine both active groups and changes in vibrational frequencies in the functional groups of the ASBC and ASBC loaded with rhenium. The spectra were obtained within the wavenumber range of 4000–400 cm−1 with a 4 cm−1 resolution. The influence of atmospheric water and CO2 was always subtracted. The baseline of the raw data was adjusted and then the modified data were normalized, by OMNIC 8.2.0.387 software (Thermo Scientific, USA). Before FTIR analysis, the samples were dried in an oven at 333 K for 24 h.

Bio-char surface acid functional group distribution was determined using the Boehm titration method.21 First of all, 50 mL of 0.05 mol L−1 titrating solution and 0.2 g of ASBC were added to a 100 mL conical flask. Then the flask was immersed in a constant-temperature water bath set at 298 K for 5 days, and was agitated manually three times a day. Afterwards, a sample of 10 mL was collected and 20 mL of 0.05 mol L−1 hydrochloric acid was added, finally all solutions were titrated with 0.05 mol L−1 NaOH solution with phenolphthalein as indicator. The titration was carried out in triplicate.

The procedure for the determination of point of zero charge (pHpzc):26 to a series of 20 mL glass vials, 10 mL 0.01 mol L−1 of NaCl aqueous solution was added. The pHi values of the solution were roughly adjusted from 2 to 12 by adding either 0.1 mol L−1 HCl or 0.1 mol L−1 NaOH. The pHi values of the solutions were then accurately noted. 0.1 g of ASBC was added to each vial, which was then securely capped immediately. The suspensions were shaken in an orbital shaker and allowed to equilibrate for 48 h. The pH values of the supernatant liquid were noted. The difference between the final pH (pHf) and initial pHi values (ΔpH = pHf − pHi) was plotted against the pHi. The point of intersection of the resulting curve at which ΔpH 0 gave the pHpzc.

The pH value of ASBC was measured in deionized water at a ratio of 1[thin space (1/6-em)]:[thin space (1/6-em)]20 w/v after being shaken for 24 h at 160 rpm (SHA-B, China).

2.3 Solution preparation

A stock solution containing 1 g L−1 Re(VII) was prepared by dissolving 0.1554 g analytical grade KReO4 in 100 mL deionized water. Then a series of Re(VII) solutions with various concentrations (20, 40, 60, 80, and 100 mg L−1) were prepared by successive dilution. All the experimental solutions were prepared by diluting the stock solution with deionized water, and the solution pH was adjusted by the addition of 0.1 mol L−1 HCl or 0.1 mol L−1 NaOH.

2.4 Batch adsorption studies

The adsorption experiments of Re(VII) on ASBC were performed by using a batch equilibration technique. Each experiment was conducted on an orbital shaker at 160 rpm for 8 h at 298 K in 20 mL glass vials containing 10 mL of adsorbate solution at optimum pH (pH = 1). After agitation the contents of the vials were filtered. The Re(VII) concentration in the filtrate was subsequently determined by UV spectrophotometry.

The effect of solution adsorbent dose (range 0.8–8.0 g L−1), contact time (2–480 min), pH (1.0–6.0) and temperature (298, 303 and 308 K) on the adsorption rate and capacity were studied.

The test for adsorbent dosage effect was carried out at different concentrations in the range of 0.8 to 8.0 g L−1 with the initial adsorbate solution at pH = 1, suspensions were shaken at 298 K for 480 min.

The optimum contact time was determined by varying the contact time in the range of 2–480 min at a constant adsorbent dosage (3 g L−1) and temperature (298 K) for 480 min.

The effect of pH on adsorption of Re(VII) by ASBC was investigated: 10 mL of 20 mg L−1 KReO4 samples at different pH (1.0–6.0) were placed in 20 mL empty glass vials and 0.03 g of ASBC was then added to each vial.

For adsorption isotherms, a series of 20 mL glass vials were filled with 10 mL Re(VII) solution at varying concentrations (20–100 mg L−1), and maintained at the desired pH (pH = 1) and adsorbent dosage (3 g L−1). Then an equal amount of ASBC was added into each glass vial. After the optimum uptake time (480 min) the concentrations of rhenium ions were calculated by taking the difference in their initial and final concentrations. The experiments were repeated at 298, 303 and 308 K.

To obtain adsorption kinetic data, the adsorbent (3 g L−1) was suspended in rhenium solutions (20 mg L−1) at three different temperatures, i.e., 298, 303 and 308 K, wherein the extent of adsorption was analyzed at regular time intervals.

The amount of Re(VII) adsorbed per unit mass of the adsorbent was evaluated by using the following mass balance equation,

 
image file: c5ra20235c-t1.tif(1)
where qt (mg g−1) is the adsorption capacity of the adsorbent. Initial, final concentrations of the metal ions are denoted by C0, Ct, respectively. W is the mass of the adsorbent (g) taken in V volume of solution (L).

The percent recovery of Re(VII) was calculated as follows:

 
image file: c5ra20235c-t2.tif(2)
where Ci is the initial concentration of adsorbate and Cf stands for the final concentration measured after adsorption.

2.5 Regeneration and reuse of adsorbent

In order to determine the reusability of the adsorbent, consecutive adsorption–desorption cycles (Fig. S1) were repeated three times. For this, 0.1 mol L−1 KOH, was used as the desorbing agent.

In each cycle, ASBC was loaded with rhenium ions by adding 0.03 g of dried ASBC to 10 mL of metal solution with a constant concentration of 20 mg L−1 at pH value of 1 at 303 K. The suspension was shaken for 8 h at a speed of 160 rpm. Then the ASBC loaded with rhenium was placed in the desorbing medium and was constantly stirred on a rotatory shaker at 160 rpm for 24 h at 303 K. After each cycle of adsorption and desorption, the ASBC biomass was filtered and the filtrate was used to determine the Re(VII) concentration and reconditioned for adsorption in the succeeding cycle. The desorption performance was determined as follows:

 
image file: c5ra20235c-t3.tif(3)
where ε is the desorption performance, C0, C1 and C2 are the initial, adsorption and desorption equilibrium concentrations of Re(VII); V1, V2 are the volume of adsorption and desorption, respectively.

2.6 Adsorption models

2.6.1 Kinetic models. For fitting of kinetic data, the models of Pseudo-first-order,27 Pseudo-second-order,28 Elovich29 and intra-particle diffusion30 were used. The linear equations are given as follows:

(a) Pseudo-first-order model (PFO)

 
image file: c5ra20235c-t4.tif(4)

(b) Pseudo-second-order model (PSO)

 
image file: c5ra20235c-t5.tif(5)
 
h = k2qe2(6)

(c) Elovich model

 
image file: c5ra20235c-t6.tif(7)

(d) Intra-particle model (IPD)

 
qt = kpt0.5 + C(8)
where qt and qe are the amount of metal ions adsorbed at any given time (t) and at equilibrium (mg g−1), respectively. k1 (min−1) is the rate constant for the PFO model; k2 (g mg−1 min−1) is the rate constant for the PSO; h (mg g−1 min−1) is the initial adsorption rate at t = 0; α (mg g−1 min−1) is the initial sorption rate constant; and β (g mg−1) is related to the extent of surface coverage and activation energy for chemisorption; kp (mg g−1 min−0.5) is the intra-particle diffusion rate constant.

The pseudo-first order kinetic model was based on the assumption of physico-sorption process,31 while the pseudo-second order model was based on the assumption that the rate-limiting step may be chemical sorption involving valency forces through sharing or exchange of electrons between the adsorbent and adsorbate.28 The Elovich equation is a valuable tool to examine any changes of surface reactivity in the adsorbent during the whole course of reaction time. Any changes of the reactivity of sorption sites on the surface should be reflected in breaks of the Elovich linear plot.29 It has been used not only for describing reactions involving chemisorption of gases on a solid surface, but also for simulating sorption kinetics in liquid phase.32 The intra-particle diffusion model is used to determine the rate limiting step of the adsorption kinetics. When the intra-particle mass transfer resistance is the rate limiting step, then the sorption process is described as being particle diffusion controlled. If the plot of qt versus t0.5 satisfies the linear relationship and passes through the origin, then the sorption process is controlled by intra-particle diffusion only. However, if the data exhibits multi-linear plots, then the sorption process may be influenced by two or more steps.21,29

2.6.2 Isotherm models. Adsorption isotherms are mainly used to describe how adsorbate ions or molecules interact with adsorbent surface sites and the degree of accumulation onto the adsorbent surface at a constant temperature. In this study, three two-parameter isotherm equations, namely, Langmuir,33 Freundlich,34 Temkin35 have been used to fit the experimental data. The equations are given as follows:

(a) Langmuir isotherm model

 
image file: c5ra20235c-t7.tif(9)

(b) Freundlich isotherm model

 
qe = KfCe1/n(10)

(c) Temkin isotherm model

 
image file: c5ra20235c-t8.tif(11)
where Ce is the equilibrium concentration of adsorbate (mg L−1); qe is the equilibrium amount of metal adsorbed on ASBC (mg g−1); qmax is the maximum loading capacity of ASBC (mg g−1); KL is the Langmuir isotherm constant related to the energy of adsorption (L mg−1); Kf is the Freundlich isotherm constant related to the adsorption capacity (mg1−(1/n) L1/n g−1); 1/n is the heterogeneity factor; A is a Temkin isotherm equilibrium binding constant which takes into account the interactions between the adsorbate and the adsorbent (L mg−1); R is the universal gas constant (8.314 J mol−1 K−1); b is the Temkin isotherm constant related to heat of adsorption (J mol−1); T is the absolute temperature (K); and M is the molar mass of metal ions.

The Langmuir isotherm model describes quantitatively the formation of a monolayer adsorbate on the outer surface of the adsorbent and after that no further adsorption takes place. In addition, Langmuir represents the equilibrium distribution of adsorbate between the solid and liquid phases.36 The Freundlich isotherm equation is an empirical equation used for the description of multi-layer adsorption with interaction between adsorbed molecules, and it is widely used to describe adsorption onto a heterogeneous surface and a multi-layer sorption occurs on the surface.34 The Temkin isotherm is based on the assumption that the decline of the heat of sorption as a function of temperature is linear rather than logarithmic.37

2.6.3 Thermodynamic models. To describe thermodynamic behavior of the adsorption of Re(VII) onto ASBC, thermodynamic parameters such as Gibbs free energy change (ΔG0), enthalpy change (ΔH0) and entropy change (ΔS0) for the adsorption systems were calculated by using the following equations:
 
ΔG0 = −RT[thin space (1/6-em)]ln(K0)(12)
 
ΔG0 = ΔH0TΔS0(13)
 
image file: c5ra20235c-t9.tif(14)
where R is the gas constant (8.314 J (mol K)−1); T is the absolute temperature (K); K0 is Langmuir constant; ΔG0 is the standard free energy change of the ion exchange (kJ mol−1); ΔH0 is the enthalpy (kJ mol−1); ΔS0 is the entropy (J mol−1 K−1).

3. Results and discussion

3.1 Characterization of ASBC

3.1.1 Physico-chemical characteristics. The physico-chemical characteristics of the ASBC used in this experiment are shown in Table S1. The pH values of the ASBC is alkaline, which may be influenced by two factors as follows: (i) organic functional groups and (ii) inorganic alkalis.38 ASBC had the higher specific surface area (6.368 m2 g−1), compared to peanut shell derived bio-char (5.06 m2 g−1) at the same temperature,39 which may contribute to the Re(VII) adsorption. The pHpzc was used to assess the surface properties of the ASBC adsorbent. An adsorbent surface is positively charged at pH < pHpzc and is negatively charged at pH > pHpzc. The pHpzc of the ASBC adsorbent was found to be 7.74 (Table S1). Thus, ASBC surfaces become positively charged in acidic solution, which will help perrhenate anion adsorption.

Table S2 compiles the results of surface acidic functional groups of ASBC detected by Boehm titration. These polar functional groups may form active sites for adsorption on the material surface. Results of active sites determination on ASBC reveal that it contains 0.0381 mmol g−1 of carboxylic group, 0.0193 mmol g−1 of lactone group, 0.3941 mmol g−1 of phenolic group and a total acidity 0.4515 mmol g−1. These acidic functional groups could transform into –COOH2+, –OH2+ or [double bond, length as m-dash]C[double bond, length as m-dash]OH+ by reaction with H+ in the solution. The more that these cations exist on the ASBC surface, the better the recovery of perrhenate anion via adsorption from aqueous solution. The predominant acid group in ASBC is the phenolic group, the carboxylic group comes second, both of them contribute to the Re(VII) adsorption on ASBC.

3.1.2 SEM-EDX analysis. The SEM analysis of ASBC reveals important information about the surface morphology (Fig. 1). Fig. 1 shows porous and rough surfaces with a disorganized structural pattern of ASBC and the pore sizes are inconsistent, which is of importance for liquid–solid adsorption processes.40 The pores can be attributed to escaping volatiles during high temperature decomposition.41
image file: c5ra20235c-f1.tif
Fig. 1 SEM micrograph of (a and b) ASBC, (c) ASBC-Re, and (d) X-ray elemental mapping.

In the present study, energy dispersive X-ray analysis of the raw as well as rhenium adsorbed adsorbents viz. ASBC was performed in order to study the surface changes of the elements. As shown in Fig. S2, carbon and oxygen are the main constituents of ASBC. Nitrogen, potassium, silicon and sodium are also present in low proportions. In the EDX spectrum of ASBC after Re(VII) adsorption, a new peak showing Re(VII) emerged, confirming rhenium adsorbtion. Furthermore, the Re elemental mapping shows the irregular presence of rhenium on bio-char. That irregular contribution indicates the heterogeneous structure.

3.1.3 FT-IR analysis. The FTIR spectrum is carried out as a qualitative analysis to investigate the main functional groups that are involved in the adsorption process. Fig. 2 shows the ATR-FTIR spectra of ASBC before and after adsorption of Re(VII). In the case of ASBC, the spectra displays several vibrational bands indicating the complex nature of the materials. As shown in Fig. 2, the absorption peak around 3340 cm−1 can be assigned to the O–H stretching vibration.14 The peak at 1700 cm−1 is the C[double bond, length as m-dash]O stretching vibration of carboxyl groups. The peak at 1571 cm−1 can be assigned to the C[double bond, length as m-dash]C stretching vibration of aromatic rings.42 Bands at 1061 and 1359 cm−1 may indicate the stretching vibration of O–H and C–O stretching vibration of carboxylic groups.14 The band observed at 881 and 749 cm−1 was assigned to the C–H stretching vibration of aromatic compounds.39
image file: c5ra20235c-f2.tif
Fig. 2 ATR-FTIR spectra for ASBC and ASBC loaded with rhenium.

Compared with the spectra of ASBC, the intensity of the O–H stretching peak of the ASBC at 3340 cm−1 has been found to increase after adsorption, which indicates significant hydrogen-bonding interactions in acidic conditions. A new band close to 1700 cm−1 appears after ASBC is loaded with rhenium, the peaks around 1359 cm−1 diminish, and the peak at 1061 cm−1 increases, indicating that carboxyl groups take part in the adsorption process. The intensities of bands at 881, 749 cm−1 gradually increase indicating the increase of aromatic fractions and the enhancement of the carbonization degree.43

3.2 Effect of solution pH

Earlier research on metal adsorption has indicated that pH is quite an important parameter affecting the adsorption process.44–46 The plot of Re(VII) adsorption capacity versus pH is shown in Fig. 3. A sharp increase is observed at pH less than 2.0, showing that the ASBC has a high affinity for Re(VII) at high acid concentrations, and when pH > 2.0, the adsorption capacity decreases significantly. These phenomena can be explained as follows.
image file: c5ra20235c-f3.tif
Fig. 3 Effect of pH on ASBC Re(VII) adsorption. Conditions: adsorbent dosage, 3 g L−1; initial Re(VII) concentration, 20 mg L−1; contact time, 480 min; 298 K.

In the aqueous phase, rhenium is stable, and the dominant species is the perrhenate anion (ReO4).47 The behavior for better adsorption at low pH by ASBC may be attributed to the large number of H+ ions which protonate the ASBC surface (eqn (15) and (16)). That results in a strong electrostatic attraction between the positively charged adsorbent surface and ReO4 leading to higher adsorption. The adsorption mechanism can be expressed as eqn (15)–(18), which has been confirmed by FTIR spectra and thermodynamic analyses. As the pH of the system increases, the number of negatively charged sites increases. A negatively charged surface site on these adsorbents does not favor the adsorption of Re(VII) due to the electrostatic repulsion.48 This explains the decrease in the adsorption of Re(VII) ions at higher pH values. Therefore, all the other experiments in this study were carried out at an optimum initial pH of 1.0 so as to achieve maximum metal adsorption capacity.

 
X–OH + H+ ↔ X–OH2+(15)
 
X–COOH + H+ ↔ X–COOH2+(16)
 
X–OH2+ + ReO4 ↔ X–OH2+⋯ReO4(17)
 
X–COOH2+ + ReO4 ↔ X–COOH2+⋯ReO4(18)

It was noticed that the pH of the solution after adsorption slightly increased, which was mainly attributed to: (i) the H+ participating in the functional groups protonation (eqn (15) and (16)); (ii) H+ was neutralised by alkaline ASBC; and (iii) by the mineral ash from pyrolysis.38

3.3 Effect of adsorbent dosage contact time

The amount of adsorbent is an important factor to enable effective metal adsorption, and determine the adsorbent–adsorbate equilibrium of the system.49 In order to determine the effect of the ASBC dose on Re(VII) adsorption, ASBC in the range of 0.8–8.0 g L−1 was subjected to adsorption experiments and the results are given in Fig. 4.
image file: c5ra20235c-f4.tif
Fig. 4 Effect of adsorbent dosage on the uptake of Re(VII) onto ASBC. Conditions: initial Re(VII) concentration, 20 mg L−1; pH, 1.0; 298 K.

As Fig. 4 shows, the adsorption amount decreases with an increase in adsorbent dose. On the other hand, the extent of the adsorption increased at first with increasing adsorbent and remained almost constant at doses higher than 6 g L−1, that is, adsorption reached saturation. This result could be explained as a consequence of partial aggregation of ASBC at higher concentrations, which leads to the decrease in effective surface area for adsorption.50 Thus, it is reasonable to choose an adsorbent dosage of 3 g L−1 for all further experiments to ensure higher adsorption capacity and adsorption rate.

3.4 Effect of contact time

The effect of contact time on ASBC adsorption of Re(VII) is shown in Fig. 5. It is apparent that an increase in contact time from 2 to 120 min enhances adsorption considerably, due to the strong attraction between rhenium ions resulting from the large number of binding sites on the surface of ASBC; the initial rapid adsorption then gives way to a very slow approach to equilibrium. There are two reasons for this: on the one hand, as the binding sites on ASBC surface are used up, it will take more time to enter the adsorbent interior and combine with the active sites;21 on the other hand, since active adsorption sites in a determined system have a fixed number and each active site can adsorb only one metal ion in a monolayer, the metal uptake by the adsorbent surface will be rapid at the beginning, and then slow down as the competition for decreasing availability of active sites intensifies.51 These results show that a contact time of 480 min will be sufficient for the removal of Re(VII) ions by ASBC under the adsorption conditions determined as optimal in this study.
image file: c5ra20235c-f5.tif
Fig. 5 Effect of contact time on the Re(VII) capacity of ASBC. Conditions: adsorbent dosage, 3 g L−1; initial Re(VII) concentration, 20 mg L−1; pH, 1.0; 298 K.

3.5 Adsorption kinetics

To design and control the adsorption process, it is necessary to study the adsorption process rate and dynamic behavior. In general, adsorption on an adsorbent from the aqueous phase involves three steps: (i) the transport of the adsorbate from the bulk phase to the exterior surface of the adsorbent (film diffusion); (ii) the transport into the adsorbent by either pore diffusion and/or surface diffusion (intra-particle diffusion) and; (iii) the adsorption on the surface of the adsorbent.52 The slowest of these steps, that is, the rate-limiting step, determines the overall rate of the adsorption process. Research shows that adsorption kinetics has a strong dependence on the physical and/or chemical characteristics of the bio-char which also influences the sorption mechanism.39,53

Adsorption kinetics of Re(VII) on the ASBC were studied by monitoring the concentration of metal ions at various temperatures (298, 303 and 308 K). The conformity between experimental data and the model predicted values was expressed by the adjusted correlation/determination coefficients (Radj2 values close or equal to 1). A relatively high Radj2 value indicates that the model successfully describes the kinetics of the adsorption.

The parameters of kinetic models were obtained with the linear fitting procedure and are listed in Table S4. The appropriate plots of the PSO and IPD kinetic model are shown in Fig. S3. The PFO model did not adequately describe the adsorption results of Re(VII) onto the ASBC due to low correlation coefficients between the calculated qe values and the experimental values. Taking the R2 values into account, a better fit was achieved when the PSO model was used. The result also reconfirms that the PSO model is suitable to explain the adsorption of low molecular weight compounds on small adsorbent particles.54 The values of the rate constants (k2) and initial adsorption rate (h) are varied as the temperature increased from 298 to 308 K, which shows that the adsorption process highly depends on temperature.

As for the Elovich equation (chemisorption control), the determination coefficient is lower than the PSO equation. This situation indicates that the Elovich equation might not be adequate to describe the adsorption model, since the adsorption process may not be controlled by chemisorption completely.

The possibility of application of the intra-particle diffusion process was also evaluated by using the Weber and Morris model (eqn (8)). In order to establish whether the transport of Re(VII) ions from the solution into the pores of the ASBC is the rate controlling step, the relationship between qe and t1/2 was plotted. The intra-particle diffusion plot is shown in Fig. S3(b). It can be observed that a straight line was not obtained. Therefore, it cannot be considered that the intra-particle diffusion was the controlling step for the adsorption Re(VII) onto ASBC. However, it should be noted that for obtaining the relations on the plots there are three separate parts attributed to the film diffusion, the intra-particle diffusion and the equilibrium stage. In the first stage, the available active sites on the external surface of the ASBC are sufficient and the adsorption rate is rapid, which suggests the film diffusion is the rate-determining step. However, active sites on the external surface of ASBC are occupied gradually, the rhenium ions have to traverse farther and deeper into the pores and encounter much larger resistance, which indicates that the intra-particle diffusion is the rate-determining step during this period. The third part is attributed to the final equilibrium stage where intra-particle diffusion starts to slow down due to extremely low adsorbate concentrations in the solution. Thus, the adsorption of Re(VII) with ASBC adsorbent occurred in more than one stage that can occur simultaneously. The rate of uptake might be limited by the size of the adsorbate molecule or ion, the concentration of the adsorbate and its affinity to the adsorbent, the diffusion coefficient of the adsorbate in the bulk phase, the pore size distribution of the adsorbate, and the degree of mixing. It was also found that the values of the intra-particle diffusion rate k2 are smaller than the film diffusion rate k1 as presented in Table S4. Additionally, the comparison of the intercept (C2) values, which gives an idea of the boundary layer thickness, i.e., the larger the intercept, the greater the boundary layer effect. All in all, the PSO kinetic model provides the best correlation for all of the adsorption processes than the PFO, Elovich equations and IPD. This suggests that the adsorption system belongs to the second-order equation, based on the assumption that the rate limiting step may be chemical sorption or chemisorption involving valency forces through sharing or exchange of electrons between adsorbate and adsorbent.55,56

3.6 Adsorption isotherms

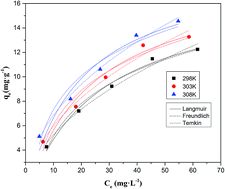
The adsorption isotherm data for Re(VII) onto the ASBC has been plotted in Fig. S4 and isotherm constants have been depicted in Table S5. Determination coefficients suggest that the Freundlich model fits the data better than the Langmuir and Temkin model. This result illustrates that it can predict rhenium adsorption equilibrium on ASBC more accurately, and the multi-layer sorption of Re(VII) mainly occurs on heterogeneous surfaces of ASBC. The Langmuir and Temkin equations can also predict the rhenium adsorption equilibrium on the ASBC surface well, but not as well as the Freundlich equation.

The constants Kf and n in the Freundlich equation were calculated from eqn (10), and tabulated in Table S5. According to the study by Febrianto et al.,57 if the value of n is between 1 and 10, the adsorption is favorable. It can be observed that the value of n which is between 1 and 10 (Table S5) shows the favorability of adsorption of Re(VII) onto ASBC.58 Besides, the Freundlich constants Kf and n also increased with temperature, which indicates that the adsorption capacity and intensity were growing.

In this study, the values of sorption coefficient Kd (Kd = Qe/Ce, L g−1) (Table S5) at different rhenium concentrations (20, 60 and 100 mg L−1) were calculated to compare their sorption capacities. Table S5 shows that with increasing Re(VII) concentration, the Kd values for ASBC greatly decrease because Re(VII) adsorption on the ASBC was nonlinear. From Fig. S4 we observe that the uptake of rhenium ions increases with the rise in temperature from 298, 303, to 308 K. This result also shows that the adsorption was endothermic in nature. This may be attributed to: (1) the diffusion rate of the adsorbate increasing with temperature; (2) the de-protonation reaction increasing with temperature, which makes more active sites (hydroxyl, carboxyl) available for Re(VII) recovery; (3) the thickness of the boundary layer around the adsorbent decreasing with temperature, which makes mass transfer resistance decrease.59,60

3.7 Thermodynamic studies

The thermodynamic parameters of the adsorption process were calculated by eqn (12)–(14). The results are listed in Table 1. It can be seen that all the ΔG0 values were negative, which suggests the feasibility of the process and the spontaneous nature of the adsorption. Generally, the ΔG0 value is in the range of 0 to −20 kJ mol−1 indicating physical adsorption and −80 to −400 kJ mol−1 chemical adsorption.61 In this study, the ΔG0 values are in the range of −26.18 to −28.73 kJ mol−1, indicating that rhenium adsorption on ASBC could be a combination of physisorption and chemisorption. The decrease in ΔG0 with an increase in temperature indicates that the reaction is more favorable at higher temperatures.
Table 1 Thermodynamic parameters for the adsorption of Re(VII) on ASBC
Temperature 298 K 303 K 308 K
ΔG0 (kJ mol−1) −26.18 −27.35 −28.73
ΔH0 (kJ mol−1)   11.85  
ΔS0 (J mol−1 K−1)   127.46  


The positive ΔH0 value suggests the endothermic nature of the adsorption, which is in agreement with the experimental observations. That is to say an input of energy is required to bring about the bond formation on Re(VII) ions on ASBC. This is because the bonding is short-range and as a result, energy is needed to overcome the repulsive force of attraction as ions bind a short distance from the adsorbent. This is the reason why the optimal temperature was relatively high (308 K), as an external source of heat energy is required for the endothermic reaction to occur.62 In this study, the ΔH0 value is 11.85 kJ mol−1, indicating that the formation of complexes between functional groups and perrhenate ions is mainly outer-sphere surface complexation (eqn (19)). Because inner-sphere complexes refer to the perrhenate ions and the functional groups of the adsorbent and the adsorbate forms a direct coordinate-covalent bond with surface functional groups on the variable charge surface, the interaction is strong and slow, while, for outer-sphere complexes, the interaction between the surface functional group is weak and rapid (Fig. 6).60,63


image file: c5ra20235c-f6.tif
Fig. 6 Conceptual illustration of the affinity between adsorption sites and Re(VII).

The positive value of ΔS0 shows the increased randomness at the solid/solution interface during the adsorption of Re(VII) on the ASBC. This indicates strong affinity of the adsorbent for Re(VII) ions and there may be some structural changes in both the adsorbate and adsorbent during the adsorption process.62

3.8 Regeneration and recovery studies

The regeneration of the adsorbent is one of the key factors for assessing of its potential for commercial applications. 0.1 mol L−1 KOH desorption agent was used to recover the Re(VII) ions from the adsorbent. Higher than 94% of the adsorbed Re(VII) ions were desorbed from the adsorbent. It is clear that the recovery of rhenium in this study is high, probably because the OH ions could easily replace rhenium anions from the adsorbent sites on ASBC. This phenomenon was consistent with the results found by Lou et al.,47 Shan et al.,10 and Xiong et al.,11 indicating the strong affinity between OH ions and ASBC.

As shown in Fig. 7, the adsorption capacity of ASBC decreased slightly with 0.1 mol L−1 KOH as an eluent after three cycles (from the initial 4.42 mg g−1 to the final 3.78 mg g−1). This might be attributed to the amount of biomass lost and/or the damage on the surface of the adsorbent due to the continuous contact with the desorbing agent during the adsorption–desorption process. These results indicate that the ASBC biomass could be used repeatedly in Re(VII) adsorption studies without any detectable loss in the total adsorption capacity. Therefore, ASBC can be used as a stable adsorbent for Re(VII) recovery.


image file: c5ra20235c-f7.tif
Fig. 7 Reusability of ASBC biomass with repeated adsorption–desorption cycles. Conditions: pH, 1; adsorbent dosage, 3 g L−1; initial Re(VII) concentration, 20 mg L−1; contact time, 480 min; 303 K.

3.9 Comparison of various adsorbents for Re(VII) ion adsorption

Table 2 demonstrates a comparison between Re(VII) ion adsorption capacity of various types of adsorbents and ASBC. It is clear that the Re(VII) ion uptake capacity of ASBC is larger. This could be due to the number of active groups available for metal ion adsorption and the different sorption mechanisms involved. These results also indicate that ASBC can be used as a high efficiency adsorbent in water treatment to recover rhenium from aqueous solutions.
Table 2 Comparison of maximum adsorption capacities of various adsorbents for Re(VII) ionsa
Adsorbents Adsorption capacity (mg g−1) References
a Conditions: initial Re(VII) concentration, 20 mg L−1; pH, 1.0.
Cross-linked persimmon residua (sulfuric acid) 0.10 9
Cross-linked astringent persimmon (formaldehyde) 1.30 64
La(III)-loaded orange peel gels 0.42 10
Zr(VI)-loaded orange peel gels 0.60
Cross-linked brown algae (sulfuric acid) 1.01 11
Corn stalk 0.9 61
ASBC 5.13 Current study


4. Conclusions

This study investigates the ability of bio-char derived from AESS to adsorb Re(VII) from aqueous solution. The experimental evidence shows the strong effect of the operating variables (adsorbent dosage, contact time, pH value, and temperature) on adsorption performance of ASBC biomass. Adsorption equilibrium is well described by Freundlich adsorption isotherms. Adsorption rate is fast and its kinetics are well represented by a PSO model. Thermodynamic parameters show that the adsorption of Re(VII) ions onto ASBC is feasible, spontaneous and endothermic under the studied conditions. The interactions between the metal ion and the functional groups on the cell wall surface of the biomass were confirmed by FTIR analysis, which indicates the participation of hydroxyl and carboxyl groups in the rhenium adsorption. Taken into consideration the findings above, it can be stated that ASBC could be used as an efficient biomass for the treatment of Re(VII) containing aqueous solutions.

References

  1. P. Voudouris, V. Melfos, P. G. Spry, L. Bindi, R. Moritz, M. Ortelli and T. Kartal, Minerals, 2013, 3, 165–191 CrossRef CAS.
  2. S. Jasinski, US Geological Survey, Department of the Interior, http://minerals.usgs.gov/minerals/pubs/mcs/2015/mcs2015.pdf, (April 29, 2015), 2015, 130–131.
  3. Z. S. Abisheva and A. Zagorodnyaya, Hydrometallurgy, 2002, 63, 55–63 CrossRef CAS.
  4. Z. S. Abisheva, A. N. Zagorodnyaya and N. S. Bekturganov, Hydrometallurgy, 2011, 109, 1–8 CrossRef CAS.
  5. C. D. Anderson, P. R. Taylor and C. G. Anderson, Miner. Metall. Process., 2013, 30, 59–73 CAS.
  6. H. G. Dong, Y. Liu, X. X. Fan, J. C. Zhao, J. L. Chen, B. J. Li and Y. D. Wu, Nonferrous Met., 2013, 30–33 Search PubMed.
  7. T. Wang, W. Liu, L. Xiong, N. Xu and J. Ni, Chem. Eng. J., 2013, 215–216, 366–374 CrossRef CAS.
  8. M. Inyang, B. Gao, Y. Yao, Y. Xue, A. R. Zimmerman, P. Pullammanappallil and X. Cao, Bioresour. Technol., 2012, 110, 50–56 CrossRef CAS PubMed.
  9. Y. Xiong, C. Chen, X. Gu, B. K. Biswas, W. Shan, Z. Lou, D. Fang and S. Zang, Bioresour. Technol., 2011, 102, 6857–6862 CrossRef CAS PubMed.
  10. W. Shan, D. Fang, Z. Zhao, Y. Shuang, L. Ning, Z. Xing and Y. Xiong, Biomass Bioenergy, 2012, 37, 289–297 CrossRef CAS.
  11. Y. Xiong, J. Xu, W. Shan, Z. Lou, D. Fang, S. Zang and G. Han, Bioresour. Technol., 2013, 127, 464–472 CrossRef CAS PubMed.
  12. J. K. Moon, Y. J. Han, C. H. Jung, E. H. Lee and B. C. Lee, Korean J. Chem. Eng., 2006, 23, 303–308 CrossRef CAS.
  13. S. P. Sohi, Science, 2012, 338, 1034–1035 CrossRef CAS PubMed.
  14. A. Tytak, P. Oleszczuk and R. Dobrowolski, Environ. Sci. Pollut. Res., 2015, 22, 5985–5994 CrossRef.
  15. X. C. Chen, G. C. Chen, L. G. Chen, Y. X. Chen, J. Lehmann, M. B. McBride and A. G. Hay, Bioresour. Technol., 2011, 102, 8877–8884 CrossRef CAS PubMed.
  16. R.-K. Xu, S.-C. Xiao, J.-H. Yuan and A.-Z. Zhao, Bioresour. Technol., 2011, 102, 10293–10298 CrossRef CAS PubMed.
  17. F. G. A. Verheijen, E. R. Graber, N. Ameloot, A. C. Bastos, S. Sohi and H. Knicker, Eur. J. Soil Sci., 2014, 65, 22–27 CrossRef.
  18. H. Zheng, Z. Wang, X. Deng, S. Herbert and B. Xing, Geoderma, 2013, 206, 32–39 CrossRef CAS.
  19. J. Lehmann, Nature, 2007, 447, 143–144 CrossRef CAS PubMed.
  20. J. C. Yan, L. Han, W. G. Gao, S. Xue and M. F. Chen, Bioresour. Technol., 2015, 175, 269–274 CrossRef CAS.
  21. H. Hu, J. Zhang, K. Lu and Y. Tian, J. Environ. Chem. Eng., 2015, 3, 357–364 CrossRef CAS.
  22. P. X. Sheng, K. H. Wee, Y. P. Ting and J. P. Chen, Chem. Eng. J., 2008, 136, 156–163 CrossRef CAS.
  23. Y. Orhan and H. Büyükgüngör, Water Sci. Technol., 1993, 28, 247–255 CAS.
  24. M. Mukhopadhyay, S. Noronha and G. Suraishkumar, Bioresour. Technol., 2007, 98, 1781–1787 CrossRef CAS PubMed.
  25. X. J. Tong, J. Y. Li, J. H. Yuan and R. K. Xu, Chem. Eng. J., 2011, 172, 828–834 CrossRef CAS.
  26. M. Essandoh, B. Kunwar, C. U. Pittman, D. Mohan and T. Mlsna, Chem. Eng. J., 2015, 265, 219–227 CrossRef CAS.
  27. S. Lagergren, K. Sven. Vetenskapsakad. Handl., 1898, 24, 1–39 Search PubMed.
  28. Y. S. Ho, G. McKay, D. A. J. Wase and C. F. Forster, Adsorpt. Sci. Technol., 2000, 18, 639–650 CrossRef CAS.
  29. S. Chien and W. Clayton, Soil Sci. Soc. Am. J., 1980, 44, 265–268 CrossRef CAS.
  30. W. J. Weber and J. C. Morris, J. Sanit. Eng. Div., Am. Soc. Civ. Eng., 1963, 89, 31–60 Search PubMed.
  31. B. Singha and S. K. Das, Colloids Surf., B, 2013, 107, 97–106 CrossRef CAS PubMed.
  32. I. Alomá, M. A. Martín-Lara, I. L. Rodríguez, G. Blázquez and M. Calero, J. Taiwan Inst. Chem. Eng., 2012, 43, 275–281 CrossRef.
  33. I. Langmuir, J. Am. Chem. Soc., 1916, 38, 2221–2295 CrossRef CAS.
  34. U. Freundlich, Z. Phys. Chem., 1906, 57, 385–470 Search PubMed.
  35. M. Temkin and V. Pyzhev, Acta Physicochim. URSS, 1940, 12, 217–222 Search PubMed.
  36. K. R. Hall, L. C. Eagleton, A. Acrivos and T. Vermeulen, Ind. Eng. Chem. Fundam., 1966, 5, 212–223 CAS.
  37. S. Basha, Z. Murthy and B. Jha, Ind. Eng. Chem. Res., 2008, 47, 980–986 CrossRef CAS.
  38. J.-H. Yuan, R.-K. Xu and H. Zhang, Bioresour. Technol., 2011, 102, 3488–3497 CrossRef CAS PubMed.
  39. Z. Wang, G. Liu, H. Zheng, F. Li, H. H. Ngo, W. Guo, C. Liu, L. Chen and B. Xing, Bioresour. Technol., 2015, 177, 308–317 CrossRef CAS.
  40. D. Mohan, S. Rajput, V. K. Singh, P. H. Steele and C. U. Pittman, J. Hazard. Mater., 2011, 188, 319–333 CrossRef CAS PubMed.
  41. R. M. Allen-King, P. Grathwohl and W. P. Ball, Adv. Water Resour., 2002, 25, 985–1016 CrossRef CAS.
  42. J. J. Luo, J. J. Lu, Q. Niu, X. B. Chen, Z. Y. Wang and J. R. Zhang, Fuel, 2015, 160, 440–445 CrossRef CAS.
  43. G. Zhang, Q. Zhang, K. Sun, X. Liu, W. Zheng and Y. Zhao, Environ. Pollut., 2011, 159, 2594–2601 CrossRef CAS PubMed.
  44. Y. Hannachi, A. Rezgui and T. Boubaker, Korean J. Chem. Eng., 2014, 31, 1211–1218 CrossRef CAS.
  45. G. Mahajan and D. Sud, Bioresources, 2011, 6, 3324–3338 CAS.
  46. T. Karthikeyan, S. Rajgopal and L. R. Miranda, J. Hazard. Mater., 2005, 124, 192–199 CrossRef CAS PubMed.
  47. Z. N. Lou, Z. Y. Zhao, Y. X. Li, W. J. Shan, Y. Xiong, D. W. Fang, S. Yue and S. L. Zang, Bioresour. Technol., 2013, 133, 546–554 CrossRef CAS.
  48. Z. A. Zakaria, M. Suratman, N. Mohammed and W. A. Ahmad, Desalination, 2009, 244, 109–121 CrossRef CAS.
  49. A. R. Iftikhar, H. N. Bhatti, M. A. Hanif and R. Nadeem, J. Hazard. Mater., 2009, 161, 941–947 CrossRef CAS PubMed.
  50. M. A. Hanif, R. Nadeem, H. N. Bhatti, N. R. Ahmad and T. M. Ansari, J. Hazard. Mater., 2007, 139, 345–355 CrossRef CAS PubMed.
  51. I. Langmuir, J. Am. Chem. Soc., 1918, 40, 1361–1403 CrossRef CAS.
  52. R. Djeribi and O. Hamdaoui, Desalination, 2008, 225, 95–112 CrossRef CAS.
  53. H. R. Yuan, T. Lu, H. Y. Huang, D. D. Zhao, N. Kobayashi and Y. Chen, J. Anal. Appl. Pyrolysis, 2015, 112, 284–289 CrossRef CAS.
  54. F.-C. Wu, R.-L. Tseng, S.-C. Huang and R.-S. Juang, Chem. Eng. J., 2009, 151, 1–9 CrossRef CAS.
  55. A. Y. Dursun, Biochem. Eng. J., 2006, 28, 187–195 CrossRef CAS.
  56. Y. S. Ho and G. McKay, Water Res., 2000, 34, 735–742 CrossRef CAS.
  57. J. Febrianto, A. N. Kosasih, J. Sunarso, Y. H. Ju, N. Indraswati and S. Ismadji, J. Hazard. Mater., 2009, 162, 616–645 CrossRef CAS PubMed.
  58. M. I. Kandah, Sep. Purif. Technol., 2004, 35, 61–70 CrossRef CAS.
  59. T.-T. Li, Y.-G. Liu, Q.-Q. Peng, X.-J. Hu, T. Liao, H. Wang and M. Lu, Chem. Eng. J., 2013, 214, 189–197 CrossRef CAS.
  60. S. Malamis and E. Katsou, J. Hazard. Mater., 2013, 252, 428–461 CrossRef PubMed.
  61. Q.-S. Liu, T. Zheng, P. Wang, J.-P. Jiang and N. Li, Chem. Eng. J., 2010, 157, 348–356 CrossRef CAS.
  62. X. W. Ang, V. S. Sethu, J. M. Andresen and M. Sivakumar, Clean Technol. Environ. Policy, 2013, 15, 401–407 CrossRef CAS.
  63. M. Fomina and G. M. Gadd, Bioresour. Technol., 2014, 160, 3–14 CrossRef CAS PubMed.
  64. Y. Xiong, H. Wang, Z. Lou, W. Shan, Z. Xing, G. Deng, D. Wu, D. Fang and B. K. Biswas, J. Hazard. Mater., 2011, 186, 1855–1861 CrossRef CAS PubMed.

Footnote

Electronic supplementary information (ESI) available. See DOI: 10.1039/c5ra20235c

This journal is © The Royal Society of Chemistry 2015
Click here to see how this site uses Cookies. View our privacy policy here.