A two-step method for preparing Li4Ti5O12–graphene as an anode material for lithium-ion hybrid capacitors

Nansheng Xu, Xianzhong Sun, Xiong Zhang, Kai Wang and Yanwei Ma*
Key Laboratory of Applied Superconductivity, Institute of Electrical Engineering, Chinese Academy of Sciences, Beijing 100190, PR China. E-mail: ywma@mail.iee.ac.cn; Fax: +86 10 82547137; Tel: +86 10 82547129

Received 29th September 2015 , Accepted 29th October 2015

First published on 30th October 2015


Abstract

Lithium-ion hybrid capacitors (LICs) are expected to fill the gap between lithium-ion batteries and electrochemical supercapacitors. In this paper, we synthesize Li4Ti5O12–graphene (LTO–G) by a two-step method and use it as the anode material in AC/LTO–G Li-ion hybrid capacitors. The LTO–G composite prepared by the two-step method shows the best electrochemical properties in various ways, and delivers a high specific capacity of 194 mA h g−1 at 0.1C, and 90 mA h g−1 at 28.6C. The AC/LTO–G capacitors can perform well between 1 and 2.5 V, and they deliver a reversible capacity of 80 mA h g−1 at 0.1C. The energy density based on the total active material for these capacitors is 15 W h kg−1 at 4000 W kg−1, and 30 W h kg−1 at 1000 W kg−1. After 10[thin space (1/6-em)]000 cycles, these capacitors still deliver an energy density higher than 22 W h kg−1 at 1000 W kg−1. The highest energy density based the total mass of the device is 6.6 W h kg−1 and there is still much room for improvement, indicating that the LTO–G composite is a promising candidate anode material for Li-ion hybrid capacitors.

1. Introduction

Lithium-ion hybrid supercapacitors (LICs),1–16 which combine the high energy capacity of a lithium-ion battery and the rapid charge/discharge capability of a supercapacitor, are considered to be the second generation of supercapacitors17 and are expected to fill the gap between lithium-ion batteries and electrochemical capacitors.10,11,18 Most LICs use the cathode materials of a lithium-ion battery (LIB) and activated carbon (AC) as the anode, or vice versa. The former devices, e.g., LiFePO4/AC,13 LiNi0.5Mn1.5O4/AC14 and LiCoO2/AC,15 deliver low cell voltage,9 and thus have a slightly better capacity than that of high voltage EDLCs. The other strategy is to develop high capacity supercapacitors using an AC cathode, while the anode materials of LIB for anode, e.g., AC/graphite,3,19–21 AC/hard-carbon,8,22 AC/Fe2O3,9 and AC/TiO2,10 AC/Li4Ti5O12.5,23–27 Although Fe2O3 and other transition metal oxides deliver very high specific capacities, they suffer from large volume expansion during charge/discharge processes, which may cause the electrode material to pulverize and decrease its capacity.28 Fe2O3 and other transition metal oxides are also undesirable for electrodes because they form Li2O and therefore have a low first cycle coulombic efficiency.16,29–31 The formation of Li2O is unfavorable for LICs, because it consumes the Li-ion of the electrolyte and which decreases the capacity.

Spinel Li4Ti5O12 (LTO) was considered as one of the most promising anode materials for LIBs and LICs due to its unique properties including zero structure change and high and flat operating potential (1.55 V vs. Li+/Li) during Li-ion insertion/extraction.1,2,5,24,32–36 However, the slow Li+ ion diffusion coefficient and poor electron conductivity24 prevents the LTO material from wide usage in high performance power systems. Reducing the particle size of LTO can significantly reduce the Li+ ion diffusion path and rapidly increase the electrode reaction kinetic process.5,28 However, the nanosized LTO particles are hard to synthesize, and underproduced.5,25,37,38 The citric acid-nitrate combustion method28 is an easy way to produce the very fine LTO precursor, but it needs further heat treatment to produce single phase LTO at an elevated temperature, for example 800 °C, which unfortunately causes the LTO particle to increase in size.

On the other hand, the electric conductivity can be increased to an extremely high level by adding conductive additives, e.g., carbon-coating,35,39,40 graphene,4,32,41 and carbon nanotubes.5,42 Among them, graphene, a two-dimensional (2D) honeycomb lattice exfoliated from graphite, was considered as the ideal conductive additive for hybrid nanostructured electrodes,41,43–45 and it was widely used in energy technologies.4,11,31,32,41,46–53 The addition of graphene also helps to increase the electrochemical performance by increasing its specific capacity.4,31,43 However, graphene is even hard to synthesize.

In this work, LTO–G composite was synthesized through a two-step method, and its phase structure, particle morphology, and electrochemical properties were characterized. Two three-electrode systems, using AC as the cathode, LTO–G as the anode, and a lithium metal as a reference electrode, were assembled and studied.

2. Experimental

2.1. Synthesis

LTO–G composite was prepared by a two-step method. First, Li4Ti5O12 intermediate (denote as p-LTO) was synthesized by the combination of sol gel and citric acid-nitrate using the low temperature self-propagating combustion method,28 by according to the following steps. First, 0.125 mol Ti(C4H9O)4 (Sinopharm Chemical Reagent Co., Ltd, SCRC) was dispersed in 200 mL ethanol (solution A), and 0.11 mol LiCH3COO·H2O (from SCRC, nLi[thin space (1/6-em)]:[thin space (1/6-em)]nTi = 4.4[thin space (1/6-em)]:[thin space (1/6-em)]5) was dispersed in 800 mL distilled water (solution B). 0.47 mol citric acid (ncitric acid[thin space (1/6-em)]:[thin space (1/6-em)]ntotal metal ion = 2[thin space (1/6-em)]:[thin space (1/6-em)]1) and 50 mL nitric acid were added to solution B to obtain solution C. Ammonia (∼28%) was added to adjust the pH of the solution C to approximately 6. The resultant solution was treated in an air-circulating oven at 80 °C to vaporize the water completely. The product was heat-treated in the oven at 200 °C for 2 h to cause combustion. The obtained precursor was ground and calcined in air at 650 °C for 4 h to obtain the p-LTO (treated at 800 °C for pure LTO).

Graphite oxide (GO) was used as the source for graphene, and was prepared by the conventional Hummers method. Briefly, 5 g graphite (SCRC) and 5 g sodium nitrate were added to 115 mL concentrated H2SO4. The mixed solution was placed in an ice-water bath and stirred for 4 h. 30 g KMnO4 was then gradually added into the solution and stirred for another 4 h at room temperature. 230 mL distilled water was added slowly to quickly increase the temperature to 98 °C, and this temperature was held for 15 min. The suspension was then further diluted with 460 mL warm distilled water and treated with 3% H2O2. The resulting suspension was washed and centrifuged several times to produce the graphite oxide solution.

Certain amount of the GO solution (the mass of GO is about 0.2 g) was diluted with 300 mL distilled water and treated with ultrasonic for 30 min. 0.9 g p-LTO was added to the GO solution, further treated with ultrasonic for another 30 min, and then transferred to a rotary evaporator and dried at 75 °C. After drying, the obtained powders (denote as p-LTO/GO) were well ground and then reduced at 800 °C in flowing Ar for 2 h to obtain the LTO–G composite (as described in Fig. 1). In order to make a comparison, the LTO–G composites prepared by these different methods were also investigated. In method I, the LTO–G was prepared by directly mixing the pure LTO and graphene together in the electrode preparation process. In method II, LTO–G was in situ reduced from GO coated LTO at 500 °C in Ar for 1 h, as presented in Fig. 1.


image file: c5ra20168c-f1.tif
Fig. 1 Schematic presentation of the synthetic process of the LTO–G composite.

In the two-step method, two intermediates, p-LTO and GO, were first prepared and then further heat-treated to synthesize the LTO–G composite after they were well mixed. Since the two-step method prepared LTO–G was first heat-treated at a lower temperature, it produced a finer powder. The GO coating layer will also prevented the p-LTO powders from aggregation and thus prevented the particle size of LTO from increasing during the heat treatment at 800 °C.

2.2. Characterization

The crystal structures of LTO–G powders were characterized by X-ray powder diffraction (XRD) using a Bruker D8 Advance Spectrometer with a Cu-Kα radiation source. Thermo-gravimetric analysis (TGA, Seiko Instruments TG/DTA6300) was performed on the LTO–G sample in air from 100 to 800 °C with a heating rate of 10 °C min−1 to determine the content of graphene. The morphologies were visualized by field emission scanning electron microscopy (FE-SEM, Zeiss Sigma), and high-resolution transmission electron microscopy (TEM, JEOL JEM-2010).

2.3. Electrochemical measurements

The anode electrode was prepared by spreading uniform slurry on a copper foil. The slurry was composed of 90 wt% LTO–G composite and 10 wt% polyvinylidene fluoride (PVdF), evenly dispersed in N-methyl pyrrolidinone (NMP). After drying at 80 °C for 24 h to remove the NMP, the copper foil with the active materials was punched into Φ 13 mm discs and 35 × 40 mm rectangles. The cathode electrode, made of commercially activated carbon (YP50F, Kuraray Chemicals), was cast on aluminum foil and punched into 35 × 40 mm rectangles. The detailed AC electrode preparation information can be found in our previous work.22,54 Coin cells (type: 2032) with LTO–G film as the working electrode, lithium metal as the counter electrode, Celgard 2400 (Celgard company) microporous membrane as the separator and 1 M LiPF6 dissolved in a mixture of EC + DEC + DMC (1[thin space (1/6-em)]:[thin space (1/6-em)]1[thin space (1/6-em)]:[thin space (1/6-em)]1 in vol.) as the electrolyte were assembled in an argon-filled glove box (MBRAUN).

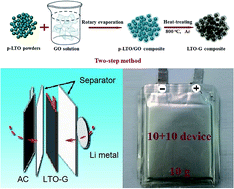
A three-electrode pouch cell, denoted as the 1 + 1 device, was assembled with one layer of one-side coated AC electrode (mAC = 37.18 mg) as the cathode, one layer of one-side coated LTO–G electrode (mLTO−G = 18.77 mg) as the anode, and a lithium metal (Φ 16 mm) as a reference electrode. The schematic structure of the capacitor is shown in Fig. 2a, and the made-up cell is shown in Fig. 2b. Another device was also assembled, and it is shown in Fig. 2c. It had 10 pieces of double-side coated AC cathode, 10 pieces of double-side coated LTO–G anode and a 30 × 35 mm Li metal as a reference electrode. This cell was denoted as the 10 + 10 device, and the total masses for AC, LTO–G and the whole device were 0.97, 0.47 and 10 g, respectively. The mass ratios (r, defined by r = mAC/mLTO−G) of both capacitors were set to be approximately 2, and the real r are 1.98 and 2.06 for the 1 + 1 and the 10 + 10 device, respectively.


image file: c5ra20168c-f2.tif
Fig. 2 (a) Schematic structure of the three-electrode lithium-ion hybrid capacitor; (b) the make-up of the soft-packaged 1 + 1 device; (c) the make-up of soft-packaged 10 + 10 device.

The lithium metal electrode was used for the detection of the electrode voltage profile during the charge/discharge process, for the pre-cycling for the AC and LTO–G composite, and also for the pre-lithiation process for LTO–G anode. The electrochemical properties of the LTO–G composite and the LICs were studied by the galvanostatic charge/discharge technique between 1.0 to 2.5 V using LAND CT2001A battery testers and an Arbin MSTAT 4 multichannel galvanostat/potentiostat.

3. Results and discussion

Fig. 3 shows the XRD patterns of the LTO–G composite prepared by different method. For method I, because no real LTO–G composite was formed before the test, the XRD of the pure LTO powders was presented instead. In the XRD patterns, no diffraction peaks related to GO or graphene were detected because the GO and graphene were well dispersed in the p-LTO/GO and LTO–G and appeared to be amorphous.31,32,46 The three XRD patterns in Fig. 3a are almost the same. Only the Li4Ti5O12 phase was detected, but with a different background intensity and full-width-half-maximum (FWHM). The samples containing graphene show higher background intensity, especially at a low θ range, 10–30°. This contrast is reasonable because the graphene was amorphous and well distributed. LTO–G prepared by the two-step method shows the biggest FWHM, according to the Scherrer equation, it has the smallest mean crystalline size, which means that the two-step method could help to reduce the particle size of LTO–G. Fig. 3b shows the XRD patterns of p-LTO, p-LTO/GO and LTO–G. The p-LTO and p-LTO/GO exhibit main phase structures of spinel Li4Ti5O12 oxide and rutile TiO2 oxide. A certain amount of LiOH also was detected, which further reacted with TiO2 to form the spinel LTO when the calcined temperature was increased to 800 °C, as shown in Fig. 3b. A single spinel structure was detected (Fig. 3b) after the p-LTO/GO was in situ reduced in an Ar flow atmosphere at 800 °C for 2 h.
image file: c5ra20168c-f3.tif
Fig. 3 XRD patterns of (a) LTO–G composite prepared by different methods and (b) p-LTO, p-LTO/GO and LTO–G materials.

Fig. 4c and d show the morphology of the LTO–G composite prepared by the two-step method. As a comparison, the morphology of LTO–G composite prepared by method II also was presented, shown in Fig. 4a and b. The powders prepared by two-step method were smaller in size and slighter in aggregation.


image file: c5ra20168c-f4.tif
Fig. 4 Morphology of the LTO–G composite. (a and b) SEM images of LTO–G prepared by method II; (c–e) SEM images of LTO–G prepared by the two-step method; (f) TEM image of LTO–G prepared by the two-step method (inset graph: HR-TEM micrograph).

The SEM images (Fig. 4c and e) indicate that the LTO powders and the graphene sheets were uniformly distributed, and the graphene sheets were well connected with each other. The uniformly-distributed and well-connected of graphene morphology provide the good conductivity of the LTO–G composite, which was further proved by the low electrode polarization during the charge/discharge process. The TEM image (Fig. 4f) shows the detail morphology of the LTO–G composite. The LTO particles were about 200 nm in size, and the very thin and curved graphene sheets were microns in length. A regular lattice spacing of 0.48 nm was observed by HR-TEM (inset graph in Fig. 4f), which matches well with the (111) planes of spinel LTO oxide.

In order to determine the content of graphene, TG-DTA analysis was performed on the LTO–G composites, and the result is shown in Fig. 5. For the LTO–G prepared by method II, the TG curve shows that there was an 8.9% weight loss during the heating process, between 350–500 °C. For the LTO–G prepared by the two-step method, a 10.7% weight loss was detected, and this loss occurred mainly between 450–520 °C. LTO–G prepared by two-step method shows a higher exothermic peak temperature, indicating that the adhesion between LTO particles and graphene sheets was stronger than that of LTO–G prepared by method II. The strong adhesion between LTO particles and graphene sheets promoted the migration of electrons and thus produced better electronic conductivity. No other endo/exothermic peaks or weight loss processes were found in both TG-DTA curves, combining with the XRD data shown in Fig. 3, indicating that a pure LTO–G composite was synthesized.


image file: c5ra20168c-f5.tif
Fig. 5 TG-DTA curves of LTO–G composites prepared by different method.

Galvanostatic charge/discharge cycling measurement was performed to study the electrochemical performance of the LTO–G composite, and the results are shown in Fig. 6. Fig. 6a shows the comparison of the rate-capability performance of the LTO–G composite prepared by a different method. Due to the smaller size and slighter aggregation, the LTO–G composite synthesized by the two-step method shows a higher reversible capacity and better capacity retention (inset table in Fig. 6a).


image file: c5ra20168c-f6.tif
Fig. 6 Electrochemical performance for the LTO–G composite. (a) Rate-capacity performance of LTO–G composite prepared by different method (inset table: capacity retention at different charge/discharge current density); (b) rate-capability; (c) specific capacity–voltage profiles; (d) polarization of ΔE at different charge/discharge current density; (e) cycling performance at 200 mA g−1 (1.1C); (f) cycling performance at 1 A g−1 (5.7C).

At a low charge/discharge current density, 0.1C, (1C = 175 mA g−1), an average reversible capacity of 194, and 187 mA h g−1 (based on the total mass of the LTO–G) was achieved for LTO–G prepared by the two-step method and method II, respectively, as shown in Fig. 6a and b. The result was much higher than the theoretical capacity of the LTO, which may be due to the high specific capacity of graphene.4,32,46 And because the graphene content in the LTO–G prepared by the two-step method was a little higher than that of method II, it is reasonable that LTO–G prepared by two-step method could deliver higher reversible capacity, as shown in Fig. 6a. With the increase of charge/discharge current density, the reversible capacity slowly decreased. And the specific capacity restored to 190 mA h g−1 when the charge/discharge rate was changed back from 28.6C to 0.1C, which suggests that the LTO–G composite shows very good capacity recovery due to the having good intrinsic structure stability of the LTO material.28 Specific capacities of 180, 178, 174, 164, 150, 127 and 90 mA h g−1 were achieved for 0.3, 0.6, 1.1, 2.9, 5.7, 11.4 and 28.6C respectively.

The galvanostatic curves at different rates are shown in Fig. 6c. An exclusive flat potential plateau about 1.44–1.71 V (vs. Li+/Li) was found at all rates, which corresponds well to the two phase equilibrium between Li4Ti5O12 and Li7Ti5O12.33,34 With the increase of current density, the discharge voltage plateau of the LTO–G composite shifts gradually toward low voltage, and the charge voltage plateau shifts gradually toward high voltage, showing the electrode polarization at high current density. The corresponding electrode polarization (ΔE) between charge/discharge curves as a function of the current density is plotted in Fig. 6d. Very small electrode polarization, 0.027 V at 0.1C, 0.043 V at 0.3C, 0.051 V at 0.6C, 0.077 V at 1.1C, was observed, suggesting that the LTO–G composite exhibits very good conductivity. Because no conductive additive was used in the working electrode, we conclude that the good conductivity was the intrinsic property of LTO–G composite.

Fig. 6e and f show the cycling performance of the LTO–G composite at 1.1C and 5.7C respectively. At 1.1C, LTO–G composite delivered a charge capacity of 176 mA h g−1 during the first cycle, which agrees well with the result of the rate-capacity test (Fig. 6b); the capacity gradually decreased to 167 mA h g−1 at the 100th cycle (Fig. 6e). At the higher charge/discharge rate, 5.7C, the material delivered 150 mA h g−1 during the first cycle, but decreased rapidly after the completion of the first 100 cycles (132 mA h g−1 at 100th cycle, 88% capacity retention), and the capacity decreased very slowly thereafter. After 2000 cycles, it still delivered a capacity of 120 mA h g−1 (80% capacity retention), which indicates that the LTO–G composite shows excellent Li+ insertion/extraction kinetic properties.

Two three-electrode pouch capacitors, as shown in Fig. 2, were assembled and studied. Before the electrochemical cycling test was performed, the AC cathode was pre-cycled between 2.0 and 4.2 V at a current density of 5 mA g−1 for 4 cycles, and the LTO–G electrode was pre-lithiated. The results are presented in Fig. 7. The AC potential was linearly proportional to the charge/discharge time, and the capacity was calculated to be 64 mA h g−1 between 2.0–4.2 V, as shown in Fig. 7a. The pre-lithiation process of LTO–G was performed to make the LTO–G anode work at the Li+ insertion/extraction voltage platform, as shown in the specific capacity–voltage profiles (Fig. 6c). The voltage profile of the pre-lithiation process is shown in Fig. 7b. For the 1 + 1 device, a current of 1 mA (equal to 0.3C) was applied between the LTO–G and Li-metal electrode for 33.8 min (the pre-lithiation capacity was calculated to be 30 mA h g−1). Since the Li-metal was placed against the LTO–G electrode (shown in Fig. 2a), it was difficult for Li+ to transfer from Li-metal to LTO, and therefore a much higher electrode polarization was detected. The voltage platform was 1.25 V, much lower than the voltage platform shown in Fig. 4c (1.54 V at 0.6C). When the LTO–G electrode was discharged at 30 mA h g−1, the charge current was removed, and the voltage of 1.55 V was detected between the LTO–G anode and the Li-metal electrode, indicating that there was a two phase equilibrium between Li4Ti5O12 and Li7Ti5O12.33,34 For the 10 + 10 device, the Li+ migration is more difficult in the pre-lithiation process, and a much smaller current density of 0.05C was used (Fig. 8). No obvious voltage platform was detected during the pre-lithiation process. Because the mass ratio of cathode to anode for the 10 + 10 device (r10+10 = 2.06) was a little higher than that of the 1 + 1 device (r1+1 = 1.98), a higher pre-lithiation cut-off capacity (35 mA h g−1) was applied for the 10 + 10 device, as shown in the inset table in Fig. 7b.


image file: c5ra20168c-f7.tif
Fig. 7 Potential profile of (a) pre-cycling of the AC electrode and (b) pre-lithiation process of the LTO–G electrode.

image file: c5ra20168c-f8.tif
Fig. 8 Electrochemical performances of the AC/LTO–G Li-ion hybrid capacitor. (a) Cycling performance at 0.1C (inset graph: the potential profile of first 4 cycles); (b) rate-capability; (c) Ragone plots (inset graph: schematic structure of the three-electrode lithium-ion hybrid capacitor); (d) cycling performance at 10C.

Fig. 8 shows the electrochemical performance of the AC/LTO–G Li-ion hybrid capacitor cycling at different current densities. The 1 + 1 device was first cycled at a current density of 0.1C, and the results are shown in Fig. 8a. The inset graph in Fig. 8a shows the potential profile of the first 4 cycles. The cathode potential was linearly proportional to the charge/discharge time, varying from 2.58 to 3.99 V vs. Li/Li+, indicating the typical electrical double layer capacitor behavior. A flat potential signal, about 1.50 V vs. Li/Li+, was detected at the anode, which corresponds to the two phase equilibrium between Li4Ti5O12 and Li7Ti5O12,33,34 indicating the typical charge/discharge behavior of LTO material. According to the pre-cycling result of the AC electrode (Fig. 7), the capacity of AC at the potential range of 2.58 and 3.99 V was about 41 mA h g−1. The mass ratio r = 1.98, the capacity of the cell (based on AC) was calculated to be 81 mA h g−1, which agrees well with the result based on the LTO–G listed in Fig. 8a. The result indicates that only about 45 wt% of the LTO–G was utilized, so the capacity can be further increased by increasing the mass ratio of the cathode to the anode.

Fig. 8b shows the rate-capability performance of the AC/LTO–G Li-ion hybrid capacitors. For the 1 + 1 device, averages of 75, 70, 67, 62, 56, 48 and 37 were achieved for 0.5, 1, 2, 5, 10, 20, and 50C, respectively. For the 10 + 10 device, the specific capacity was a little smaller than that of the 1 + 1 device. The average capabilities of 71, 67, 65, 61, 55, 45, and 30 were achieved for 0.5, 1, 2, 5, 10, 20, and 50C, respectively.

The energy densities based on the total mass of the active material of these two devices are almost the same: about 50 W h kg−1 at 10 W kg−1 (cycled at 0.1C), 30 W h kg−1 at 1000 W kg−1 (at 10C) and 15 W h kg−1 at 4000 W kg−1 (at 50C), as shown in the Fig. 8c. The AC/LTO–G Li-ion hybrid capacitors were then charged and discharged at 10C for 10[thin space (1/6-em)]000 cycles, and the result is shown in Fig. 8d. The 1 + 1 device delivered a capacity of 57 mA h g−1 (32 W h kg−1) during the first cycle, and then slowly decreased to 47 mA h g−1 (26 W h kg−1, 81% capacity retention). The 10 + 10 device delivered 56 mA h g−1 (32 W h kg−1) during the first cycle but decreased quickly to 45 mA h g−1 (25 W h kg−1, 80% capacity retention) by the 500th cycle, and remained at 40 mA h g−1 (22 W h kg−1, 71% capacity retention) after 10[thin space (1/6-em)]000 cycles. The highest energy density based on the total mass of the 10 + 10 device was 6.6 W h kg−1, and it can be further increased by increasing the mass ratio of the cathode to the anode. The total active material accounted for only 15% of the whole device, still leaving much room for improvement in energy density, which indicates that the LTO–G composite is a promising candidate material for Li-ion hybrid capacitors.

4. Conclusion

LTO–G was successfully synthesized by a two-step method. The two-step method prepared LTO–G was first heat-treated at a low temperature, and thus can produce finer p-LTO powders. The resulting GO coating layer prevents the p-LTO powders from aggregation and thus prevents the particle size of the LTO from increasing during the further heat treatment at 800 °C. The two-step method also provides stronger adhesion between LTO particles and graphene sheets, and thus produces LTO–G composite with good conductivity. Coupled with Li metal as a lithium ion half-cell, the LTO–G anode shows a high specific capacity. 194, 178, 150, 127, 90 mA h g−1 were achieved for 0.1, 0.6, 5.7, 11.4, 28.6C, respectively. The potential profile of the capacitor shows a typical double layer capacitor behavior of AC and a typical charge/discharge behavior of LTO material, indicating that the Li-ion hybrid capacitor performed successfully. The 1 + 1 device delivers 80 mA h g−1 at 0.1C, very close to the theoretical capacity of a capacitor with r = 2. The energy densities are 30 W h kg−1 at 1000 W kg−1 and 15 W h kg−1 at 4000 W kg−1, and after 10[thin space (1/6-em)]000 cycles, the capacitors still deliver an energy density higher than 22 W h kg−1. The highest energy density based on the total mass of the whole device is 6.6 W h kg−1, which leaves much room for improvement.

Acknowledgements

This work was financially supported by the China Postdoctoral Science Foundation funded project (No. 2014M550087) and National Natural Science Foundation of China (No. 51307167 and 51472238).

References

  1. M. D. Stoller, S. Murali, N. Quarles, Y. Zhu, J. R. Potts, X. Zhu, H. W. Ha and R. S. Ruoff, Phys. Chem. Chem. Phys., 2012, 14, 3388–3391 RSC .
  2. A. Jain, V. Aravindan, S. Jayaraman, P. S. Kumar, R. Balasubramanian, S. Ramakrishna, S. Madhavi and M. P. Srinivasan, Sci. Rep., 2013, 3, 3002 Search PubMed .
  3. S. R. Sivakkumar and A. G. Pandolfo, Electrochim. Acta, 2012, 65, 280–287 CrossRef CAS .
  4. K. Leng, F. Zhang, L. Zhang, T. Zhang, Y. Wu, Y. Lu, Y. Huang and Y. Chen, Nano Res., 2013, 6, 581–592 CrossRef CAS .
  5. K. Naoi, S. Ishimoto, Y. Isobe and S. Aoyagi, J. Power Sources, 2010, 195, 6250–6254 CrossRef CAS .
  6. A. Vlad, N. Singh, J. Rolland, S. Melinte, P. M. Ajayan and J. F. Gohy, Sci. Rep., 2014, 4, 4315 CAS .
  7. D. Puthusseri, V. Aravindan, S. Madhavi and S. Ogale, Electrochim. Acta, 2014, 130, 766–770 CrossRef CAS .
  8. W. J. Cao and J. P. Zheng, J. Power Sources, 2012, 213, 180–185 CrossRef CAS .
  9. A. Brandt and A. Balducci, Electrochim. Acta, 2013, 108, 219–225 CrossRef CAS .
  10. H. Kim, M. Y. Cho, M. H. Kim, K. Y. Park, H. Gwon, Y. Lee, K. C. Roh and K. Kang, Adv. Energy Mater., 2013, 3, 1500–1506 CrossRef CAS .
  11. C. Liu, Z. Yu, D. Neff, A. Zhamu and B. Z. Jang, Nano Lett., 2010, 10, 4863–4868 CrossRef CAS PubMed .
  12. X. Hu, Y. Huai, Z. Lin, J. Suo and Z. Deng, J. Electrochem. Soc., 2007, 154, A1026 CrossRef CAS .
  13. N. Böckenfeld, R. S. Kühnel, S. Passerini, M. Winter and A. Balducci, J. Power Sources, 2011, 196, 4136–4142 CrossRef .
  14. H. Wu, C. V. Rao and B. Rambabu, Mater. Chem. Phys., 2009, 116, 532–535 CrossRef CAS .
  15. A. Du Pasquier, I. Plitz, S. Menocal and G. Amatucci, J. Power Sources, 2003, 115, 171–178 CrossRef CAS .
  16. W. H. Qu, F. Han, A. H. Lu, C. Xing, M. Qiao and W. C. Li, J. Mater. Chem. A, 2014, 2, 6549–6557 CAS .
  17. K. Naoi, S. Ishimoto, J. i. Miyamoto and W. Naoi, Energy Environ. Sci., 2012, 5, 9363 CAS .
  18. S. W. Lee, B. M. Gallant, H. R. Byon, P. T. Hammond and Y. Shao Horn, Energy Environ. Sci., 2011, 4, 1972 CAS .
  19. H. Wang and M. Yoshio, Electrochem. Commun., 2008, 10, 382–386 CrossRef CAS .
  20. X. Yu, C. Zhan, R. Lv, Y. Bai, Y. Lin, Z. H. Huang, W. Shen, X. Qiu and F. Kang, Nano Energy, 2015, 15, 43–53 CrossRef CAS .
  21. S. Kumagai, T. Ishikawa and N. Sawa, Journal of Energy Storage, 2015, 2, 1–7 CrossRef .
  22. X. Sun, X. Zhang, H. Zhang, N. Xu, K. Wang and Y. Ma, J. Power Sources, 2014, 270, 318–325 CrossRef CAS .
  23. J. J. Yang, C. H. Choi, H. B. Seo, H. J. Kim and S. G. Park, Electrochim. Acta, 2012, 86, 277–281 CrossRef CAS .
  24. H. G. Jung, N. Venugopal, B. Scrosati and Y. K. Sun, J. Power Sources, 2013, 221, 266–271 CrossRef .
  25. L. Cheng, H. J. Liu, J. J. Zhang, H. M. Xiong and Y. Y. Xia, J. Electrochem. Soc., 2006, 153, A1472 CrossRef CAS .
  26. L. Ye, Q. Liang, Y. Lei, X. Yu, C. Han, W. Shen, Z. H. Huang, F. Kang and Q. H. Yang, J. Power Sources, 2015, 282, 174–178 CrossRef CAS .
  27. S. Dsoke, B. Fuchs, E. Gucciardi and M. Wohlfahrt-Mehrens, J. Power Sources, 2015, 282, 385–393 CrossRef CAS .
  28. J. Wang, H. Zhao, Y. Wen, J. Xie, Q. Xia, T. Zhang, Z. Zeng and X. Du, Electrochim. Acta, 2013, 113, 679–685 CrossRef CAS .
  29. C. He, S. Wu, N. Zhao, C. Shi, E. Liu and J. Li, ACS Nano, 2013, 7, 4459–4469 CrossRef CAS PubMed .
  30. P. Poizot, S. Laruelle, S. Grugeon, L. Dupont and J. M. Tarascon, Nature, 2000, 407, 496–499 CrossRef CAS PubMed .
  31. Q. H. Wu, C. Wang and J. G. Ren, Ionics, 2013, 19, 1875–1882 CrossRef CAS .
  32. Y. Shi, L. Wen, F. Li and H. M. Cheng, J. Power Sources, 2011, 196, 8610–8617 CrossRef CAS .
  33. K. S. Park, A. Benayad, D. J. Kang and S. G. Doo, J. Am. Chem. Soc., 2008, 130, 14930–14931 CrossRef CAS PubMed .
  34. Y. Wang, H. Liu, K. Wang, H. Eiji, Y. Wang and H. Zhou, J. Mater. Chem., 2009, 19, 6789–6795 RSC .
  35. G. N. Zhu, H. J. Liu, J. H. Zhuang, C. X. Wang, Y. G. Wang and Y. Y. Xia, Energy Environ. Sci., 2011, 4, 4016–4022 CAS .
  36. J. Lim, E. Choi, V. Mathew, D. Kim, D. Ahn, J. Gim, S. H. Kang and J. Kim, J. Electrochem. Soc., 2011, 158, A275 CrossRef CAS .
  37. S. G. Ri, L. Zhan, Y. Wang, L. Zhou, J. Hu and H. Liu, Electrochim. Acta, 2013, 109, 389–394 CrossRef CAS .
  38. A. S. Prakash, P. Manikandan, K. Ramesha, M. Sathiya, J. M. Tarascon and A. K. Shukla, Chem. Mater., 2010, 22, 2857–2863 CrossRef CAS .
  39. L. Cheng, J. Yan, G. N. Zhu, J. Y. Luo, C. X. Wang and Y. Y. Xia, J. Mater. Chem., 2010, 20, 595 RSC .
  40. E. Kang, Y. S. Jung, G. H. Kim, J. Chun, U. Wiesner, A. C. Dillon, J. K. Kim and J. Lee, Adv. Funct. Mater., 2011, 21, 4349–4357 CrossRef CAS .
  41. N. Zhu, W. Liu, M. Xue, Z. Xie, D. Zhao, M. Zhang, J. Chen and T. Cao, Electrochim. Acta, 2010, 55, 5813–5818 CrossRef CAS .
  42. J. Huang and Z. Jiang, Electrochim. Acta, 2008, 53, 7756–7759 CrossRef CAS .
  43. A. K. Geim and K. S. Novoselov, Nat. Mater., 2007, 6, 183–191 CrossRef CAS PubMed .
  44. S. M. Paek, E. Yoo and I. Honma, Nano Lett., 2009, 9, 72–75 CrossRef CAS PubMed .
  45. E. Yoo, J. Kim, E. Hosono, H. s. Zhou, T. Kudo and I. Honma, Nano Lett., 2008, 8, 2277–2282 CrossRef CAS PubMed .
  46. D. Pan, S. Wang, B. Zhao, M. Wu, H. Zhang, Y. Wang and Z. Jiao, Chem. Mater., 2009, 21, 3136–3142 CrossRef CAS .
  47. L. Zhang, F. Zhang, X. Yang, G. Long, Y. Wu, T. Zhang, K. Leng, Y. Huang, Y. Ma, A. Yu and Y. Chen, Sci. Rep., 2013, 3, 1408 Search PubMed .
  48. Y. Huang, J. Liang and Y. Chen, Small, 2012, 8, 1805–1834 CrossRef CAS PubMed .
  49. X. Zhang, H. Zhang, C. Li, K. Wang, X. Sun and Y. Ma, RSC Adv., 2014, 4, 45862–45884 RSC .
  50. Y. Zhu, S. Murali, W. Cai, X. Li, J. W. Suk, J. R. Potts and R. S. Ruoff, Adv. Mater., 2010, 22, 3906–3924 CrossRef CAS PubMed .
  51. K. S. Novoselov, V. I. Fal'ko, L. Colombo, P. R. Gellert, M. G. Schwab and K. Kim, Nature, 2012, 490, 192–200 CrossRef CAS PubMed .
  52. M. D. Stoller, S. Park, Y. Zhu, J. An and R. S. Ruoff, Nano Lett., 2008, 8, 3498–3502 CrossRef CAS PubMed .
  53. L. L. Zhang, R. Zhou and X. S. Zhao, J. Mater. Chem., 2010, 20, 5983 RSC .
  54. X. Sun, X. Zhang, B. Huang, H. Zhang, D. Zhang and Y. Ma, J. Power Sources, 2013, 243, 361–368 CrossRef CAS .

This journal is © The Royal Society of Chemistry 2015