
 Open Access Article
 This Open Access Article is licensed under a
 Creative Commons Attribution 3.0 Unported Licence
pH responsive translocation of an anticancer drug between cyclodextrin and DNA†
Krishna
Gavvala
,
Sagar
Satpathi
and
Partha
Hazra
*
Department of Chemistry, Indian Institute of Science Education and Research (IISER), Pune 411008, Maharashtra, India. E-mail: p.hazra@iiserpune.ac.in; Fax: +91-20-2589-9790; Tel: +91-20-2590-8077
First published on 11th November 2015
Abstract
Ellipticine, a well known anticancer drug, emits intense green color when it is intercalated in DNA. It exhibits blue color inside the nano-cavity of a supramolecular host, γ-cyclodextrin (γ-CD). Inspired by these unique fluorescence switching properties of the anticancer drug, in the present work we have monitored the interplay of the drug between γ-CD and DNA by varying the medium pH as a stimulus. Here, steady-state and picosecond time-resolved fluorescence as well as circular dichroism techniques are employed to decipher the location of the drug inside the γ-CD nano-cavity and DNA. Our results confirm that at higher pH the drug selectively stays at γ-CD, even in the presence of biopolymers and exhibits blue color; whereas at lower pH, it is preferentially located in DNA even in the presence of γ-CD and emits a green color. We believe this kind of pH driven translocation of drugs monitored by fluorescence switching may find possible applications in controlled release of the drug inside cells.
Introduction
In recent years, development of stimuli responsive controlled release systems have become a prime focus in the scientific community due to their promising applications in biomedical fields. The controlled release of guest molecules can be achieved in response to various external stimuli such as temperature, pH, light, salt, enzymes, etc.1–9 Among these, a pH-responsive system has been extensively explored for target drug delivery in cancer therapy owing to the pH gradient between the physiological environment (pH 7.4) and cell organelles such as endosome and cytolysosome (pH ∼ 5.0).10,11 To date versatile classes of macrocyclic hosts with excellent host–guest recognition properties and optimum biomedical applications have been synthesized.3 Among them, cyclodextrins (CD) have received special interest because of their unique structure, with hydrophilic external surface and hydrophobic hollow cavity attracts wide variety of guest molecules.12–14 As CDs are naturally available from starch, they are biocompatible, and exhibits less toxicity toward biological systems.15 These beneficial properties have further fostered extensive studies on using CDs in several drug formulations and many biomedical applications.3,12–16 In continuation of these efforts, we have recently reported the formation of multiple host–guest inclusion complexes for an anticancer drug, ellipticine with several CDs.17 Not only drug encapsulation but release of the drug in presence of biopolymers (DNA, RNA etc.) is immensely important, as it is majorly associated with the therapeutic efficacy of the drug. In this context, few research works have also been devoted to understand the release of guest molecules from supramolecular host in presence of several biomolecules.7,18–20 Owing to the physiological omnipresence in cells, we have chosen DNA as target molecule for releasing ellipticine from the nano-cavity of γ-CD. Not only drug release to biomolecule, but it will also be intriguing to study the reversible extraction of drug from DNA to supramolecular host using some external stimuli, so that the same DNA can be recovered and involved in other important cellular process. Here, we could able to achieve this reversible translocation of ellipticine between CD and DNA by simply varying the pH of the medium as an external stimulus. Ellipticine (EPT), a well known antitumor drug, intercalates in DNA base pairs and inhibits the activity of DNA topoisomerase-II, which eventually triggers the cell apoptosis by restricting the DNA replication.21,22 Due to the presence of basic pyridine nitrogen, EPT exists in two different prototropic forms (Scheme 1) and exhibits two discrete emission bands depending on the pH as well as polarity of the environment. In non-polar and hydrophobic environments the drug exists in neutral form (N form), and exhibits an emission band in the range 430–470 nm.23–27 In hydrophilic and polar media, EPT exists as a protonated/cationic form (C form), and emits at ∼530 nm.17,23–25 One of our recent works confirms that the N form of EPT is encapsulated in γ-CD due to the hydrophobic environment of nano-cavity.17 It is pertinent to mention that EPT exists as a neutral form in cell cytoplasm and protonated form in the nucleus.28 The cationic form of the drug preferably intercalates in DNA,28 which leads to fluorescence intensity enhancement of 530 nm band. Inspired by the well separated emission bands for EPT in γ-CD and DNA, herein, we aim to study the pH responsive translocation of EPT between these hosts using steady state, time-resolved fluorescence and circular dichroism spectroscopic tools.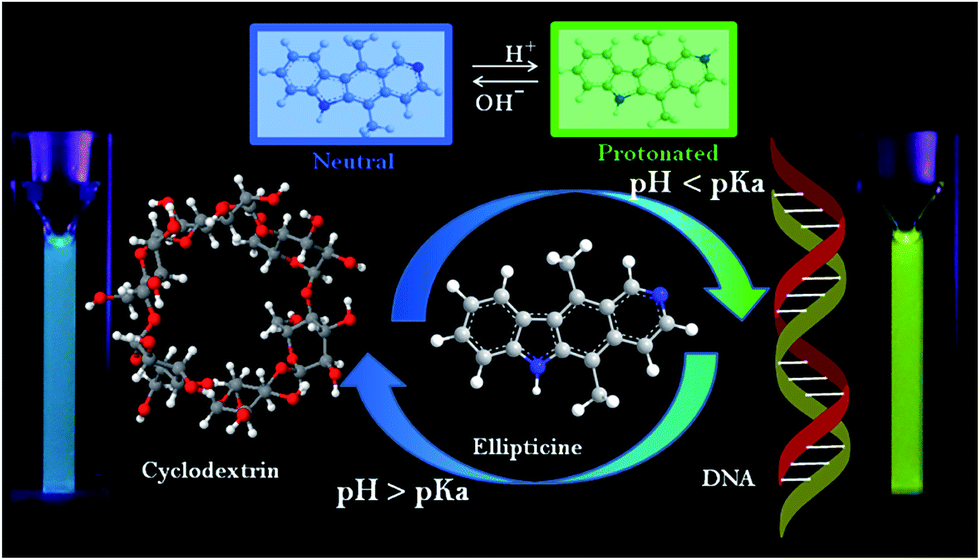 | ||
| Scheme 1 Different prototropic forms of ellipticine and its pH induced translocation between γ-CD and DNA. | ||
Experimental section
Ellipticine, γ-cyclodextrin and Calf Thymus DNA (CT-DNA) were purchased from Sigma Aldrich, and used without further purification. Millipore water was used for sample preparation. Fine adjustment of pH was done by drop wise addition of diluted hydrochloric acid (Merck, India, 90% pure) for lower pH range and 0.1 M sodium hydroxide (SRL, India, 98% pure) solution for the higher pH range. pH of the solution was measured by using pH-1500 (Eutech Instruments) and it was further cross checked by silicon micro sensor pocket sized pH meter (ISFETCOM Co. Ltd., Japan). The pH dependent study was done in two ways. One way is just changing the pH of the solution containing EPT, CD and DNA. Other way is by simply titrating EPT solutions at different pH with CD followed by DNA. Both of these results are found to be same and are presented here.Absorbance measurements were performed on Perkin-Elmer UV-visible spectrophotometer (Lambda-45), and steady-state fluorescence spectra were recorded in FluoroMax-4 spectrofluorimeter (Horiba Scientific, USA). All time-resolved fluorescence measurements (both life-time as well as anisotropy) were measured on a time correlated single photon counting (TCSPC) spectrometer (Horiba Jobin Yvon IBH, U.K.). In the present work, a 375 nm diode laser (1 MHz repetition rate) was used as the excitation source and MCP-PMT detector was used for collecting fluorescence signal. The instrument response function for this experimental set-up is ∼90 ps. The analysis of lifetime was done by IBH DAS6 analysis software, in which a reconvolution procedure was used to analyze the observed decays using a proper instrument response function obtained by replacing the sample cell with light scattering solution (suspension of Ludox colloidal solution). The fluorescence decays were analyzed as a sum of exponentials as
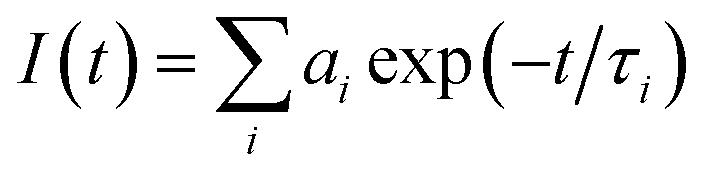 | (1) |
For time-resolved fluorescence anisotropy decay measurements, the polarized fluorescence decays for the parallel [I∥(t)] and perpendicular [I⊥(t)] emission polarizations with respect to the vertical excitation polarization were first collected at the emission maxima of the probe. Then, the anisotropy decay function r(t) was constructed from these I∥(t) and I⊥(t) decays using the following equation,
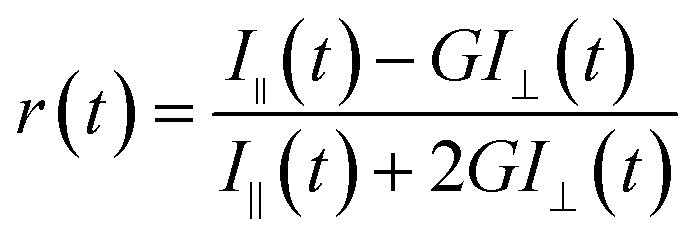 | (2) |
r(t) = r0[a1r![[thin space (1/6-em)]](https://www.rsc.org/images/entities/char_2009.gif) exp(−t/τ1r) + a2rexp(−t/τ2r)] exp(−t/τ1r) + a2rexp(−t/τ2r)] | (3) |
Circular dichroism (CD) spectra were recorded on a J-815 CD (JASCO, USA). Each CD profile is an average of 3 scans of the same sample collected at a scan speed 100 nm min−1, with a baseline correction of the blank buffer.
Results and discussion
Ellipticine shows three clear bands (∼300 nm, 350 nm and 420 nm) in absorption spectrum at pH 7 (Fig. 1a). As the ground state pKa of the drug is 7.4,17 these bands can be assigned to cation (C) form of the drug. In presence of γ-CD, the characteristic three bands of C form are vanished and new bands at ∼280 nm and 380 nm are observed. The new bands are previously ascribed to the neutral (N) form of EPT encapsulated in γ-CD.17 When DNA is introduced into this system (EPT and γ-CD), an additional band is appeared at ∼315 nm (Fig. 1a). Control experiment with DNA shows the similar band (∼315 nm) in the absorption spectrum of EPT. Thus, the results indicate that EPT molecules might have been released to DNA from CD nano-cavity. However, a small shoulder at 380 nm, which was assigned for γ-CD encapsulated EPT, still exists in the spectrum (Fig. 1). The existence of small hump at 380 nm indicates that minute population of EPT molecules still exist inside the CD nano-cavity. Next, to verify the effect of pH on release of the drug from γ-CD to DNA, we have changed the pH of the medium and the absorption spectra of EPT in presence of γ-CD and DNA collected at different pH conditions are shown in Fig. 1b. At lower pH (∼5.0), the band at ∼380 nm is vanished with an enhancement of shoulder peak at ∼315 nm, and it matches exactly with the absorption spectrum of EPT in presence of DNA alone, suggesting only C form of the drug might have been bound to DNA (Fig. 1b). On the hand, at higher pH (∼8.5), the absorption band at ∼380 nm is prevailed without any shoulder at ∼315 nm, and, this spectral feature exactly matches with EPT:γ-CD spectrum (Fig. 1), indicating translocation of drug from DNA to γ-CD. In summary, absorption results provide hints about the pH responsive translocation of the drug in between CD and DNA. Further information about the translocation process of the drug in between CD and DNA can be obtained from fluorescence and circular dichroism measurements discussed in the subsequent sections of this article.
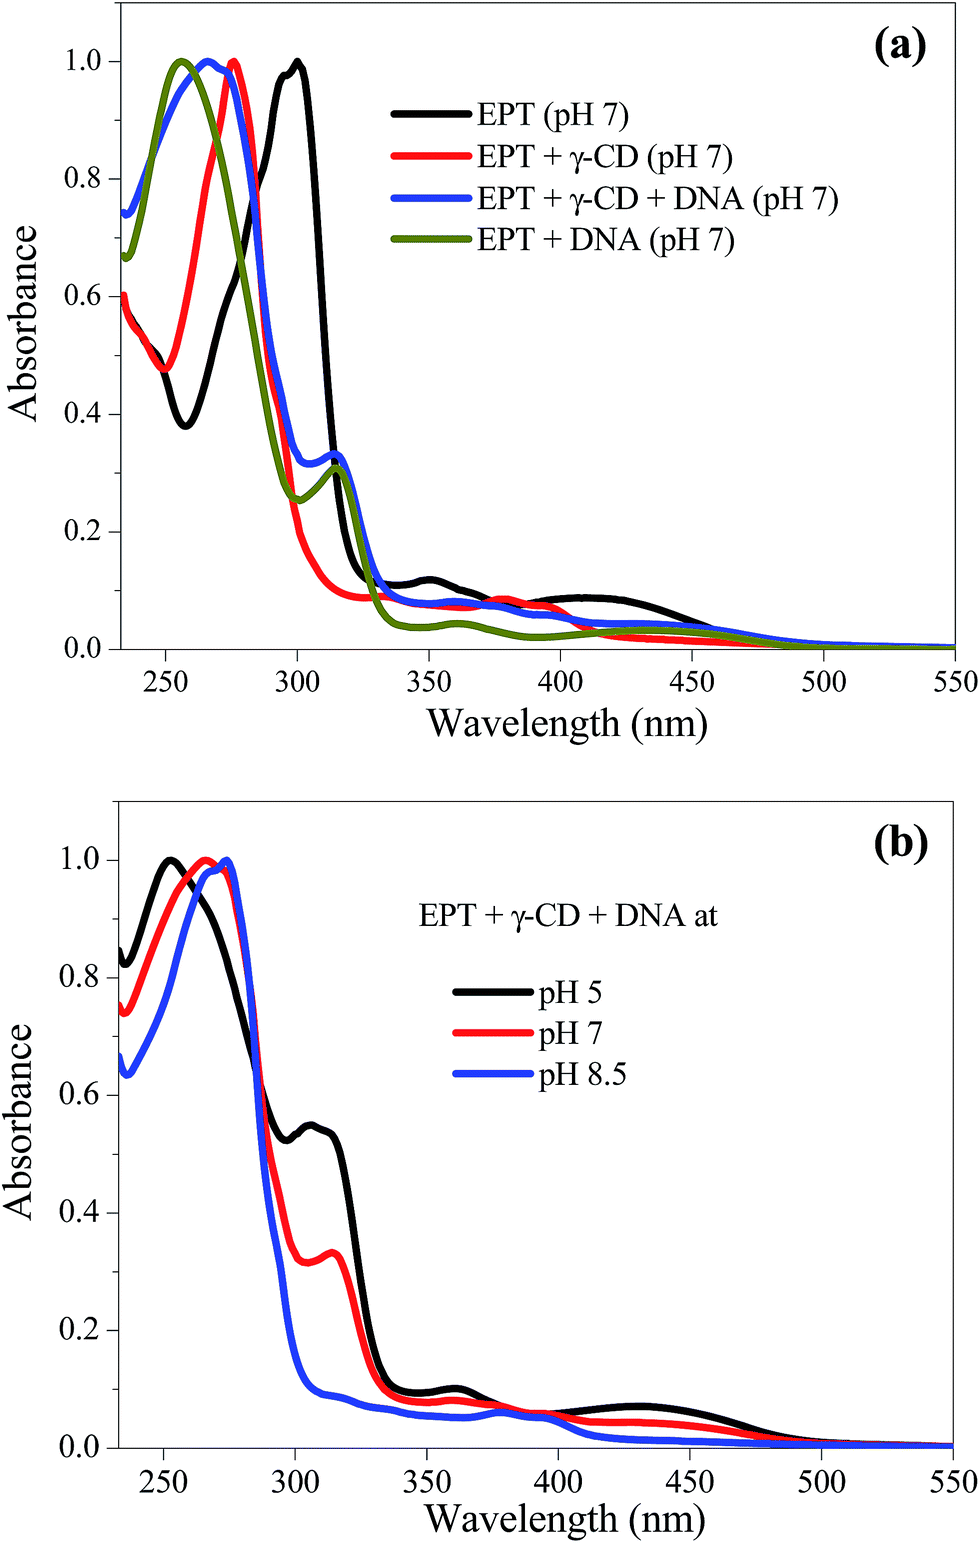 | ||
| Fig. 1 (a) Absorption spectra of EPT (15 μM) in absence and presence of γ-CD (10 mM) and DNA (100 μM) at pH 7. (b) pH dependent absorption spectra of EPT + γ-CD + DNA system. | ||
Irrespective of the different excitation wavelengths of three absorption bands, the drug exhibits single emission band with maximum at 530 nm (Fig. 2) attributed to the excited C form of EPT.17 In presence of γ-CD, this emission band undergoes a prominent blue shift (∼470 nm) with a huge increment in fluorescence intensity due to the conversion of C to N form inside the hydrophobic nano-cavities of γ-CD.17 To see whether the drug releases in presence of DNA or not, the γ-CD encapsulated EPT solution is titrated with ct-DNA. At pH 7, the addition of DNA to the γ-CD containing EPT solution, causes the appearance of new green fluorescence peak at ∼520 nm along with concomitant decrement of 470 nm peak (Fig. 2). It is known that C form of the EPT intercalates in DNA29 and results in vast increment of fluorescence intensity at 520 nm.24,25 Therefore, the appearance of green fluorescence peak for EPT in presence of γ-CD and DNA confirms that drug molecules translocate from γ-CD to DNA. However, a small shoulder at 470 nm still exists even at higher concentration of DNA, (Fig. 2), inferring that complete translocation doesn't take place from γ-CD to DNA at this pH condition. These results are further supported by association constants previously reported by our group.17,25 The binding constant for EPT with γ-CD (1.5 × 10⁵ M−1) is relatively lesser compared to the value with DNA (5.04 × 10⁵ M−1),17,25 which might cause the release of drug from CD to DNA. As both the association constants are not vastly different (as they are in the same order of magnitude), hence, it is expected that few population still exists inside the nano-cavity of γ-CD. Next, to verify the effect of pH on translocation of the drug between γ-CD and DNA, we have changed the pH of the medium and the emission spectra of EPT in presence of γ-CD and DNA collected at different pH conditions are shown in Fig. S1† and 2b. At lower pH (∼5.0), a clear single band at 520 nm is observed in emission spectrum without exhibiting any shoulder at ∼470 nm, and it matches exactly with the emission spectrum of EPT in presence of DNA, confirming that C form bound to DNA majorly exists in the medium (Fig. S1a†). This suggests that the lowering of pH converts encapsulated N to C form which cannot be stabilized in hydrophobic cavity of γ-CD, and eventually comes out of the nano-cavity and binds with DNA. Astonishingly at higher pH (∼8.5), we have noticed completely opposite trend i.e., the emission is completely switched to light blue color (at 470 nm). Notably, this emission spectral feature exactly matches with EPT:γ-CD case (Fig. S1b†). As this blue color emission is attributed to N form, we believe that at higher pH (>pKa) the drug predominantly exists in N form; hence, it prefers to go to hydrophobic nano-cavity of γ-CD. In a nutshell, the steady state results suggest that the drug selectively stays at DNA at lower pH even in presence of γ-CD, and exhibits green color. Whereas at higher pH, it is preferentially located to γ-CD (Fig. 2b) even in presence of DNA, and emits blue color. In this way the pH controls the location of the drug, and this kind of pH driven translocation of drug confirmed from fluorescence switch might find possible applications in controlled drug delivery and release process.
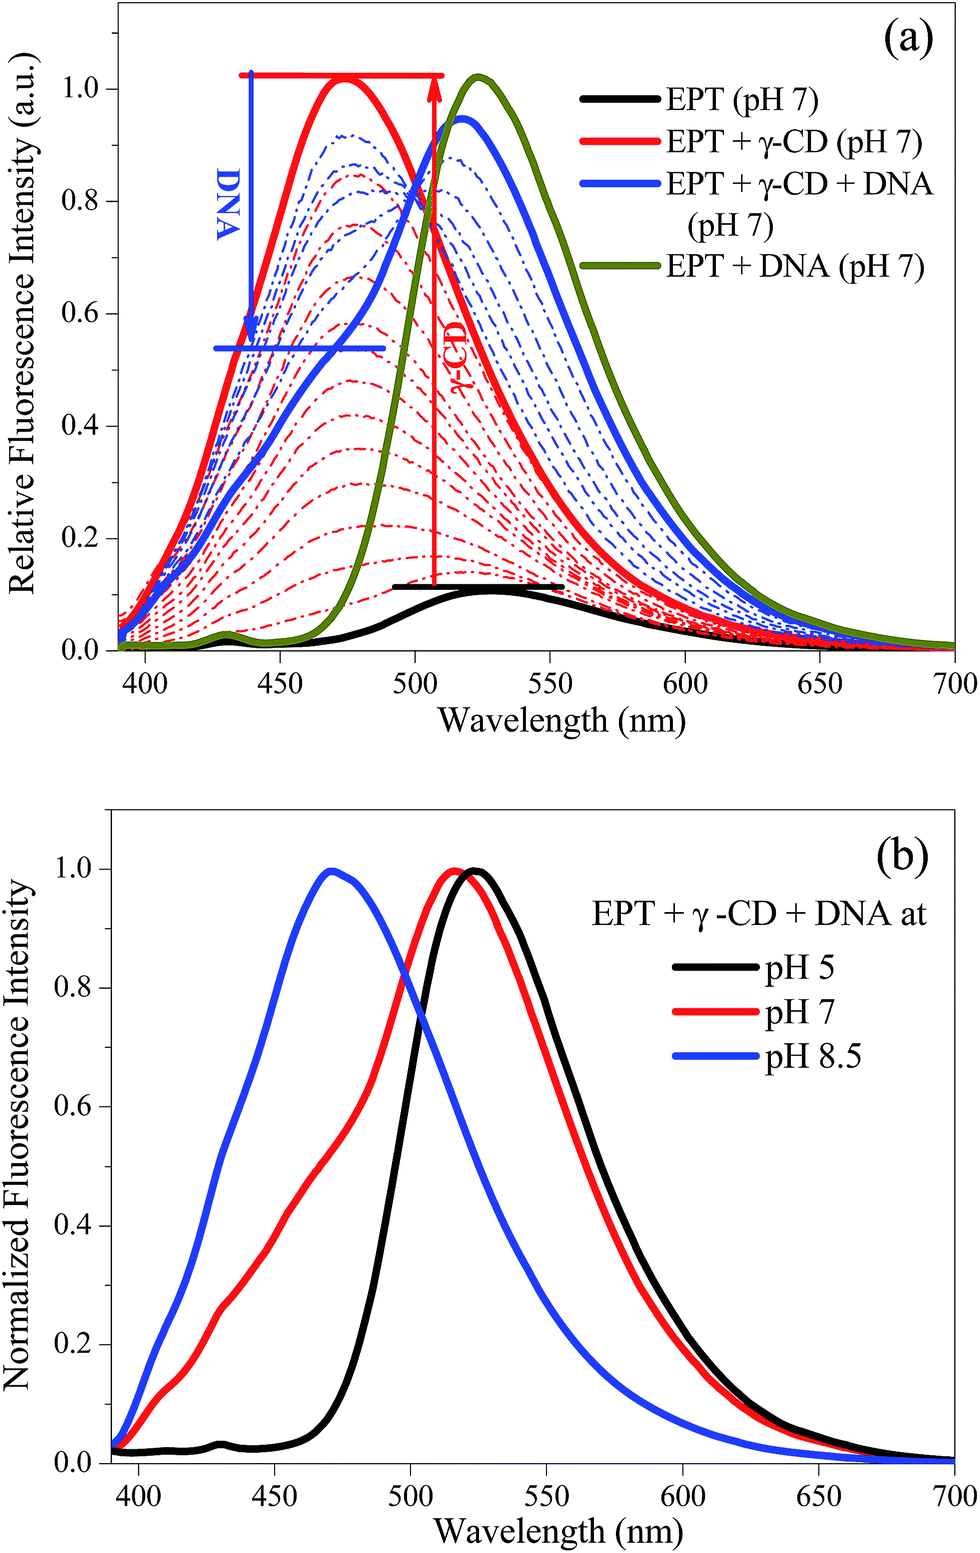 | ||
| Fig. 2 (a) Emission spectrum of EPT (15 μM) in absence and presence of γ-CD (10 mM) and DNA (100 μM) at pH 7. The direction of arrow indicates increase in concentration. (b) pH dependent emission spectra of EPT + γ-CD + DNA system. | ||
Time resolved fluorescence measurement is widely used technique to explore the excited state properties of the fluorophore. Thus fluorescence lifetime data can significantly contribute in realizing the translocation of EPT between γ-CD and DNA. The typical time-resolved fluorescence decay profiles are displayed in Fig. 3 and the fitting parameters are summarized in Table S1.† The decay profile of free drug (PBS, pH 7) monitored at 530 nm exhibits biexponential feature with the lifetime components of 2 ns (90%) and 5.55 ns (10%) correspond to C form in accordance with the previous literature.17,24 In presence of γ-CD (10 mM) a new longer lifetime component ∼32 ns is appeared (Fig. 3 and Table S1†) and this lifetime is attributed to the N form of EPT generated inside the nano-cavity of γ-CD.17 When DNA is introduced to this system, the longer lifetime component (32 ns) is decreased and converted to a new lifetime component with ∼16 ns. A similar lifetime component of EPT is observed in DNA alone system, and attributed to the DNA bound EPT molecule (Table S1†). The change in environment around the drug can cause this significant change in fluorescence lifetime. The higher lifetime component (32 ns) in γ-CD compared to DNA case (16 ns) may be attributed to the hydrophobic environment inside the nano-cavity of γ-CD. To further verify this translocation process, we have changed the pH of the medium and the fluorescence decays of EPT in presence of γ-CD and DNA are collected at different pH conditions (Fig. S2†). At lower pH (∼5), almost similar observations are found as that of pH 7, confirming that C form prevails at lower pH and it favorably interacts with DNA. On the other hand at higher pH (8.5), the decay feature exactly matches with the fluorescence decay of EPT in γ-CD alone without DNA (Fig. S2b†). These findings confirm that at higher pH the drug is translocated from DNA to γ-CD. Thus, the lifetime results are in accordance with the steady state findings, where we have observed pH dependent selective binding of EPT to either γ-CD or DNA even in presence of other biopolymer or macrocyclic host.
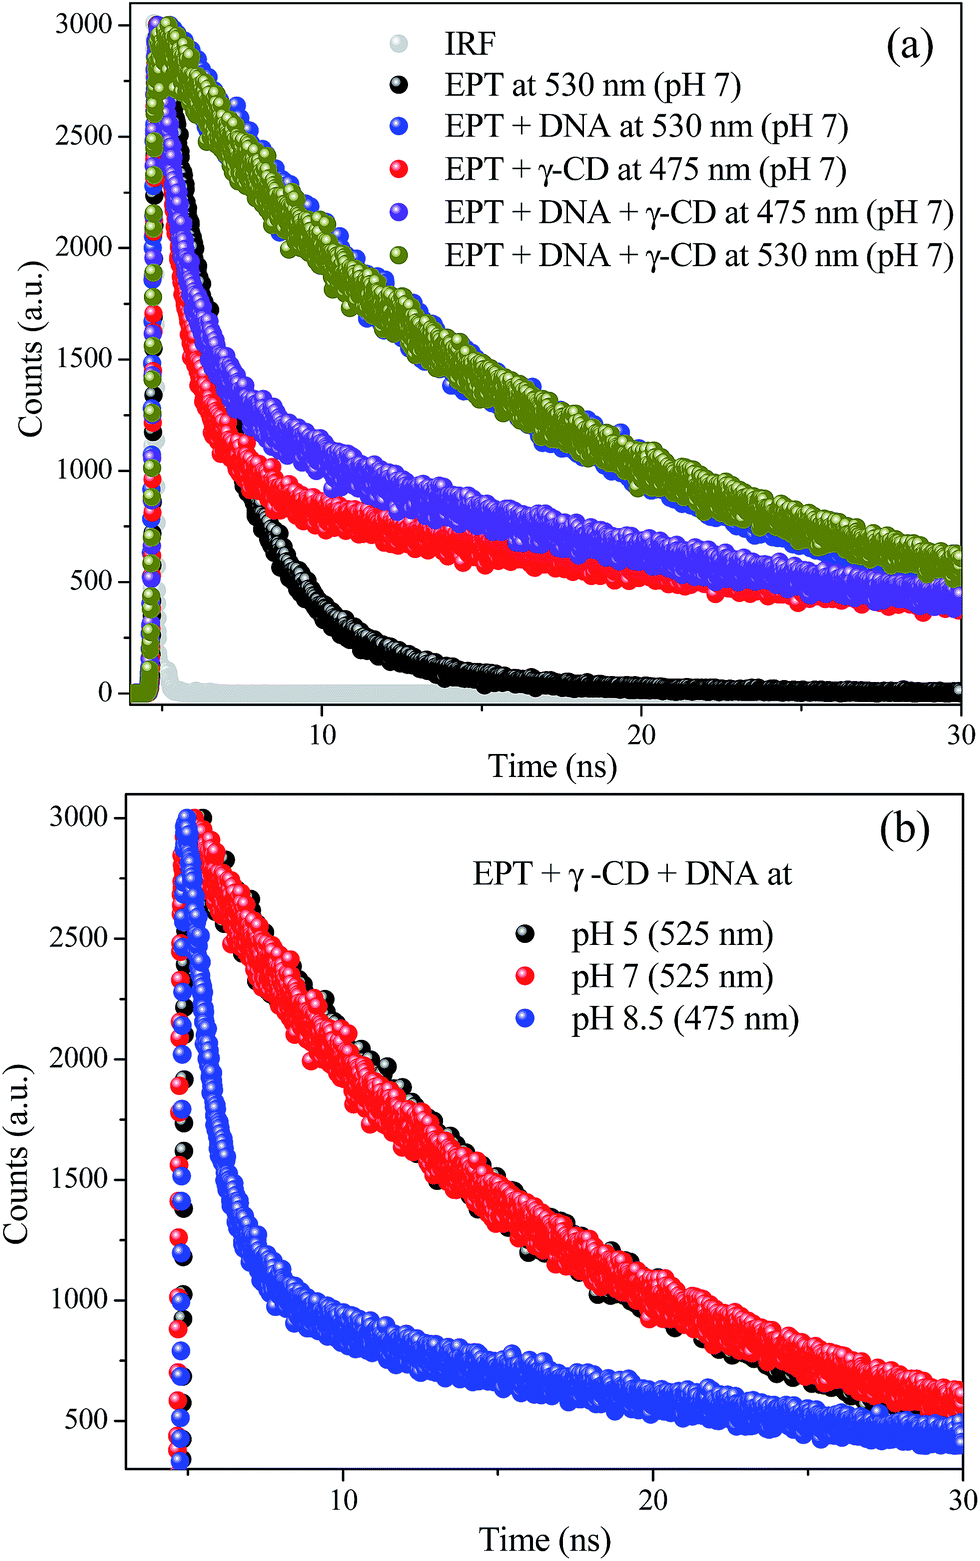 | ||
| Fig. 3 (a) Fluorescence transients of EPT (15 μM) in absence and presence of γ-CD (10 mM) and DNA (100 μM) at pH 7, collected at respective emission maximum. (b) pH dependent fluorescence transients of EPT + γ-CD + DNA system. | ||
Further information about rotational relaxation of ellipticine in aforementioned systems can be obtained from time resolved anisotropy measurements. As shown in Fig. 4 and Table S2,† EPT undergoes a fast rotational relaxation in aqueous buffer solution with a time scale of 130 ps. In presence of γ-CD, the rotational correlation time increases to 850 ps due to the encapsulation of EPT inside the γ-CD cavity.17 When DNA is introduced in to this system (EPT + γ-CD), the rotational relaxation time shoots up to 11 ns (Fig. 4 and Table S2†). The anisotropy decay collected at 525 nm exactly matches with the DNA containing EPT spectrum (Fig. 4), which confirms the location of drug on DNA. As the steady state spectrum contains a shoulder at 475 nm, we have also probed the rotational relaxation of the drug in EPT containing γ-CD and DNA solution at 475 nm, and we have found slow rotational relaxation of the drug, which matches very closely to the γ-CD bound EPT molecules. This observation indicates that some population of EPT molecules involve inclusion complex formation even in presence of DNA at this pH condition, which results in slow relaxation of EPT in γ-CD nano-cavity. To probe the translocation of EPT between two host molecules, pH of the medium is varied (Fig. 4b). At lower pH (∼5) anisotropy decay in γ-CD and DNA exhibits bi-exponential decay with an average correlation time of 10 ns (Fig. S3a†). Here the anisotropy decay of EPT in presence of γ-CD and DNA overlays with the EPT:DNA system (Fig. S3†). This indicates that at pH 5 the drug is translocated from γ-CD cavity to DNA. Whereas at higher pH (8.5), anisotropy decay of EPT in presence of γ-CD and DNA drastically decreases (Fig. 4b) and it matches with EPT:γ-CD decay (Fig. S3b†), confirming that at higher pH the drug is displaced from DNA to the nano-cavity of γ-CD. Thus, the anisotropy decay results also confirm that at lower pH (∼5), the drug release takes place from γ-CD to DNA, whereas it retains inside the γ-CD cavity at higher pH (8.5).
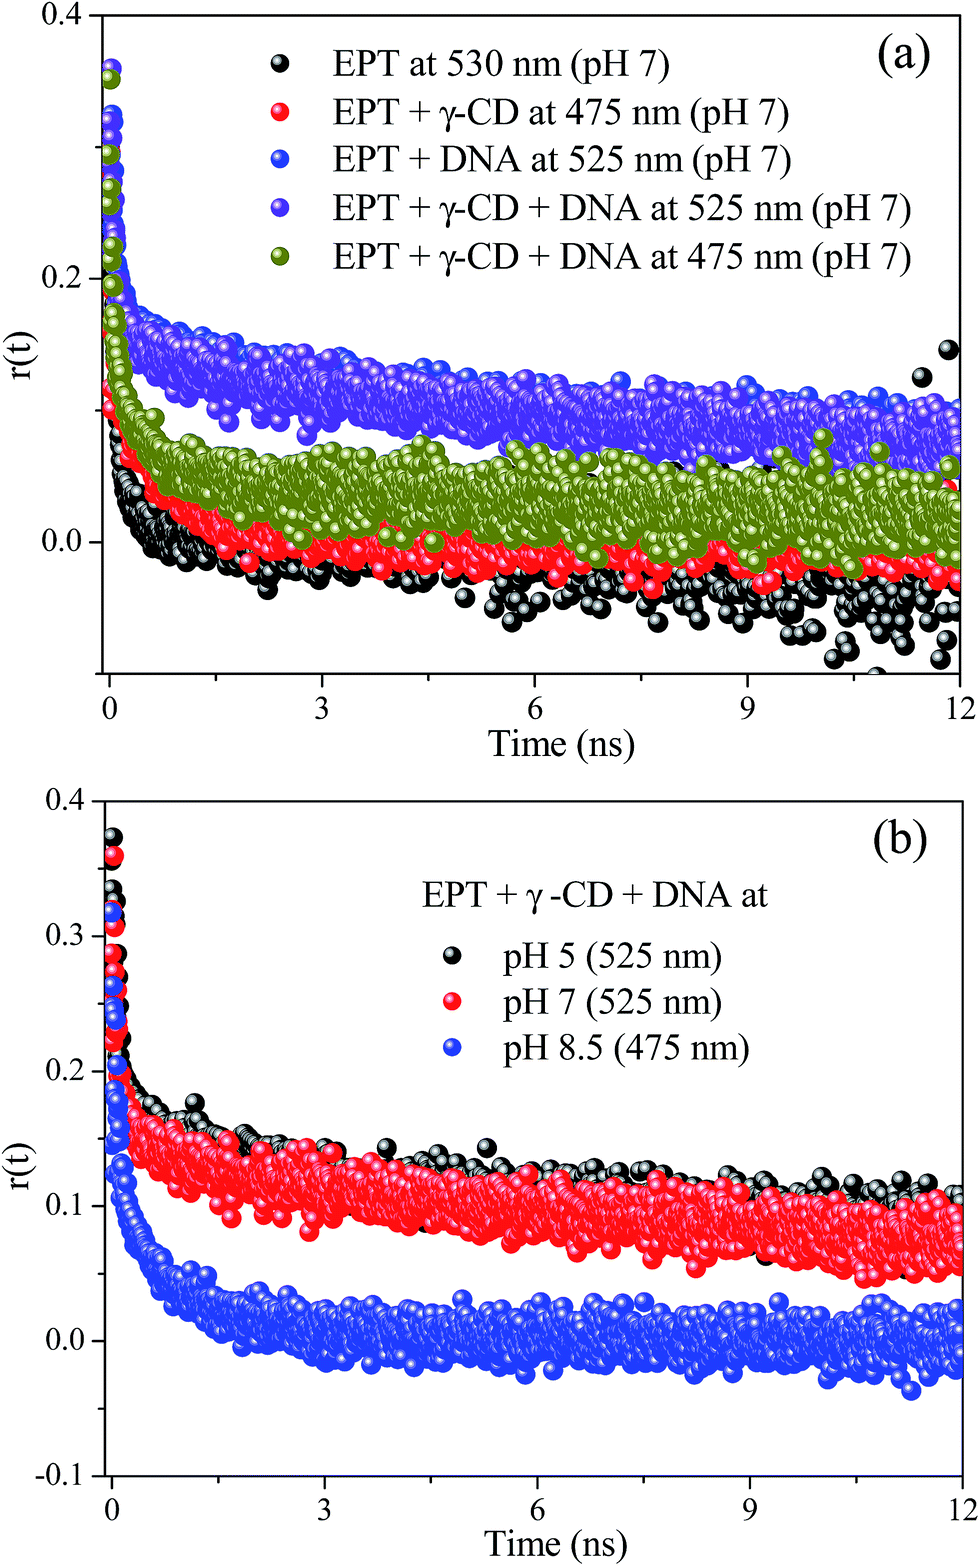 | ||
| Fig. 4 (a) Anisotropy transients of EPT (15 μM) in absence and presence of γ-CD (10 mM) and DNA (100 μM) at pH 7, collected at respective emission maximum. (b) pH dependent anisotropy transients of EPT + γ-CD + DNA system. | ||
Circular dichroism (CD) is utilized to further understand this pH responsive translocation phenomenon from DNA to cyclodextrin or vice versa. The CD spectrum of DNA at pH 7 buffer solution (Fig. 5a) exhibits a positive peak at ∼280 nm and a negative band at ∼245 nm, which correspond to a typical right handed B-form of DNA.30 In presence of EPT, the intensity of positive band (∼280 nm) is reduced with an additional positive band appearing at ∼320 nm in the CD spectrum. This band is exactly matching with the UV-visible absorption spectrum of EPT with DNA (Fig. 1). However, when we collected the CD spectrum for EPT alone in buffer, there is no peak observed in the spectrum. Thus, the 320 nm band in CD spectrum is assigned to induced CD signal, confirming the intercalation of drug in between the base pairs (Fig. 5a). With the addition of γ-CD to this solution, the ellipticity of the induced CD signal slightly reduces and a new shoulder at ∼300 nm is appeared (Fig. 5a). To understand the origin of the shoulder at ∼300 nm, we have collected CD profile in EPT containing γ-CD solution (in absence of DNA), and the system exhibits a positive CD signal at ∼300 nm (Fig. 5a). Neither EPT nor γ-CD alone can give this kind of CD signal. Therefore, the appeared CD signal is attributed to the induced signal due to the formation of inclusion complex between EPT and γ-CD. Hence, the observed shoulder for EPT, DNA and γ-CD system at pH 7 (Fig. 5a) indicates the existence of slight population of EPT:γ-CD inclusion complex. Notably, in steady state results, we have also noticed the existence of slight population of EPT:γ-CD inclusion complex, even though major population of drug molecules bind to ct-DNA. The pH of the solution is varied to translocate the drug from DNA to γ-CD or vice versa, and the results are shown in Fig. 5b and S4.† At pH 5, the drug bound to DNA exhibits similar induced CD signal at 320 nm (Fig. S4a†) as that of pH 7. However, with the addition of γ-CD to this solution, no significant change is observed in CD spectra (Fig. S4†). The absence of any shoulder at ∼300 nm confirms that the drug is translocated from γ-CD to DNA at pH 5. Interestingly, when the pH of the solution is increased to pH ∼8.5, addition of γ-CD to EPT containing DNA solution causes an appearance of structured bands in between 290–310 nm (Fig. S4b†). Moreover, the induced CD signal band at ∼320 nm responsible for DNA intercalation is vanished in presence of γ-CD (Fig. S4b†), inferring that most of the drug molecules are translocated from DNA to the nano-cavity of γ-CD. Hence, the circular dichroism results once again validate and confirm the pH induced reversible translocation of EPT in between DNA and γ-CD.
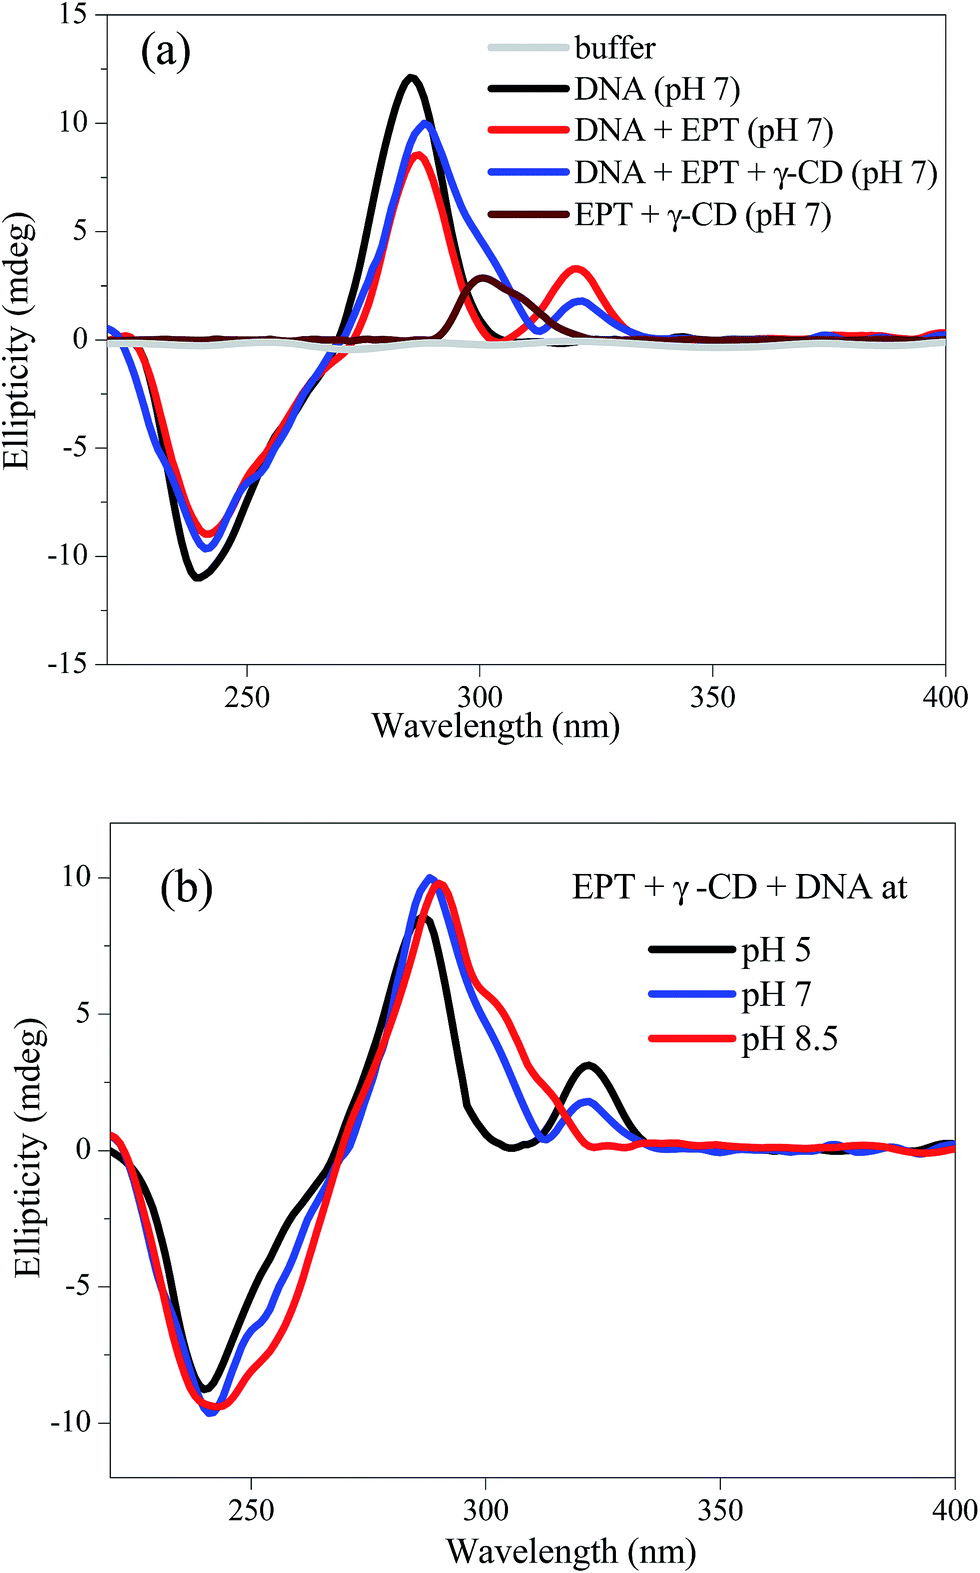 | ||
| Fig. 5 (a) Circular dichroism (CD) spectra of DNA (200 μM) in absence and presence of γ-CD (10 mM) and EPT (30 μM) at pH 7. (b) pH dependent CD spectra of EPT + γ-CD + DNA system. | ||
Although at physiological pH this release mechanism may not be efficient (as some of the drug population still exists inside the nano-cavity of CD), the novelty of the present work lies in the environmental pH responsive drug release. If the cyclodextrin encapsulated EPT enters to cell by endocytosis process, and home into lysosomal compartment (where the pH is ∼5.0),31 then the drug can be easily released from CD nano-cavity and interact with nuclear DNA, as we have shown that the drug is easily translocated from CD to DNA at lower pH. On the other hand, by chance, the CD encapsulated drug reaches to mitochondrial matrix (where the pH is ∼8.0),31 in that case, the drug will not release to interact with mitochondrial DNA, since the drug will not come out from CD matrix at higher pH. In this way, the pH of the surrounding environments will govern the efficacy of the drug release.
Conclusion
In summary, we have investigated the pH triggered interplay of EPT inside the nano-cavities of a supramolecular host γ-cyclodextrin and DNA using photophysical properties of the drug by means of steady-state and picosecond time-resolved fluorescence techniques. When EPT resides in γ-CD nano-cavity its fluorescence increases with a large hypsochromic shift whereas the fluorescence is enhanced several folds without such blue shift in presence of DNA. Based on these fluorescence changes, the transportation of drug between γ-CD and DNA is successfully monitored by simple change of pH of the medium. Steady state and time resolved studies confirm that at higher pH (∼8.5) the drug preferentially stays inside the nano-cavity of γ-CD and at lower pH (∼5.0) it resides in DNA. Circular dichroism results further confirm the translocation of EPT between above mentioned host molecules. Hence, by using the simple fluorescence switch one can monitor the location of drug, and this kind of pH driven translocation of drug might find possible applications in controlled drug delivery process.Acknowledgements
Authors thank IISER-Pune for providing excellent experimental and computation facilities. Authors are thankful to anonymous reviewers for their valuable suggestions and comments.References
- R. Liu, Y. Zhang, X. Zhao, A. Agarwal, L. J. Mueller and P. Feng, J. Am. Chem. Soc., 2010, 132, 1500–1501 CrossRef CAS PubMed.
- H. P. Rim, K. H. Min, H. J. Lee, S. Y. Jeong and S. C. Lee, Angew. Chem., Int. Ed., 2011, 50, 8853–8857 CrossRef CAS PubMed.
- X. Ma and Y. Zhao, Chem. Rev., 2015, 115, 7794–7839 CrossRef CAS PubMed.
- S. Mura, J. Nicolas and P. Couvreur, Nat. Mater., 2013, 12, 991–1003 CrossRef CAS PubMed.
- Y. Cao, X.-Y. Hu, Y. Li, X. Zou, S. Xiong, C. Lin, Y.-Z. Shen and L. Wang, J. Am. Chem. Soc., 2014, 136, 10762–10769 CrossRef CAS PubMed.
- I. Hwang, W. S. Jeon, H.-J. Kim, D. Kim, H. Kim, N. Selvapalam, N. Fujita, S. Shinkai and K. Kim, Angew. Chem., Int. Ed., 2007, 46, 210–213 CrossRef CAS PubMed.
- M. Sayed and H. Pal, Phys. Chem. Chem. Phys., 2015, 17, 9519–9532 RSC.
- Z. Qi and C. A. Schalley, Acc. Chem. Res., 2014, 47, 2222–2233 CrossRef CAS PubMed.
- Q. Hu, P. S. Katti and Z. Gu, Nanoscale, 2014, 6, 12273–12286 RSC.
- J. Su, F. Chen, V. L. Cryns and P. B. Messersmith, J. Am. Chem. Soc., 2011, 133, 11850–11853 CrossRef CAS PubMed.
- K. Engin, D. B. Leeper, J. R. Cater, A. J. Thistlethwaite, L. Tupchong and J. D. McFarlane, Int. J. Hyperthermia, 1995, 11, 211–216 CrossRef CAS PubMed.
- R. N. Dsouza, U. Pischel and W. M. Nau, Chem. Rev., 2011, 111, 7941–7980 CrossRef CAS PubMed.
- J. Zhang and P. X. Ma, Adv. Drug Delivery Rev., 2013, 65, 1215–1233 CrossRef CAS PubMed.
- K. Gavvala, W. D. Sasikala, A. Sengupta, S. A. Dalvi, A. Mukherjee and P. Hazra, Phys. Chem. Chem. Phys., 2013, 15, 330–340 RSC.
- T. Irie and K. Uekama, J. Pharm. Sci., 1997, 86, 147–162 CrossRef CAS PubMed.
- M. E. Brewster and T. Loftsson, Adv. Drug Delivery Rev., 2007, 59, 645–666 CrossRef CAS PubMed.
- K. Gavvala, A. Sengupta, R. K. Koninti and P. Hazra, J. Phys. Chem. B, 2013, 117, 14099–14107 CrossRef CAS PubMed.
- M. Shaikh, J. Mohanty, A. C. Bhasikuttan, V. D. Uzunova, W. M. Nau and H. Pal, Chem. Commun., 2008, 3681–3683 RSC.
- K. Uekama, F. Hirayama and T. Irie, Chem. Rev., 1998, 98, 2045–2076 CrossRef CAS PubMed.
- A. C. Bhasikuttan, J. Mohanty, W. M. Nau and H. Pal, Angew. Chem., Int. Ed., 2007, 46, 4120–4122 CrossRef CAS PubMed.
- J.-B. le Pecq, X. Nguyen Dat, C. Gosse and C. Paoletti, Proc. Natl. Acad. Sci. U. S. A., 1974, 71, 5078–5082 CrossRef CAS.
- M. Ohashi and T. Oki, Expert Opin. Ther. Pat., 1996, 6, 1285–1294 CrossRef CAS.
- S. Y. Fung, J. Duhamel and P. Chen, J. Phys. Chem. A, 2006, 110, 11446–11454 CrossRef CAS PubMed.
- R. K. Koninti, A. Sengupta, K. Gavvala, N. Ballav and P. Hazra, Nanoscale, 2014, 6, 2937–2944 RSC.
- A. Sengupta, R. K. Koninti, K. Gavvala, N. Ballav and P. Hazra, Phys. Chem. Chem. Phys., 2014, 16, 3914–3917 RSC.
- K. Gavvala, R. K. Koninti, A. Sengupta and P. Hazra, Phys. Chem. Chem. Phys., 2014, 16, 14953–14960 RSC.
- R. Thakur, A. Das and A. Chakraborty, Phys. Chem. Chem. Phys., 2012, 14, 15369–15378 RSC.
- F. Sureau, F. Moreau, J. M. Millot, M. Manfait, B. Allard, J. Aubard and M. A. Schwaller, Biophys. J., 1993, 65, 1767–1774 CrossRef CAS PubMed.
- A. Canals, M. Purciolas, J. Aymami and M. Coll, Acta Crystallogr., Sect. D: Biol. Crystallogr., 2005, 61, 1009–1012 CrossRef PubMed.
- J. Kypr, I. Kejnovská, D. Renčiuk and M. Vorlíčková, Nucleic Acids Res., 2009, 37, 1713–1725 CrossRef CAS PubMed.
- J. R. Casey, S. Grinstein and J. Orlowski, Nat. Rev. Mol. Cell Biol., 2010, 11, 50–61 CrossRef CAS PubMed.
Footnote |
| † Electronic supplementary information (ESI) available. See DOI: 10.1039/c5ra19839a |
| This journal is © The Royal Society of Chemistry 2015 |