Synthesis of g-C3N4 at different temperatures for superior visible/UV photocatalytic performance and photoelectrochemical sensing of MB solution†
Zhao Mo,
Xiaojie She,
Yeping Li,
Liang Liu,
Liying Huang,
Zhigang Chen,
Qi Zhang,
Hui Xu* and
Huaming Li*
School of Chemistry and Chemical Engineering, Institute for Energy Research, Jiangsu University, Zhenjiang 212013, P. R. China. E-mail: xh@ujs.edu.cn; lihm@ujs.edu.cn; Fax: +86-511-88791708; Tel: +86-511-88791800
First published on 10th November 2015
Abstract
In this paper, a simple preparation method was utilized to study for the optimum calcination temperature of graphitic carbon nitride (g-C3N4). The g-C3N4 prepared at different temperatures were characterized by X-ray diffraction (XRD), UV-vis diffuse reflectance spectroscopy (DRS) and so on. The results demonstrated that g-C3N4 could not be formed fully until the calcination temperature was higher than 500 °C. From DRS and photoluminescence (PL) spectrum, a red shift of absorption peaks with increasing calcination temperatures was found. This could enhance the visible light absorption, and then the photocatalytic activity would be improved. The photocatalytic activity was evaluated via the photodegradation of methylene blue (MB) and 4-chlorophenol (4-CP), respectively. Moreover, due to the gradual decrement trend of photocurrent intensity with addition of MB, g-C3N4 prepared at 650 °C could be used as a photoelectrochemical sensor to detect the existence of MB and estimate the concentration of MB. Hence g-C3N4 will become a promising candidate for photoelectrochemical applications.
1. Introduction
The increasing threats of environmental issues and energy shortage have hindered the development and survival of human society, numerous scientists and researchers are seeking green technologies to solve these problems.1 Because of several advantages such as clean, safe, economic and renewable properties, semiconductor photocatalytic technology has become a promising way over the past decade,2,3 which has been applied in many fields, such as degradation of organic pollutants,4 hydrogen evolution,5–7 energy storage,8,9 electronics,10 supercapacitors11 and CO2 photocatalytic reduction to hydrocarbon compounds.12,13The origin of semiconductor photocatalytic technology begins with the work of TiO2 electrodes for hydrogen evolution reaction.14 From then on, more and more researchers have devoted themselves to designing novel and highly efficient photocatalysts. As a promising “metal-free” and visible lighted photocatalyst, carbon nitride has several allotropes, the graphitic phase is the most stable phase under ambient conditions.15 The g-C3N4 was first synthesized by Berzelius and named “melon” by Liebig in 1834, it is a polyconjugated semiconductor composed of carbon and nitrogen atoms and it possesses a layered graphite-like structure.16 g-C3N4 is not only economic and environmental friendly, but also has unbeatable physicochemical properties of high chemical stability, thermal stability, photoelectrochemical property, inoxidizability, biological compatibility and waterproofness, which make g-C3N4 become valuable materials for photocatalysis-driven applications and has attracted a lot of attentions from researchers.17 Unlike TiO2, which is only a ultraviolet lighted photocatalyst, g-C3N4 is active in the visible region, which is due to its band gap energy of about 2.7 eV with suitable CB and VB positions (−1.1 eV and +1.6 eV, respectively).18 The synthesis strategies of g-C3N4 have been summarized by Thomas,19 such as thermal condensation, thermal nitridation, PVD (physical vapor deposition), CVD (chemical vapor deposition), solid state reaction and solvothermal method. It is worth noting that thermal condensation, as a simple and feasible method, has been the main method of synthesizing g-C3N4.1 The precursors of preparing g-C3N4 by thermal condensation are usually nitrogen-rich materials, such as urea, cyanamide, dicyandiamide, melamine and thiourea.20 Just because of superior physicochemical properties and simple synthesis method, g-C3N4 has been applied in many photocatalytic areas, such as photocatalytic hydrogen evolution, photocatalytic CO2 reduction, photocatalytic degradation of pollutants, photocatalytic organic syntheses and photocatalytic disinfection.21 However, due to the hindered marginal absorption of visible light and grain boundary effects, the efficiency of g-C3N4 in visible light is rather low.22 Therefore, it is very necessary to extend light absorption of g-C3N4. At the same time, the small surface area, the low quantum efficiency and low separation efficiency but high recombination rate of photogenerated electron–hole pairs still limit the development of g-C3N4.23,24 Many modification endeavors have been used to modify the electronic structures of g-C3N4 and enhance the photocatalytic performance of g-C3N4, such as noble metal deposition (Ag,25 Au,26 Pt,27 AuPd28); nonmetal doping (N,29 P,30 S31); metallic oxide compositing (CeO2,32 WO3,33 Fe2O3,34 Co3O4![[thin space (1/6-em)]](https://www.rsc.org/images/entities/char_2009.gif) 35); dye sensitization,36 designing novel nanostructures37 and designing an appropriate g-C3N4 textural structure.17 Except the above strategies, many literatures also reported the synthesis conditions of materials may affect the photocatalytic performance of g-C3N4, and traditional synthesis conditions mainly included the following, such as temperature,38,39 synthesis medium,40 atmosphere41 and pressure.42 The control of calcining temperature is easy relatively, which not only influences the surface microstructures of the photocatalysts, but also affects the photocatalytic activity. Therefore, the modification of g-C3N4 is very efficient to improve the optical absorption and photocatalytic performance.
35); dye sensitization,36 designing novel nanostructures37 and designing an appropriate g-C3N4 textural structure.17 Except the above strategies, many literatures also reported the synthesis conditions of materials may affect the photocatalytic performance of g-C3N4, and traditional synthesis conditions mainly included the following, such as temperature,38,39 synthesis medium,40 atmosphere41 and pressure.42 The control of calcining temperature is easy relatively, which not only influences the surface microstructures of the photocatalysts, but also affects the photocatalytic activity. Therefore, the modification of g-C3N4 is very efficient to improve the optical absorption and photocatalytic performance.
As a promising and simple analytical technique, photoelectrochemistry uses photocurrent as a detection signal, which has been drawn more attention.43 Generally, the sensor is a molecular receptor, which has changeable optical properties because of binding specific guests. Some photoelectrochemical materials (TiO2, SnO2, CdS, CdSe and g-C3N4) have been used as sensors.21 The g-C3N4 as a receptor can perform high sensitivity for photoelectrochemical detection. Some researches have proved that g-C3N4 exhibits excellent sensitivity for the detection of trace amounts of Cu2+.33,44
In this work, melamine was chosen as the precursor, and g-C3N4 was prepared by thermal condensation under different temperatures (450, 500, 550, 600, and 650 °C). The photocatalytic activity was evaluated by photodegrading MB and 4-CP. Thus the influence of calcination temperature on the activity was obtained and the possible visible/UV photocatalytic mechanisms were also discussed. Finally, it was worth noting that g-C3N4 could not only be used as a photocatalyst to degrade MB and 4-CP, but also could be a photoelectrochemical sensor to detect the existence and concentration of MB solution. The possible mechanism for the photoelectrochemical detection of MB was also discussed.
2. Experimental
2.1 Preparation of g-C3N4
The g-C3N4 was prepared by directly heating melamine in a muffle furnace. 2 g melamine was put into an alumina crucible with a cover and calcined at 450, 500, 550, 600, and 650 °C with a heating rate of 2 °C min−1, then kept for 2 h at this temperature. Finally, the coarse g-C3N4 was grinded into the powder before further characterization. The schematic illustration of g-C3N4 prepared at different temperatures was shown in Fig. S1.†2.2 Characterization of g-C3N4 prepared at different temperatures
The as-prepared g-C3N4 was analyzed by X-ray diffraction (XRD) by Bruker D8 diffractometer with Cu Kα radiation (λ = 1.5418 Å) in the range of 2θ = 10–80°. The structural information for samples was measured by Fourier transform infrared spectroscopy (FTIR, Avatar 470, Thermo Nicolet) using the standard KBr disk method. The morphology and structure of the samples were investigated with scanning electron microscope (SEM) and transmission electron microscopy (TEM). The SEM images were taken on a field-emission microscope by a JEOL JSM-7001F. The chemical composition of the samples was determined by an energy-dispersive X-ray spectroscope (EDS) operated at an acceleration voltage of 10 kV. The transmission electron microscopy (TEM) images were collected with a JEOL-JEM-2010 (JEOL, Japan) operated at 200 kV. The Brunauer–Emmett–Teller (BET) specific surface area of samples was recorded by using a Micromeritics TriStar II 3020 nitrogen adsorption apparatus (USA). All of the samples were degassed at 180 °C before measurement. The BET surface area was determined by a multipoint BET method using the adsorption data in the relative pressure (P/P0) range of 0.05–0.25. Elemental compositions were detected by X-ray photoelectron spectroscopy (XPS) analysis which was performed on an ESCALab MKII X-ray photo-electron spectrometer using the Mg Kα radiation. Ultraviolet visible (UV-vis) diffuse reflectance spectrums (DRS) of the samples were measured by using a UV-vis spectrophotometer (Shimadzu UV-2450, Japan) in the range of 200 to 800 nm. BaSO4 was used as the reflectance standard material. The photoluminescence (PL) spectra of the samples were obtained by a QuantaMaster & TimeMaster Spectrofluorometer with an excitation wavelength at 325 nm. X-band ESR spectra were recorded at ambient temperature on a JES FA200 spectrometer. The settings for the ESR spectrometer were as follows: center field, 336.496 mT; sweep width, 5 mT; microwave frequency, 9.5 GHz; modulation frequency, 100 kHz; power, 0.998 mW.2.3 Photoelectrochemical measurements
The photocurrents were measured with an electrochemical analyzer (CHI660B, Chen Hua Instruments, Shanghai, China) in a standard three-electrode configuration with a platinum wire as the counter electrode, Ag/AgCl (in saturated KCl) as a reference electrode, and Na2SO4 (0.1 M) aqueous solution as the electrolyte. A 500 W Xe arc lamp was utilized as a light source. 5 mg sample powder was dispersed ultrasonically in 1 mL of mixed solution (0.5 mL ethanol and 0.5 mL ethanediol), and 20 μL of the resulting colloidal dispersion (5 mg mL−1) was drop-cast onto a piece of ITO with a fixed area of 0.5 cm2, and dried under an infrared lamp to form the sample-modified ITO electrode. All the photocurrent measurements were performed at a constant potential of −0.2 V (vs. SCE).2.4 Photocatalytic activity
The photocatalytic activity of the prepared samples was evaluated by the photocatalytic degradation of MB solution under visible/UV light irradiation and 4-CP solution under UV light irradiation. A 300 W Xe lamp as the light source was set in the middle of the photocatalytic reactor. To provide the visible light for the photocatalytic reaction, a 400 nm cutoff filter was set beside the lamp. Moreover, the 100 mL quartz glass beaker which contained the photocatalyst and MB solution was set next to the cutoff filter and the distance between the center of the beaker and the lamp was about 10 cm. They were all at the same height and the light could irradiate the beaker evenly. In all the photocatalytic experiments, the lamp and the quartz glass beaker were set at the same place. So the light intensity was fixed. In each experiment, 0.0250 g photocatalysts were dispersed into the 50 mL MB solution (10 mg L−1) in a Pyrex photocatalytic reactor respectively. The reaction mixture was continuously aerated by a pump to provide O2. Prior to irradiation, the suspensions were magnetically stirred for 30 min in the dark to ensure that the MB could reach the absorption–desorption equilibrium on the photocatalyst surface. Furthermore, all experiments were performed at 30 °C under constant stirring. At defined time irradiation intervals, 3 mL solution suspension was withdrawn and centrifuged (13![[thin space (1/6-em)]](https://www.rsc.org/images/entities/char_2009.gif) 000 rpm, 3 min) to separate the photocatalyst, the filtrates of MB analyzed with a UV-vis spectrophotometer (UV-2450, Shimadzu) at the maximal absorption wavelength of MB whose characteristic absorption peak was chosen to be 664 nm.
000 rpm, 3 min) to separate the photocatalyst, the filtrates of MB analyzed with a UV-vis spectrophotometer (UV-2450, Shimadzu) at the maximal absorption wavelength of MB whose characteristic absorption peak was chosen to be 664 nm.
A medium pressure 250 W mercury vapor lamp was used as the UV source. In each experiment, 0.0250 g photocatalysts were dispersed into the 50 mL 4-CP solution (10 mg L−1) in a Pyrex photocatalytic reactor respectively. The concentration of 4-CP was determined by a HPLC (Waters 1525) system, all substances were detected by a UV detector at 280 nm, the eluent consisted of a ternary mixture of water, methanol and acetonitrile (40![[thin space (1/6-em)]](https://www.rsc.org/images/entities/char_2009.gif) :
:![[thin space (1/6-em)]](https://www.rsc.org/images/entities/char_2009.gif) 50
50![[thin space (1/6-em)]](https://www.rsc.org/images/entities/char_2009.gif) :
:![[thin space (1/6-em)]](https://www.rsc.org/images/entities/char_2009.gif) 10 by volume), the flow rate was 1 mL min−1. The other experimental conditions were the same as the photocatalytic degradation of MB.
10 by volume), the flow rate was 1 mL min−1. The other experimental conditions were the same as the photocatalytic degradation of MB.
The photocatalytic degradation efficiency (E) was obtained by the following formula:
3. Results and discussion
3.1 Enhancement of photocatalytic activity
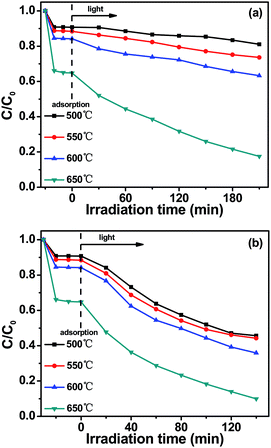
The photocatalytic activity of g-C3N4 prepared at different temperatures was tested via the photodegradation of MB under visible light irradiation, as shown in Fig. 1a. The adsorption test was pre-conducted in dark for 30 min and then degradation proceeded at t = 0. The adsorption test results showed that the absorption–desorption equilibrium has been reached, so the adsorption of MB over each sample could be neglected under visible light irradiation. The adsorption efficiencies of g-C3N4 prepared at 500, 550, 600 and 650 °C were about 9.21%, 11.56%, 15.77% and 35.25% for MB, respectively. It could be seen clearly that, g-C3N4 prepared at 650 °C exhibited the highest adsorptive ability and the adsorption efficiency of g-C3N4 increased with increasing temperatures, these which were consistent well with their surface areas. It was found that g-C3N4 prepared at 650 °C exhibited the highest photocatalytic activity, and the photocatalytic degradation efficiency of MB was up to about 82.50% after 3.5 h irradiation. The photocatalytic degradation efficiency of g-C3N4 prepared at 500, 550 and 600 °C were about 18.92%, 26.41%, 36.70% after 3.5 h irradiation, respectively. At the same time, the photocatalytic degradation of MB under UV light irradiation was done and the results were shown in Fig. 1b. It could be seen clearly that, the photocatalytic degradation efficiency of g-C3N4 prepared at 500, 550, 600 and 650 °C were about 54.30%, 55.75%, 64.06% and 90.07% after 140 min UV light irradiation respectively. The g-C3N4 prepared at 650 °C exhibited the highest photocatalytic activity under UV light irradiation, which agreed with the photocatalytic degradation of MB under visible light irradiation. Obviously, it was interesting that, from the results of photocatalytic degrading MB under visible and UV light irradiation, the photocatalytic activity of g-C3N4 increased with increasing temperatures, indicating that the calcination temperature of g-C3N4 affected photocatalytic activity. The higher calcination temperature may enhance the photocatalytic degradation efficiency. Compared with g-C3N4 prepared at 500, 550 and 600 °C, the photocatalytic degradation efficiency of g-C3N4 prepared at 650 °C has been greatly improved.In the meantime, the photocatalytic activity of g-C3N4 prepared at different temperatures was further studied by 4-chlorophenol (4-CP) as model colorless organic pollutant, which was shown in Fig. S2a.† The photocatalytic degradation efficiency of g-C3N4 prepared at 500, 550, 600 and 650 °C was about 79.18%, 84.90%, 89.81% and 66.62% respectively. The results indicated that g-C3N4 prepared at different temperatures also showed a high photo-catalytic activity in degrading 4-CP.
3.2 Kinetics
The kinetics of MB photodecomposition on the catalyst surface could be described by the pseudo-first-order reaction model| ln(C0/C) = kt |
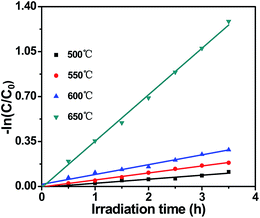 | ||
| Fig. 2 Kinetic fit for the degradation of MB under visible light irradiation with g-C3N4 prepared at different temperatures. | ||
Moreover, the stability of the photocatalyst was also an important factor to influence its practical application. As shown in Fig. 3, the photocatalytic activity of g-C3N4 prepared at 650 °C only reduced a little after four cycles, which could be due to the loss of g-C3N4 during the test period. The results indicated that g-C3N4 prepared at 650 °C had a satisfying stability.
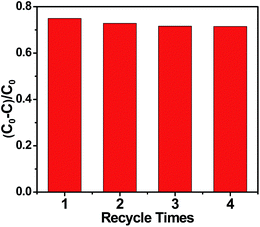 | ||
| Fig. 3 Cycling runs for the photocatalytic degradation of MB in the presence of g-C3N4 prepared at 650 °C under visible light irradiation. | ||
3.3 Photoelectrochemical detection of MB
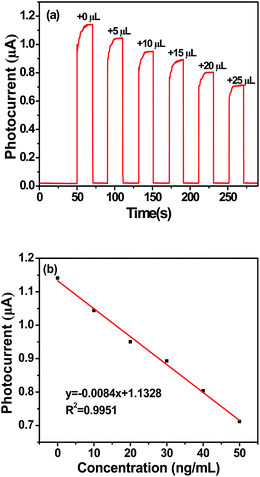
Fig. 4a depicted the typical time-based photocurrent response of the photoelectrochemical sensor in the presence of different concentrations of MB. It could be seen that the rise and fall of the photocurrent conformed well to the irradiation being switched on and off. The photocurrent response of the electrode modified by g-C3N4 prepared at 650 °C decreased gradually for every 5 μL increase of MB. Fig. 4b showed the linear calibration plots between the photocurrent response and the concentrations of MB. The linear regression equation was y = −0.0084x + 1.1328 with a correlation coefficient (R2) of 0.9951.3.4 Structure and morphology characterization of g-C3N4 prepared at different temperatures
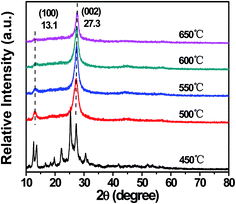
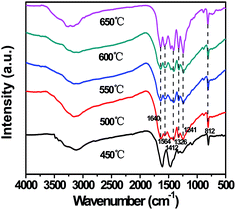
XRD patterns were used to identify the crystal structure of g-C3N4 prepared at different temperatures, which were shown in Fig. 5. The XRD patterns of g-C3N4 prepared at 500, 550, 600, and 650 °C showed two major diffraction peaks which occurred at around 13.1° and 27.3°, and no diffraction peaks of other impurity phase were detected in all the samples. The strong peak at around 27.3° could be indexed as (002), which was due to interplanar stacking of aromatic systems. The weak one at 13.1° was corresponding to (100) plane, which put down to an in-planar structural packing motif. These two characteristic diffraction peaks were consistent with the g-C3N4 reported before.33 However, in the XRD pattern, it was found that the characteristic peaks of sample synthesized at 450 °C were different from other samples, which belonged to melem derivatives.45 This phenomenon may be put down to the low polycondensation intermediate of melamine.18 The XRD patterns indicated that when the calcination temperature was lower than 500 °C, the crystal structure was different from g-C3N4, this meant that the sample synthesized at 450 °C was not g-C3N4. Then, when the calcination temperature was higher than 500 °C, the samples fully formed into g-C3N4. In addition, as shown in Fig. S3,† when the calcination temperature reached 700 °C, it was empty in the alumina crucible after calcination, which indicated that g-C3N4 could be completely decomposed.The chemical structure of g-C3N4 prepared at different temperatures was further investigated by FT-IR spectroscopy, as shown in Fig. 6. No obvious difference could be observed in the spectra of g-C3N4 synthesized at 500, 550, 600, and 650 °C. All IR bands resembled the absorption bands of the pure g-C3N4 reported before.4 Comparing with g-C3N4 synthesized at 500, 550, 600, and 650 °C, the absorption peaks of the sample (450 °C) between 1000 and 1750 cm−1 were broader. This phenomenon also meant that there were intermediate products such as ammelide in the sample. Thus the sample synthesized at 450 °C was not g-C3N4, which was consistent with the previous XRD result shown in Fig. 5. The strong peaks at 1640, 1564, 1412, 1326 and 1241 cm−1 were attributed to the typical stretching modes of C![[double bond, length as m-dash]](https://www.rsc.org/images/entities/char_e001.gif) N and C–N heterocycles.47 In addition, the sharp band at 812 cm−1 was observed,46,48 which could be assigned to the characteristic breathing mode of the s-triazine units. The broad bands between 3600 cm−1 and 3000 cm−1 were assigned to N–H stretching and a small number of adsorbed H2O.49 All the characteristic peaks of g-C3N4 could be found from FT-IR spectra of g-C3N4 synthesized at 500, 550, 600, and 650 °C, indicating that only when the calcination temperature was higher than 500 °C, the samples fully formed into g-C3N4.
N and C–N heterocycles.47 In addition, the sharp band at 812 cm−1 was observed,46,48 which could be assigned to the characteristic breathing mode of the s-triazine units. The broad bands between 3600 cm−1 and 3000 cm−1 were assigned to N–H stretching and a small number of adsorbed H2O.49 All the characteristic peaks of g-C3N4 could be found from FT-IR spectra of g-C3N4 synthesized at 500, 550, 600, and 650 °C, indicating that only when the calcination temperature was higher than 500 °C, the samples fully formed into g-C3N4.
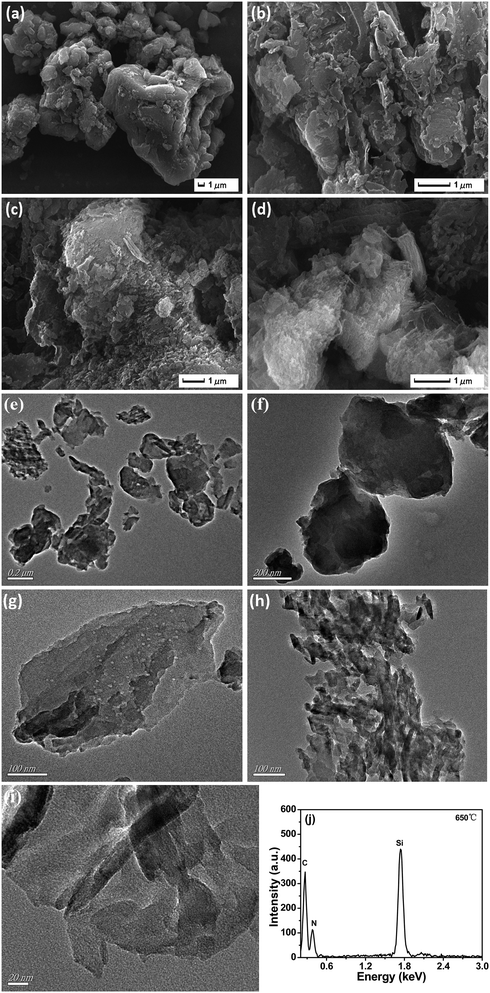
Fig. 7 showed the SEM and TEM images of g-C3N4 prepared at different temperatures, which investigated the microstructure of g-C3N4 prepared at different temperatures. Fig. 7a showed the morphology of g-C3N4 prepared at 500 °C was lumpy. It could be clearly seen from Fig. 7b to d, with the temperature increasing, g-C3N4 became more and more slacking gradually, this could effectively increase the surface area of g-C3N4. As we known the enlarged surface area could provide more active sites and absorption sites to adsorb reactants. Typical TEM images of g-C3N4 prepared at different temperatures could be seen from Fig. 7e to h, the structure of g-C3N4 became much thinner and fluffier. It was worth noting that a few pores appeared on the surface of g-C3N4 prepared at 600 °C and when the calcination temperatures rose to 650 °C, many pores started to fuse, which may increase the surface area of g-C3N4 greatly. The high-magnification TEM image of g-C3N4 prepared at 650 °C was shown in Fig. 7i, which showed g-C3N4 prepared at 650 °C was almost transparent, this was due to its thin structure. The results indicated that g-C3N4 prepared at 650 °C was fluffy.51
The chemical composition of g-C3N4 synthesized at 650 °C was confirmed by EDS, which was shown in Fig. 7j. The peaks of C, N were observed and no other impurity peak was found, except the peak of Si (this was attributed to the silicon wafers), the result indicated that the sample synthesized at 650 °C was still g-C3N4.
In order to determine whether the specific surface area of g-C3N4 increased with varying calcination temperature, the nitrogen adsorption–desorption isotherms were shown in Fig. S4.† The BET specific surface areas were 7.1 m2 g−1, 8.6 m2 g−1, 11.7 m2 g−1, and 46.8 m2 g−1 for g-C3N4 prepared at 500, 550, 600, and 650 °C, respectively. The BET specific surface area of g-C3N4 prepared at 650 °C was about 6.6 times of g-C3N4 prepared at 500 °C. These results further demonstrated that the surface area of g-C3N4 has been improved greatly with the temperature increasing, which was also in accordance with the observed morphology in the SEM and TEM images. The enlarged surface area could offer more reactive sites and adsorb more pollutants. Thus, the photocatalytic performance could be improved.
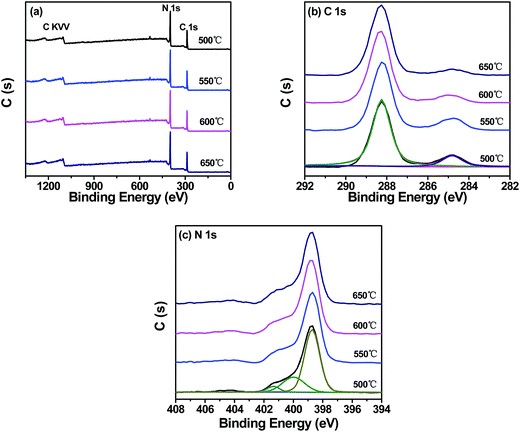
The XPS spectra were measured to determine the chemical composition and chemical states of g-C3N4 prepared at different temperatures, as shown in Fig. 8. The survey XPS spectra of g-C3N4 prepared at different temperatures showed similar features. In addition, C, N and a small amount of O peaks (which is usually ascribed to the adsorbed water) could be found in all samples and no peaks of other elements were observed, indicating that all the samples kept the same chemical composition and chemical states. As shown in Fig. 8b, the high-resolution C 1s spectrum of g-C3N4 prepared at different temperatures showed similar features, then C 1s could be further separated into two peaks at about ∼288.26 and ∼284.81 eV, which were related to the N–C–N coordination and carbon contamination, respectively.50 Fig. 8c showed the high-resolution N 1s spectrum of g-C3N4 prepared at different temperatures. It could be seen that the positions and intensities corresponding to main peaks of all the samples were the same. It could be found that N 1s could be deconvoluted into three peaks at about ∼398.69 eV, ∼399.99 and ∼401.35 eV, respectively. The peak at about ∼398.69 eV could be ascribed to the aromatic N bonded to two carbon atoms (C![[double bond, length as m-dash]](https://www.rsc.org/images/entities/char_e001.gif) N–C).2 Two other peaks at about ∼399.99 and ∼401.35 eV were assigned to the tertiary N bonded to carbon atoms (C–N(–C)–C) and the amino function group carrying a hydrogen (C–N–H).51 Thus, according to the above XPS analysis, no obvious binding energy shift of g-C3N4 prepared at different temperatures has been found, indicating that all the g-C3N4 prepared at different temperatures were at the same chemical states.
N–C).2 Two other peaks at about ∼399.99 and ∼401.35 eV were assigned to the tertiary N bonded to carbon atoms (C–N(–C)–C) and the amino function group carrying a hydrogen (C–N–H).51 Thus, according to the above XPS analysis, no obvious binding energy shift of g-C3N4 prepared at different temperatures has been found, indicating that all the g-C3N4 prepared at different temperatures were at the same chemical states.
3.5 Optoelectronic properties
The optical property played an important role in the photocatalytic activity, so the DRS spectra of g-C3N4 prepared at different temperatures were investigated, as shown in Fig. 9a. It could be seen that as the color of g-C3N4 prepared at different temperatures shifted from light yellow to darkorange, there was an obvious redshift of the range 470–570 nm in the absorption band edge, which indicated increasing temperatures enhanced the absorption in the visible light region. The enhanced light absorption of g-C3N4 prepared at 650 °C contributed to producing more electron–hole pairs under the visible light irradiation. The redshift may be caused by the increase of the polymerization degree and the π-plane conjugation degree. This could enhance the visible light absorption effectively. From Fig. 9b, it could be seen that the band gap energy of g-C3N4 prepared at 500, 550, 600 and 650 °C was estimated to be about 2.83 eV, 2.78 eV, 2.71 eV and 2.74 eV, respectively. This indicated that the band of g-C3N4 got narrower with the calcination temperature increased, which could improve the photocatalytic activity of g-C3N4. Therefore the g-C3N4 prepared at 600 °C and 650 °C had a higher efficiency for absorbing visible light. However, the structure of g-C3N4 prepared at 650 °C was fluffier, so compared with g-C3N4 prepared at 600 °C, g-C3N4 prepared at 650 °C stayed slightly blueshifted, this may be due to the quantum confinement effect.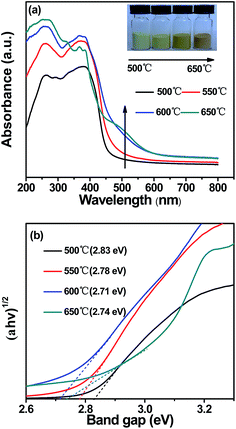 | ||
| Fig. 9 (a) UV-vis diffuse reflectance spectra and (b) estimated band gaps of g-C3N4 prepared at different temperatures. | ||
The separation efficiency of photogenerated electrons and holes was investigated by photoluminescence spectra analysis. Fig. S5† showed the PL spectra of g-C3N4 prepared at different temperatures. The position of the emission peak of g-C3N4 prepared at different temperatures was located at 456, 466, 483 and 491 nm. It could be clearly found that, the center of PL showed a slightly red shift with the temperature rising constantly. At the same time, the PL intensities of g-C3N4 decreased with increasing temperatures from 500 °C to 650 °C. This indicated that g-C3N4 prepared at 650 °C could have a lowest recombination rate of photoinduced electron and hole. Therefore, increasing temperatures was conducive to the separation of photoinduced electron–hole in g-C3N4, which exhibited that higher temperature could bring about higher photoactivity.
To further understand the separation and transfer of photoinduced electron–hole, the transient photocurrent responses of g-C3N4 prepared at different temperatures were monitored by using intermittent on–off irradiation cycles, as shown in Fig. 10. When the light was on, the photocurrent intensity increased to a constant value. Then come back to a constant value until the light was turned off. The photocurrents of the samples presented a good reproducibility and stable. The photocurrent responses of g-C3N4 increased with increasing temperatures (from 450 °C to 650 °C). This indicated that, as the synthesized temperatures rose, the separation and transfer of photoinduced electron–hole were more and more efficient. The photocurrent of g-C3N4 prepared at 650 °C showed the highest efficient, which was conducive to photocatalytic activity.
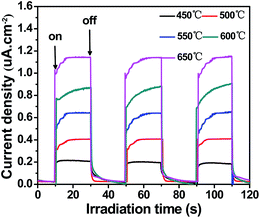 | ||
| Fig. 10 Photocurrent responses of g-C3N4 prepared at different temperatures under visible light irradiation ([Na2SO4] = 0.1 M). | ||
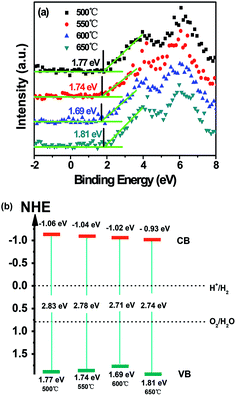 | ||
| Fig. 11 (a) VB XPS spectra of g-C3N4 prepared at different temperatures and (b) schematic illustration of the band structures of g-C3N4 prepared at different temperatures. | ||
Besides that, the photogenerated charge separation process could also be investigated by electrochemical impedance spectroscopy (EIS). The EIS Nyquist plots of g-C3N4 prepared at different temperatures in dark were shown in Fig. S6.† The smaller arc radius meant a higher efficiency of separation and charge transfer. Obviously, the arc radius of g-C3N4 prepared at 650 °C was the smallest, so g-C3N4 prepared at 650 °C presented the fastest charge transfer rate, this phenomenon was consistent with the result of photocurrent responses.
3.6 Possible photocatalytic mechanism and detection mechanism
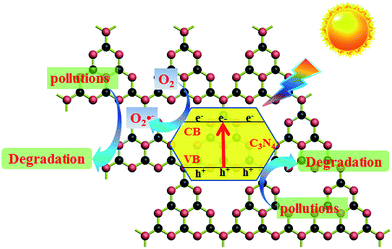
The efficiency of separation and transfer of photoinduced electron–hole was known as the key factor to improve the photocatalytic activity.15 Therefore, the higher calcination temperature may enhance the efficiency of separation and transfer of photoinduced electron–hole of g-C3N4. Thus the photocatalytic activity of g-C3N4 was improved. The potential positions of the conduction band (CB) and valence band (VB) of g-C3N4 may affect the efficiency of separation and transfer of photoinduced electron–hole. The VB of g-C3N4 prepared at different temperatures were examined by the valence band X-ray photoelectron spectroscopy (VB XPS). This method has been widely used in some scientific researches,52,53 which was shown in Fig. 11a. It could be seen clearly that, the values of EVB about g-C3N4 prepared at 500, 550, 600 and 650 °C were revealed to be about 1.77 eV, 1.74 eV, 1.69 eV and 1.81 eV, respectively. Eg was the band gap energy of the semiconductor, in Fig. 9b, Eg of g-C3N4 prepared at 500, 550, 600 and 650 °C was estimated to be about 2.83 eV, 2.78 eV, 2.71 eV and 2.74 eV, respectively. Due to ECB = EVB − Eg, the values of ECB was counted to be about −1.06 eV, −1.04 eV, −1.02 eV and −0.93 eV, respectively. According to the potentials of the CB and VB edges, the schematic illustration of the band structures of g-C3N4 prepared at different temperatures was shown in Fig. 11b. It could be found that the conduction band and valence band potentials of g-C3N4 became more negative with the calcination temperature increased except g-C3N4 prepared at 650 °C. But the conduction band and valence band potentials of g-C3N4 prepared at 650 °C were also more negative than g-C3N4 prepared at 550 °C and 500 °C. The more negative conduction band and valence band potentials enhanced the effective separation and transfer of photoinduced electron–hole, so the MB and 4-CP could be degraded more efficient with the calcination temperature increased.To further study the photocatalytic mechanism, the main active oxygen species which contributed to the photocatalytic activity were investigated by the ESR measurements. As shown in Fig. 12a, no obvious ESR signal was found in the dark. From Fig. 12b, the characteristic peaks of superoxide radicals (O2˙−) were observed under visible light irradiation, but there was no characteristic peaks of hydroxyl radicals (OH˙). It could be seen clearly in Fig. 12c, it was similar to Fig. 12b and the ESR signal intensity of superoxide radicals (O2˙−) became stronger under UV light irradiation than which under visible light irradiation. It could be understood that, UV-light could release more energy than visible light. To sum up in conclusion, O2˙− radicals are the active oxygen species in photodegradation of pollutants. In addition, as everyone knows, holes (h+) could oxidize organic pollutants directly. Thus the synergistic effect of O2˙− radicals and holes (h+) photodegradated organic pollutants in the photocatalytic reaction system. Based on the ESR measurements, the photocatalytic mechanism of g-C3N4 in the degradation of MB under the visible light irradiation was shown in Fig. 13. When the visible or UV light irradiated, g-C3N4 could produce photo-generated electrons and holes, the electrons of g-C3N4 jumped into the conduction band, and the electrons combined with O2 to generate superoxide radicals (O2˙−), then superoxide radicals (O2˙−) could photodegradate organic pollutants. In addition, the photoinduced holes could participate in the photocatalytic oxidation reactions directly.
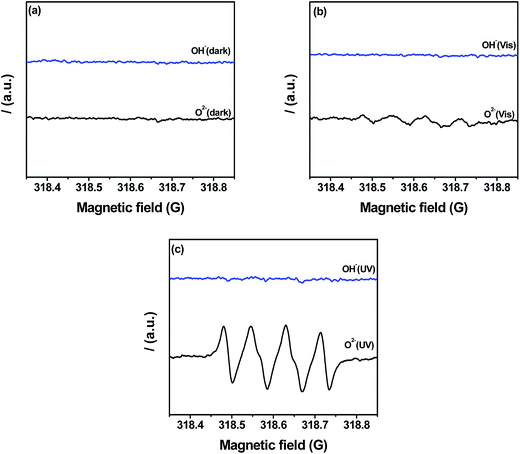 | ||
| Fig. 12 ESR spectra of g-C3N4 prepared at 650 °C (a) in the dark; (b) after visible light irradiation and (c) under UV-light irradiation. | ||
In the present experiments of photocatalytic degrading MB under visible and UV light irradiation, the g-C3N4 prepared at 650 °C showed the highest photocatalytic activity. The enhanced photocatalytic activity could be attributed to the synergistic effect. Firstly, high specific surface area could provide more active sites and absorption sites, which may play an important role in the photocatalytic activity. Secondly, the enhanced efficiency of separation and transfer of photoinduced electron–hole was also good for the photocatalytic activity. Finally, the enhanced visible-light absorption may play a very important role in the photocatalytic degradation of MB under visible light irradiation, which was proved by the DRS spectra.
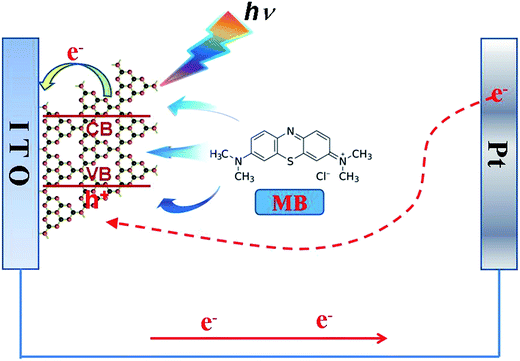
The possible photoelectrochemical mechanism for detection of MB was discussed in Fig. 14. When the visible light irradiated the surface of the ITO/g-C3N4 electrode, the g-C3N4 prepared at 650 °C was excited and underwent charge-separation to generate electrons (e−) and holes (h+). First, photo-generated electron transferred to the ITO electrode, and then transferred to the Pt reference electrode and transferred to g-C3N4 and recombine with holes, forming a cycle. When MB was added into solution, MB could be adsorbed by g-C3N4. This phenomenon could be observed, when the concentration of MB in the system of the electrode was increased, as shown in Fig. S7.† Thus, the surface of g-C3N4 would adsorb more and more MB with increase of MB gradually, this would inhibit the excitation of g-C3N4. Therefore, the separation rate of photoinduced electron–hole was slowed down, which could lead to decrease of the photocurrent response. Based on the gradual decreased tendency of photocurrent response, the g-C3N4 prepared at 650 °C could be used as a photoelectrochemical sensor for detecting the concentration of MB.
4. Conclusions
In summary, g-C3N4 prepared at different temperatures was fabricated by a simple procedure and lower-priced precursor (melamine). The g-C3N4 showed a better photocatalytic activity for MB photodegradation with the calcination temperature increasing and g-C3N4 prepared at 650 °C exhibited the highest photocatalytic activity, at the same time g-C3N4 prepared at 650 °C had an extraordinary stability after four cycles. Moreover, the photocatalyst could also photodegrade colorless organic pollutant under UV-light irradiation. The proposed photoelectrochemical sensor showed high sensitivity about the existence and concentration of MB, which opened up a new perspective for the photoelectrochemical application. Further research analysis revealed that, the enhanced photocatalytic activity and sensitive photoelectrochemical detection may come from (a) the enhanced visible-light absorption (the main reason), (b) the much fluffier structure with higher calcination temperature, (c) more reactive sites provided by enlarged surface area, (d) the extraordinary efficiency of the separation and transfer of photoinduced electron–hole.Acknowledgements
The authors genuinely appreciate the financial support of this work from the National Nature Science Foundation of China. The authors genuinely appreciate the financial support of this work by the National Nature Science Foundation of China (21476097, 21476098, 21407065 and 21406094), the Natural Science Foundation of Jiangsu Province (BK20131207 and BK2012717, BK20140533) and A Project Funded by the Priority Academic Program Development of Jiangsu Higher Education Institutions.References
- S. W. Cao, J. X. Low, J. G. Yu and M. Jaroniec, Adv. Mater., 2015, 27, 2150–2176 CrossRef CAS PubMed.
- H. Xu, Y. X. Song, Y. H. Song, J. X. Zhu, T. T. Zhu, C. B. Liu, D. X. Zhao, Q. Zhang and H. M. Li, RSC Adv., 2014, 4, 34539–34547 RSC.
- M. Bowker, Green Chem., 2011, 13, 2235–2246 RSC.
- Y. J. Cui, Z. X. Ding, P. Liu, M. Antonietti, X. Z. Fu and X. C. Wang, Phys. Chem. Chem. Phys., 2012, 14, 1455–1462 RSC.
- S. Trasatti, J. Electroanal. Chem., 1972, 39, 163–184 CrossRef CAS.
- Z. L. Wang, J. M. Yan, Y. Ping, H. L. Wang, W. T. Zheng and Q. Jiang, Angew. Chem., Int. Ed., 2013, 52, 4406–4409 CrossRef CAS PubMed.
- X. B. Chen, S. H. Shen, L. J. Guo and S. S. Mao, Chem. Rev., 2010, 110, 6503–6570 CrossRef CAS PubMed.
- Y. W. Zhu, S. Murali, M. D. Stoller, K. J. Ganesh, W. W. Cai, P. J. Ferreira, A. Pirkle, R. M. Wallace, K. A. Cychosz, M. Thommes, D. Su, E. A. Stach and R. S. Ruoff, Science, 2011, 332, 1537–1541 CrossRef CAS PubMed.
- C. H. Xu, B. H. Xu, Y. Gu, Z. Q. Xiong, J. Sun and X. S. Zhao, Energy Environ. Sci., 2013, 6, 1388–1414 CAS.
- H. Du, X. Xie, Q. Zhu, L. Lin, Y. F. Jiang, Z. K. Yang, X. Zhou and A. W. Xu, Nanoscale, 2015, 7, 5752–5759 RSC.
- T. Kavitha, A. I. Gopalan, K. P. Lee and S. Y. Park, Carbon, 2012, 50, 2994–3000 CrossRef CAS.
- J. Mao, T. Y. Peng, X. H. Zhang, K. Li, L. Q. Ye and L. Zan, Catal. Sci. Technol., 2013, 3, 1253–1260 CAS.
- J. L. Lin, Z. M. Pan and X. C. Wang, ACS Sustainable Chem. Eng., 2014, 2, 353–358 CrossRef CAS.
- A. Fujiashima and K. Honda, Nature, 1972, 238, 37–38 CrossRef.
- L. Ge, C. C. Han, X. L. Xiao and L. L. Guo, Appl. Catal., B, 2013, 142–143, 414–422 CrossRef CAS.
- F. Fina, S. K. Callear, G. M. Carins and J. T. S. Irvine, Chem. Mater., 2015, 27, 2612–2618 CrossRef CAS.
- H. Xu, J. Yan, Y. G. Xu, Y. H. Song, H. M. Li, J. X. Xia, C. J. Huang and H. L. Wan, Appl. Catal., B, 2013, 129, 182–193 CrossRef CAS.
- X. C. Wang, K. Maeda, A. Thomas, K. Takanabe, G. Xin, J. M. Carlsson, K. Domen and M. Antonietti, Nat. Mater., 2009, 8, 76–80 CrossRef CAS PubMed.
- A. Thomas, A. Fischer, F. Goettmann, M. Antonietti, J. Müller, R. Schlögl and J. M. Carlsson, J. Mater. Chem., 2008, 18, 4893–4908 RSC.
- J. J. Zhu, P. Xiao, H. L. Li and S. A. C. Carabineiro, ACS Appl. Mater. Interfaces, 2014, 6, 16449–16465 CAS.
- G. P. Dong, Y. H. Zhang, Q. W. Pan and J. R. Qiu, J. Photochem. Photobiol., C, 2014, 20, 33–50 CrossRef CAS.
- Y. J. Zhang, T. Mori, L. Niu and J. H. Ye, Energy Environ. Sci., 2011, 4, 4517–4521 CAS.
- Y. M. He, J. Cai, T. T. Li, Y. Wu, Y. M. Yi, M. F. Luo and L. H. Zhao, Ind. Eng. Chem. Res., 2012, 51, 14729–14737 CrossRef CAS.
- S. Chu, Y. Wang, Y. Guo, J. Y. Feng, C. C. Wang, W. J. Luo, X. X. Fan and Z. G. Zou, ACS Catal., 2013, 3, 912–919 CrossRef CAS.
- X. J. Bai, R. L. Zong, C. X. Li, D. Liu, Y. F. Liu and Y. F. Zhu, Appl. Catal., B, 2014, 147, 82–91 CrossRef CAS.
- J. Liu, Y. M. Yang, N. Y. Liu, Y. Liu, H. Huang and Z. H. Kang, Green Chem., 2014, 16, 4559–4565 RSC.
- J. G. Yu, K. Wang, W. Xiao and B. Cheng, Phys. Chem. Chem. Phys., 2014, 16, 11492–11501 RSC.
- C. C. Han, L. E. Wu, L. Ge, Y. J. Li and Z. Zhao, Carbon, 2015, 92, 31–40 CrossRef CAS.
- X. J. Bai, L. Wang, R. L. Zong and Y. F. Zhu, J. Phys. Chem. C, 2013, 117, 9952–9961 CAS.
- Y. J. Zhou, L. X. Zhang, J. J. Liu, X. Q. Fan, B. Z. Wang, M. Wang, W. C. Ren, J. Wang, M. L. Li and J. L. Shi, J. Mater. Chem. A, 2015, 3, 3862–3867 CAS.
- G. Chen and S. P. Gao, Chin. Phys. B, 2012, 21, 107101 CrossRef.
- X. J. She, H. Xu, H. F. Wang, J. X. Xia, Y. H. Song, J. Yan, Y. G. Xu, Q. Zhang, D. L. Du and H. M. Li, Dalton Trans., 2015, 44, 7021–7031 RSC.
- Y. Hou, F. Zuo, A. P. Dagg, J. K. Liu and P. Y. Feng, Adv. Mater., 2014, 26, 5043–5049 CrossRef CAS PubMed.
- L. Xu, X. J. Xia, H. Xu, S. Yin, K. Wang, L. Y. Huang, L. G. Wang and H. M. Li, J. Power Sources, 2014, 245, 866–874 CrossRef CAS.
- C. C. Han, L. Ge, C. F. Chen, Y. J. Li, X. L. Xiao, Y. N. Zhang and L. L. Guo, Appl. Catal., B, 2014, 147, 546–553 CrossRef CAS.
- S. X. Min and G. X. Lu, J. Phys. Chem. C, 2012, 116, 19644–19652 CAS.
- H. Xu, J. Yan, X. J. She, L. Xu, J. X. Xia, Y. G. Xu, Y. H. Song, L. Y. Huang and H. M. Li, Nanoscale, 2014, 6, 1406–1415 RSC.
- J. G. Yu, H. G. Yu, B. Cheng, X. J. Zhao, J. C. Yu and W. K. Ho, J. Phys. Chem. B, 2003, 107, 13871–13879 CrossRef CAS.
- M. Hamadanian, A. Reisi-Vanani and A. Majedi, Appl. Surf. Sci., 2010, 256, 1837–1844 CrossRef CAS.
- R. Mehdi and T. Nasrin, Mater. Chem. Phys., 2011, 129, 249–255 CrossRef.
- Y. L. Chen, D. Z. Li, X. C. Wang, X. X. Wang and X. Z. Fu, Chem. Commun., 2004, 2304–2305 RSC.
- B. S. Liu, X. J. Zhao, Q. N. Zhao, C. L. Li and X. He, Mater. Chem. Phys., 2005, 1, 53–63 Search PubMed.
- W. W. Tu, J. P. Lei, P. Wang and H. X. Ju, Chem.–Eur. J., 2011, 17, 9440–9447 CrossRef CAS PubMed.
- L. Xu, J. X. Xia, H. Xu, J. Qian, J. Yan, L. G. Wang, K. Wang and H. M. Li, Analyst, 2013, 138, 6721–6726 RSC.
- V. W. Lau, M. B. Mesch, V. Duppel, V. Blum, J. Senker and B. V. Lotsch, J. Am. Chem. Soc., 2015, 137, 1064–1072 CrossRef CAS PubMed.
- A. Thomas, A. Fischer, F. Goettmann, M. Antonietti, J. Muller, R. Schlogl and J. M. Carlsson, J. Mater. Chem., 2008, 18, 4893–4908 RSC.
- Y. G. Li, J. Zhang, Q. S. Wang, Y. X. Jin, D. H. Huang, Q. L. Cui and G. T. Zou, J. Phys. Chem. B, 2010, 114, 9429–9434 CrossRef CAS PubMed.
- Q. J. Xiang, J. G. Yu and M. Jaroniec, J. Phys. Chem. C, 2011, 115, 7355–7363 CAS.
- A. B. Jorge, D. J. DMartin, M. T. S. Dhanoa, A. S. Rahman, N. Makwana, J. Tang, A. Sella, F. Corà, S. Firth and J. A. Darr, J. Phys. Chem. C, 2013, 117, 7178–7185 CAS.
- Y. Zheng, J. Liu, J. Liang, M. Jaroniec and S. Z. Qiao, Energy Environ. Sci., 2012, 5, 6717–6731 CAS.
- X. J. She, H. Xu, Y. G. Xu, J. Yan, J. X. Xia, L. Xu, Y. H. Song, Y. Jiang, Q. Zhang and H. M. Li, J. Mater. Chem. A, 2014, 2, 2563–2570 CAS.
- F. Dong, Z. W. Zhao, T. Xiong, Z. L. Ni, W. D. Zhang, Y. J. Sun and W. K. Ho, ACS Appl. Mater. Interfaces, 2013, 5, 11392–11401 CAS.
- J. H. Li, B. Shen, Z. H. Hong, B. Z. Lin, B. F. Gao and Y. L. Chen, Chem. Commun., 2012, 48, 12017–12019 RSC.
Footnote |
| † Electronic supplementary information (ESI) available. See DOI: 10.1039/c5ra19586a |
| This journal is © The Royal Society of Chemistry 2015 |


