DOI:
10.1039/C5RA19585C
(Paper)
RSC Adv., 2015,
5, 94462-94473
Development of a multifunctional biomimicking L-cysteine based oxovanadium(IV) complex: synthesis, DFT calculations, bromo-peroxidation and nuclease activity
Received
22nd September 2015
, Accepted 20th October 2015
First published on 20th October 2015
Abstract
An oxovanadium complex [VO(sal-L-cys)(phen)] (sal-L-cys = Schiff base derived from salicylaldehyde and L-cysteine; phen = 1,10-phenanthroline) has been synthesized and characterized by spectroscopic studies (IR, UV-vis, ESI-MS and EPR studies). The structure of the complex has been optimized by density functional theory (DFT) calculations. Time-dependent DFT (B3LYP) calculations were used to establish and understand the nature of the electronic transitions observed in UV-vis spectra of the ligand and the complex. The multifunctionality of this oxovanadium complex has been exhibited by the application of it as a catalyst in peroxidative bromination of phenol red to demonstrate vanadium dependent bromoperoxidase activity, whereas nuclease activity has been established by DNA cleavage. The interaction of DNA with this structurally characterized oxovanadium complex has been studied by various physicochemical tools like UV-vis, fluorescence, and viscosity measurement studies. The intrinsic binding constant of the complex with DNA has been determined by electronic absorption studies and calculated to be (3.51 ± 0.02) × 104 M−1. The spectroscopic studies and the viscosity measurements indicate that the complex binds CT DNA by an intercalative mode. The ability of the complex to induce DNA cleavage was studied by gel electrophoresis techniques. The complex has been found to promote cleavage of pUC19 plasmid DNA from the super coiled (SC) form I to nicked coiled (NC) relaxed form II.
Introduction
The continuous escalation of interest in vanadium chemistry with multidentate ligands is based on the remarkable biological and pharmacological properties1 of vanadium. Vanadium, an essential biometal, is involved in various catalytic and inhibitory processes.2 It is present in many abiotic as well as biotic systems. It also plays several roles such as cofactors in metalloenzymes3 and metalloproteins.4 Many oxovanadium complexes are known to possess potent insulin-mimetic effects5 and anticancer activity,6 which merits the increasing application of vanadium complexes to biomedical sciences. The discovery of vanadium-dependent haloperoxidase enzymes (VHPO) in 1983 (ref. 7) from Ascophyllum nodosum marine algae boosts the attention of researchers to explore the coordination chemistry of vanadium for modeling various vanadium containing biomimetic and biomimicking molecules to get a better understanding on the mechanism of interaction of vanadium with biogenic molecules. Vanadium haloperoxidase (VHPO) catalyses the oxidative halogenation of organic compounds8 (hydrocarbons and alcohols, organic sulfide etc.) in presence of halide ions9 and hydrogen peroxide under physiological conditions. Irrespective of their origin they all show a high degree of amino acid homology with oxovanadium moiety in their active centers. The peroxidative bromination is an important route for the biosynthesis of many natural brominated organic compounds.10 Such importance of the VHPO reactions warrants active research in developing new and newer vanadium based complexes capable of mimicking VHPO activity. Moreover, development of metal based synthetic nucleases laid special attention in the chemotherapeutic research11 since, they can be potentially used for cancer therapy or as restriction nucleases. Again, many oxovanadium complexes have been known to be the initiators in the photo-cleavage of DNA.12 The transition metal complexes of 1,10-phenanthroline or their modified variants have been widely employed13 in DNA studies due to their applicability in bioinorganic and biomedicinal chemistry14 as well as in the design of stereospecific DNA binding drugs.15 Although, the synthesis of some oxovanadium complexes with various amino acid Schiff bases has been reported earlier,16 the detail investigation on the multifunctional activities i.e., the VHPO mimicking as well as nuclease activity by such complexes are scanty.17 In the present work, synthesis, characterization, DFT calculations, catalytic activity and nuclease activity of an oxovanadium(IV) complex with the Schiff base derived from an amino acid (L-cysteine), and the 1,10 phenanthroline of the formula [VIVO(sal-L-cys)(phen)] have been carried out with the aim of developing an amino acid based multifunctional biomimicking oxovanadium complex.
Experimental section
Materials and methods
All reagents and chemicals were procured commercially and of AR or GR grade (SD Fine Chemicals, India; and Aldrich) and used without further purification. Solvents were purified by standard procedures,18 wherever necessary. All solvents used for chromatographic analysis were either of HPLC, spectroscopic or GR grade and in all cases their purity was confirmed by GC analysis before use. Calf thymus DNA (CT-DNA) was purchased from the Sigma Chemical Company, USA; supercoiled (SC) plasmid pUC19 DNA was obtained from Bangalore Genei (Bangalore, India). The solutions of CT-DNA in phosphate buffer saline (PBS) medium [0.15 M, pH 7.2] gave a ratio of A260/A280, of ca. 1.8–1.85, indicating that the DNA was sufficiently free from protein contamination. The DNA concentration per nucleotide was determined by absorption spectrophotometry using the molar absorption coefficient (ε = 6600 M−1 cm−1). Stock solutions were stored at 4 °C and used within 4 days.
Synthesis of the ligand (H2sal-cys)
About 1.21 g (0.01 mol) of L-cysteine and 1.22 g (0.01 mol) of salicylaldehyde were refluxed for 4 h in ethanol (50 mL). After cooling a pale yellow precipitate was formed, which was collected by filtration, washed with cold water and dried to give 2.24 g (92.18%) of the Schiff base. 1H NMR (d, ppm; 300 MHz, DMSO-d6): 3.13 (1H, s, –C![[H with combining low line]](https://www.rsc.org/images/entities/char_0048_0332.gif) AHBSH), 3.17 (1H, s, –CHABSH), 3.40 (1H, s, –C(N)(CH2SH)), 5.57–5.64 (1H, m, Ar–C
AHBSH), 3.17 (1H, s, –CHABSH), 3.40 (1H, s, –C(N)(CH2SH)), 5.57–5.64 (1H, m, Ar–C![[double bond, length as m-dash]](https://www.rsc.org/images/entities/char_e001.gif) N– (geometrical isomers)), 6.93 (4H, s, CH2S), 7.08–7.54 (4H, m), Ar–, 8.42–8.64 (1H, b, –COO), 8.64 (1H, b, –COO), 10.31 (1H, s, Ar–O). ESI-MS(+ve) in MeOH: m/z (relative intensity) 226.05 [m+ + 1], 248.03 [m+ + 23]. UV-vis in methanol [λmax nm (ε M−1 cm−1)]: 323(8700), 279(12
N– (geometrical isomers)), 6.93 (4H, s, CH2S), 7.08–7.54 (4H, m), Ar–, 8.42–8.64 (1H, b, –COO), 8.64 (1H, b, –COO), 10.31 (1H, s, Ar–O). ESI-MS(+ve) in MeOH: m/z (relative intensity) 226.05 [m+ + 1], 248.03 [m+ + 23]. UV-vis in methanol [λmax nm (ε M−1 cm−1)]: 323(8700), 279(12![[thin space (1/6-em)]](https://www.rsc.org/images/entities/char_2009.gif) 400), 255(27100), 218(36200). Elemental analysis: calc. C 53.32%, H 4.92%, N 6.22%; found: C 53.40%, H 5.01%, N 6.29%.
400), 255(27100), 218(36200). Elemental analysis: calc. C 53.32%, H 4.92%, N 6.22%; found: C 53.40%, H 5.01%, N 6.29%.
Synthesis of the complex [VIVO(sal-L-cys)(phen)]
A methanolic solution (10 mL) of the Schiff base (H2sal-cys) (0.01 mol, 2.25 g) was added to a 10 mL methanolic solution of vanadyl sulfate pentahydrate (0.01 mol, 2.53 g) with continuous stirring, followed by dropwise addition of a methanolic solution (5 mL) of 1,10-phenanthroline monohydrate (0.01 mol, 1.98 g) and stirred for another 2 h, which on standing produced brown yellow solid (Scheme 1). The brown yellow solid was collected by filtration, washed with cold water and dried under vaccum. Yield: 77%. IR (KBr, cm−1): 3419.96 [ν(O–H)], 2612.79 [ν(S–H)], 1601.93 [νas(COO)], 1645.27 [ν(CN)], 968.37 [ν(VO)]. ESI-MS(+ve) in MeOH: m/z (relative intensity) 471.11 [m+ + 1], 493.08 [m+ + 23]. UV-vis in methanol [λmax nm (ε M−1 cm−1)]: 382(4760), 264(33000), 218 (49200). Elemental analysis: calc. C 56.17%, H 3.64%, N 8.93%; found: C 56.31%, H 3.61%, N 8.89%.
 |
| | Scheme 1 Synthesis of [VO(sal-L-cys)(phen)]. | |
Physical measurements
The IR spectra were taken as KBr discs at room temperature on a Perkin Elmer RFX-I IR spectrophotometer. Elemental analyses were carried out using a Perkin-Elmer 2400 series II CHNS analyzer. UV-vis spectra (200–800 nm) were recorded against appropriate reagent blank at room temperature with a Shimadzu U-1200 spectrophotometer using 1 cm quartz cell. EPR spectra were obtained on a JEOL-JES FA200 ESR spectrometer in DCM–toluene (1:1) glass at 77 K. NMR spectral measurements were carried out in DMSO-d6 solution at ambient temperature. The 1H NMR spectra were taken by Bruker 300 MHz NMR spectrometer and the mass spectral analyses were done in methanol solvent from Waters mass spectrometer (model: XEVO-G2QTOF#YCA351). The gel electrophoresis study was carried out with UVP Bio Doc-It Imaging System and nicking was analysed by UVP DOC-ItLS software.
DFT calculations
DFT study is an important tool which provides understanding on the geometry, electronic structure, and optical properties of the system in question. Ground state electronic structure calculations in methanol solution of both the ligand and the complex have been carried out using DFT19 method associated with the conductor-like polarizable continuum model (CPCM).20 Becke's hybrid function21 with the Lee–Yang–Parr (LYP) correlation function22 was used in the study. The geometry of the ligand and complex was fully optimized without any symmetry constraints. On the basis of the optimized ground state geometry, the absorption spectral properties in methanol (CH3OH) media were calculated by time-dependent density functional theory (TDDFT)23 approach associated with the conductor-like polarizable continuum model (CPCM).20 We computed the lowest 40 singlet–singlet transitions and results of the TD calculations were qualitatively very similar. The TDDFT approach has been demonstrated to be reliable for calculating spectral properties of many transition metal complexes.24 Due to the presence of electronic correlation in the TDDFT (B3LYP) method it can yield more accurate electronic excitation energies. Hence, TDDFT had been shown to provide a reasonable spectral feature for our complex of investigation.
For H atoms we used 6-31G basis set; for C, N, O and V atoms basis set was employed 6-31G and for S atom we adopted 6-31+G(d,p) as basis set for the optimization of the ground state. The calculated electronic density plots for frontier molecular orbitals were prepared by using Gauss View 5.1 software. All the calculations were performed with the Gaussian 09W software package.23 Gauss Sum 2.1 program25 was used to calculate the molecular orbital contributions from groups or atoms.
Bromination of alkenols using the complex as catalyst
Halogenation was carried out by the catalytic bromination of phenol red to bromophenol blue using the oxovanadium complex as a catalyst. The catalytic activity of the complex was studied by absorption spectroscopy. Bromination reaction activity tests were carried out at a constant temperature of (30 ± 0.5) °C in presence of H2O2 and KBr in mild acidic medium. An aliquot of 30% H2O2 (final concentration 2.0 mM) was added to a H2O–DMF solution (with a volume ratio of 4:1) of catalyst followed by the addition of 4.0 mol L−1 of KBr. Solutions used for kinetic measurements were maintained at pH = 5.8 by the addition of NaH2PO4–Na2HPO4.26 Reactions were initiated by the addition of 0.1 mmol of phenol red. Bromination of phenol red was monitored by the measurement of the increase in the absorbance at 592 nm for reaction at specific time points. The spectral data show the gradual disappearance of the peak at 443 nm due to the loss of phenol red and an increase in the absorbance of the peak at 592 nm due to the formation of the bromophenol blue product and spectral changes were recorded at the intervals of 5 min.
The rate of this reaction is described by the rate equation: dc/dt = kc1xc2yc3z, from which the equation “log(dc/dt) = logk + xlogc1 + ylogc2 + zlogc3” was obtained, corresponding to “−log(dc/dt) = −xlogc1 − b (b = logk + ylogc2 + zlogc3)”, where k is the reaction rate constant; c1, c2, c3 are the concentrations of the oxovanadium complex, KBr and phenol red, respectively; while x, y, z are the corresponding reaction orders. According to Lambert–Beer's law, A = εdc, which on differentiation we get dA/dt = εd(dc/dt), where ‘A’ is the resultant absorbance; ‘ε’ is the molar absorption coefficient (for bromophenol blue ε = 14500 M−1 cm−1 at 592 nm); ‘d’ is the light path length of the sample cell (d = 1). The absorbance data were plotted against the reaction time, a straight line was obtained and the reaction rate (dA/dt) was obtained from the slope of this line. The reaction rate constant (k) can be obtained from the plot of −log(dc/dt) versus −logc1. In the experiment, the reaction orders of KBr and phenol red (y and z) were taken as 1 according to the literature,27 c2 and c3 are known as 0.4 and 10−4 mol L−1, respectively.
DNA binding studies and nuclease activity
UV-vis spectral study. UV-vis spectra were recorded in a Shimadzu U-1200 spectrophotometer using Quartz cuvettes of 1 cm path length. The electronic absorption spectra were monitored in PBS (0.15 M, pH 7.2) buffer at room temperature 25 °C by keeping the concentration of the CT-DNA constant (10 μM), while varying amounts of complex [in 1% methanol–PBS buffer (v/v) solution] over a range of 1–12 μM. While measuring the absorption spectra, equal amounts of complex was added to both the test and the reference solutions to eliminate any absorbance of the complex itself.
Fluorescence study. Competitive ethidium bromide (EB) binding experiment was carried out to investigate the binding mode of the complex to CT-DNA. The fluorescence was measured by a Perkin Elmer LS55 spectrofluorimeter. The experiment was monitored by the addition of 10.0 μM of CT-DNA in Tris–HCl/NaCl buffer to a 15 μM solution of ethidium bromide in the same buffer medium. Aliquot of stock solution of the complex [1% MeOH–buffer (v/v) solution] was added to the ethidium bromide bound CT-DNA solution in a way so that, the ratio of [complex]/[EB–DNA] were 0, 0.2, 0.4, 0.6, 0.8, 1.0, 1.2 and the respective solutions were incubated for 2 h at 37 °C, thereafter, the fluorescence intensities of the solutions were recorded by exciting the solutions at 500 nm whereas slits for both the excitation and emission were 10 nm.
Viscometric study. The viscosity of sonicated DNA (average molecular weight of ∼200 base pairs obtained using a Labsonic 2000 sonicator)28 was measured by a fabricated micro-viscometer maintained at 28 (±0.5) °C in a thermostatic water bath. Data were presented as (η/ηo)⅓ vs. the ratio of the concentration of metal complex to that of the CT-DNA, where η and ηo are the viscosities of the CT-DNA solutions in the presence and absence of the complex, respectively. The viscosity of DNA (η = t − to) was calculated from the observed flow time of CT-DNA solutions (t) and buffer solution (to).
Gel electrophoresis study. DNA cleavage activity of the complex was monitored with the help of a gel electrophoresis Model No. 2101, Genei, Bangalore. The super coiled pUC19 DNA (0.5 μg per reaction) in Tris–HCl/NaCl buffer (pH 7.2) was treated with increasing amounts of metal complex over a range of 20–60 μM alongwith H2O2 (4 μM).29 After incubation for 2 h at 37 °C, it was mixed with a sample loading dye. The samples were run on a 0.9% agarose in 1× TAE buffer for 3 h at 80 mV, then it was treated with EB solution and the bands were visualized by UV light and photographed with UVP Bio Doc-It Imaging System. The percentage of cleavage of super coiled (SC) pUC19 DNA cleavage induced by the complex was determined by using UVP BIODOC-ItLS software.
Results and discussion
IR and UV-vis spectrophotometric characterization of the complex
The characteristic ν(VO) vibration9,11 of oxovanadium(IV) complex appears at 968.37 cm−1 as a sharp band. The complex presents very strong bands at 1645.27 cm−1 and 1601.93 cm−1; these correspond to ν(CN) and νas(COO) respectively of the Schiff base ligand. The strong vibrations at 1438.25 cm−1 and at 736.03 cm−1 are due to the ν(C–N) vibration of the phen ligand in the complex, which appeared at 1421 cm−1 and 731 cm−1 respectively in the uncoordinated phenanthroline. The electronic absorption bands of the oxovanadium(IV) complex in methanol solution at the 382 nm, 218 nm and 264 nm are assigned as intra ligand charge transfer transitions.30
Mass spectrometric analysis
The molecular formulation and some structural information can be obtained from ES-MS analysis and elemental analysis. The molecular formula of the complex [VO(sal-cys)(phen)] obtained from elemental analysis is supported by the observation of peak at m/z (relative intensity): 471.11 [m+ + 1], 493.08 [m+ + 23].
Geometry optimization and electronic structure determination by DFT calculation
The optimized geometry of the ligand (H2sal-cys) and its oxo vanadium complex is shown in Fig. 1a and b respectively. For both the ligand and the complex, only the ground state geometries have been optimized. Main optimized geometrical parameters of the oxovanadium complex are listed in Table 1. The hexa-coordinated metal centre possesses a distorted octahedral geometry in the complex. All calculated V–N distances occur in the range 2.073–2.419 Å and V–O distances are in the range 1.614–1.979 Å whereas, on complexation, some C–N and C–O bond lengths are changed with respect to that in free ligand and Table 2 describes the change in bond lengths in the complex compared to the free ligand (H2sal-cys).
 |
| | Fig. 1 Optimized geometry of the free ligand (H2sal-cys) and the complex [VO(sal-cys)(phen)] under DFT[B3LYP (6-31G)]. | |
Table 1 Selected optimized geometrical parameters for the oxovanadium complex in the ground state calculated at B3LYP levels
| Bond lengths (Å) |
| V–N1 |
2.073 |
V–O1 |
1.958 |
| V–N2 |
2.173 |
V–O2 |
1.979 |
| V–N3 |
2.419 |
V–O3 |
1.614 |
| Bond angles (°) |
| N1–V–N3 |
93.626 |
N2–V–O2 |
91.910 |
| N2–V–N3 |
71.902 |
N2–V–O3 |
91.200 |
| N2–V–Ol |
95.616 |
N1–V–O1 |
87.290 |
| O1–V–N3 |
79.136 |
N1–V–O2 |
78.772 |
| O3–V–N3 |
163.102 |
N1–V–N2 |
161.950 |
| O1–V–O2 |
152.050 |
O2–V–O3 |
103.007 |
Table 2 Change in bond lengths for the oxovanadium compared to free the ligand (H2sal-cys) in the ground state calculated at B3LYP levels
| Bond lengths (Å) |
| |
Ligand (H2sal-cys) |
Oxovanadium complex |
| O1–C1 |
1.362 |
1.290 |
| N1–C3 |
1.303 |
1.302 |
| N1–C4 |
1.486 |
1.472 |
| O2–C5 |
1.369 |
1.291 |
In case of the free ligand (H2sal-cys) at the ground state, the electron density at HOMO and LUMO+2 orbitals mainly reside on the salicylaldehyde moiety while a considerable contribution comes from cysteine moiety along with the contribution of salicylaldehyde moiety in HOMO−2, HOMO−1, LUMO and LUMO+1 orbitals. The energy difference (Fig. 2) between HOMO and LUMO is 4.328 eV of the ligand (H2sal-cys). In case of the oxovanadium complex all the HOMO−3, HOMO−2 and HOMO orbitals are mainly originating from salicylaldehyde–cysteine π and π* orbital contribution while the LUMO, LUMO+1 and LUMO+3 orbitals arise from metal d orbital contribution along with the π orbital contribution of 1,10-phenanthroline. The energy difference between HOMO and LUMO is 3.068 eV of the complex (Fig. 2). These compositions are useful in understanding the nature of transition as well as the absorption spectra of both the ligand and the complex (vide infra).
 |
| | Fig. 2 Frontier molecular orbital of complex as well as ligand optimized under [B3LYP(6-31G)]. | |
The ligand shows four absorption bands at 323, 279, 255 and 218 nm in methanolic solution at room temperature. These four absorption bands can be assigned to the S0 → S1, S0 → S4, S0 → S7 and S0 → S10 transitions (Fig. 3) from TDDFT calculations. The absorption energies along with their oscillator strengths, the main configurations and their assignments calculated using TDDFT method for the ground state geometry for H2L is discussed here and the related data are given in Table 3.
 |
| | Fig. 3 Frontier molecular orbitals involved in the UV-vis absorption of the free ligand (H2sal-cys). | |
Table 3 Selected parameters for the vertical excitation (UV-vis absorptions) of the free ligand (H2sal-cys); electronic excitation energies (eV) and oscillator strengths (f), configurations of the low-lying excited states of the ligand; calculations of the S0 → Sn energy gaps are based on optimized ground-state geometries (UV-vis absorption) (CH3OH used as solvent)
| Electronic transition |
Composition |
Excitation energy |
Oscillator strength (f) |
CI |
λexp (nm) |
| S0 → S1 |
HOMO−2 → LUMO |
3.7738 eV (328 nm) |
0.0617 |
0.21195 |
323 |
| HOMO−1 → LUMO |
0.50636 |
| HOMO → LUMO |
−0.42029 |
| S0 → S4 |
HOMO−3 → LUMO |
4.3852 eV (282 nm) |
0.0510 |
0.26802 |
279 |
| HOMO−3 → LUMO+1 |
0.10157 |
| HOMO−2 → LUMO+1 |
0.21231 |
| HOMO−1 → LUMO |
0.25215 |
| S0 → S7 |
HOMO−3 → LUMO+1 |
4.9183 eV (252 nm) |
0.1337 |
0.27380 |
255 |
| HOMO−1 → LUMO+1 |
0.26486 |
| HOMO−2 → LUMO |
−0.18159 |
| S0 → S10 |
HOMO−1 → LUMO+2 |
5.7118 eV (217 nm) |
0.0851 |
0.49863 |
218 |
| HOMO → LUMO+2 |
−0.41682 |
The complex shows three absorption bands at 382, 264 and 227 nm in methanolic solution at room temperature. The calculated absorption bands are located at 385 and 259 nm in the complex (Fig. 4), which are in good agreement with the experimental results of 382 and 264 nm (Table 4). These two absorption bands can be assigned to the S0 → S18 and S0 → S24 transitions, respectively (Table 4).
 |
| | Fig. 4 Frontier molecular orbitals involved in the UV-vis absorption of the oxovanadium complex. | |
Table 4 Simulated values of various factors of the optical transitions for the oxovanadium complex
| Electronic transition |
Composition |
Excitation energy |
Oscillator strength (f) |
CI |
λexp (nm) |
| S0 → S18 |
HOMO−2 → LUMO |
3.2192 eV (385 nm) |
0.0891 |
0.23713 |
382 |
| HOMO−2 → LUMO+3 |
0.15239 |
| HOMO → LUMO+3 |
−0.17791 |
| S0 → S24 |
HOMO−3 → LUMO+1 |
4.2856 eV (259 nm) |
0.1257 |
0.26945 |
264 |
| HOMO−2 → LUMO |
0.39122 |
EPR study
EPR spectroscopy is a powerful tool that provides information about the nuclearity (Fig. 5), and electronic structure of a paramagnetic state. X-band EPR spectra of the complex [VIVO(sal-L-cys)(phen)] was recorded in frozen (77 K) dichloromethane–toluene (1:1) glass. It gives rise to well resolved 51V (I = 7/2) hyperfine eight lines and the spectral parameters are listed in Table 5. The spectrum has axial symmetry with g‖ < g⊥. The characteristic g‖ < g⊥ and a‖ ≫a⊥ relationship corresponding to an axially compressed d1xy configuration31,32 was observed. The EPR study confirms the presence of mononuclear vanadium(IV) moiety in the complex.
 |
| | Fig. 5 EPR spectrum of complex in solution (DCM/toluene) at 77 K. | |
Table 5 EPR spectral data at 77 K in solution DCM–toluene (1:1)
| Compound |
g‖ (A‖/G) |
g⊥ (A⊥/G) |
gav (Aav/G) |
| [VIVO(sal-cys)(phen)] |
1.948 (71.88) |
1.987 (57.25) |
1.974 (61.24) |
Therefore, all the above spectroscopic findings along with DFT calculations suggest that the molecular geometry of the complex is [VIVO(sal-L-cys)(phen)] with O, N, O linkage from the Schiff base, N,N coordination from o-phenanthroline and the oxo linkage.
Biomimicking catalysis by the compound
Many oxovanadium complexes are found to mimic the vanadium haloperoxidases catalyzes the bromination of organic substrates in the presence of H2O2 and bromide. The catalytic haloperoxidase activity of vanadium complexes is often investigated by the kinetic study of the catalytic bromination of phenol red to bromophenol blue as a model system. The catalytic ability of the oxovanadium complex [VIVO(sal-L-cys)(phen)] for the oxidative bromination of phenol red was monitored by UV-vis spectrophotometry (Fig. 6). The gradual decrease in the absorption at 443 nm due to disappearance of phenol red and the appearance of a new peak at 590 nm due to formation of bromophenol indicate the conversion of phenol red to bromophenol blue, and the reaction was complete after ∼8 h under ambient conditions. The plots for the kinetic studies of the above conversion are shown in Fig. 7 and 8. The same reaction was monitored without addition of the oxovanadium complex whereby no appreciable change could be observed.
 |
| | Fig. 6 Oxidative bromination of phenol red catalyzed by the oxovanadium complex (0.04 mmol). Spectral changes at 10 min intervals. Spectral data taken of aliquots in pH = 5.8 aqueous phosphate buffer, c(phosphate buffer) = 50 mmol L−1, c(KBr) = 0.4 mol L−1, c(phenol red) = 10−4 mol L−1. | |
 |
| | Fig. 7 The measurable absorbance dependence on time for the oxovanadium complex. Conditions used: pH = 5.8, c(KBr) = 0.4 mol L−1, c(H2O2) = 2 mmol L−1, c(phenol red) = 10−4 mol L−1. c(complex/mmol L−1) = a: 2 × 10⁻²; b: 4 × 10⁻²; c: 6 × 10⁻²; d: 8 × 10⁻²; e: 1 × 10⁻¹. | |
 |
| | Fig. 8 −log(dc/dt) dependence of −logc (c is the concentration of the oxovanadium complex); conditions used: c(phosphate buffer) = 50 mmol L−1, pH = 5.8, c(KBr) = 0.4 mol L−1, c(phenol red) = 10−4 mol L−1. | |
Mechanism of the catalytic activity
The mechanism of catalytic activity is assumed to be similar as described in our previous work.11 During the catalytic process, the catalyst (I) was converted to a bound peroxide intermediate (III) in presence of peroxide in mild acidic medium. This intermediate in turn oxidizes the bromide (Br−) ion in the medium to bromonium ion (Br+) which exists in reaction medium as Br3−, Br2 or HOBr.8 Attack of a bromide ion at one of the peroxo atoms (IV) and the uptake of a proton from a surrounding water molecule leads to the generation of hypobromous acid (HOBr) (V) followed by restoration of the native state (I). The in situ generated bromonium ion reacts with the organic substrate (phenol red) to form corresponding brominated derivatives. The catalytic cycle has been depicted in Scheme 2.
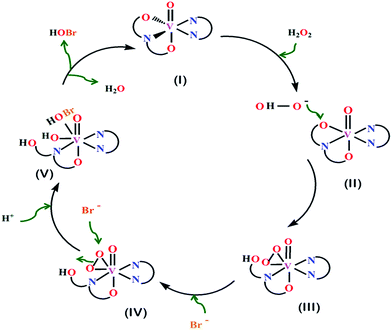 |
| | Scheme 2 Schematic representation of the proposed mechanism of the catalytic bromination of the complex [VIVO(sal-cys)(phen)] as a catalyst in presence of KBr and H2O2 in acidic medium. | |
Nuclease activity of the oxovanadium complex
Spectrophotometric studies on DNA binding by the complex. Electronic absorption spectroscopy is usually used to determine the binding of metal complexes with DNA. A complex bound to DNA through intercalation is characterized by the change in absorbance (hypochromism) and red shift in wavelength, due to the stacking interaction between the aromatic chromophore and the DNA base pair.33–35 To calculate the complex-DNA binding constant (Kb), the data are treated according to the following equations:33
| 1/(A − A0) = 1/(A∞ − A0) + 1/K(A∞ − A0) × 1/Cligand |
where, Ao is the absorbance of DNA at 260 nm in the absence of complex, A∞ is the final absorbance of the ligated DNA, and A is the recorded absorbance at different ligand concentrations. The absorption spectrum of CT-DNA at 260 nm is monitored by varying the concentration of the oxovanadium complex. Upon the addition of incremental amounts of complex hypochromism was observed (Fig. 9) without any significant red or blue shift. The double reciprocal plot of 1/(A − Ao) versus 1/Cligand is linear, and the binding constant (K) can be estimated from the ratio of the intercept to the slope (Fig. 10). The complex shows binding constant as (3.51 ± 0.02) × 104.
 |
| | Fig. 9 Absorption spectra of DNA upon increasing amounts of complex, [complex]/[DNA] = 0.2; 0.4; 0.6; 0.8; 1.0; 1.2. | |
 |
| | Fig. 10 Plot of 1/(A − Ao) versus [complex] × 105 (M−1). | |
Fluorescence emission titrations for DNA interaction. Fluorimetric measurements using ethidium bromide (EB) as a probe are usually carried out to establish the binding mode of small molecule to the double-helical DNA. Ethidium bromide (EB) emits intense fluorescence in the presence of DNA due to its strong intercalation between the adjacent DNA base pairs. This enhanced fluorescence can be quenched by the addition of a third molecule which can bind DNA by intercalative mode by displacing EB.29,36,37 The emission spectra of EB bound to DNA in the absence and presence of the complex are presented in Fig. 11. The addition of the complex to DNA pretreated with EB causes a gradual quenching in emission intensity, indicating that the complex competes with EB in binding DNA, which leads to a quenching in the fluorescence intensity of EB–DNA complex system. In fact, as expected for a displacement effect, the increase in the concentration of complex gradually quenches the fluorescence intensity of EB–DNA complex system. This significant decrease in fluorescence intensity lends strong support in favor of intercalation of the complex into the DNA double helix by displacing EB. Fluorescence quenching study in presence of the complex was analyzed further by Stern–Volmer equation: I0/I = 1 + KSV[Q];29 where I0 and I are the fluorescence intensities in absence and presence of quencher (complex) respectively; [Q] is the concentration of the quencher, KSV is the Stern–Volmer quenching constant, which is obtained from the slope of plot of I0/I vs. [Q]. A plot of I0/I vs. [complex]/[DNA] appears linear (Fig. 12) and the Stern–Volmer quenching constant (KSV) was found to be (5.24 ± 0.02) × 104 M−1 at 37 °C. This data is also in agreement with the value obtained by electronic spectral studies.29,36,37
 |
| | Fig. 11 Fluorescence emission spectra of the EB–DNA complex in the presence of [EB] = 15 μM + [DNA] = 10.0 μM; the ratio of [VO(sal-cys)(phen)]/EB–DNA = 0, 0.2, 0.4, 0.6, 0.8, 1.0, 1.2. Excitation wave length = 500 nm. | |
 |
| | Fig. 12 Plot of I/I0 vs. [VO(sal-cys)(phen)]/DNA. | |
Viscometric studies to confirm the DNA binding pattern. Viscometric studies play a very important role in ascertaining DNA binding pattern in solution. More precisely, it can lend strong support in favour of intercalative binding. The intercalative binding by the ligand lengthens the DNA helix, which in turn, causes an increase in the viscosity of DNA.38 The values of relative specific viscosities of DNA in the absence and presence of the complex are plotted against [complex]/[DNA] and are presented in Fig. 13. It is observed that the addition of the complex to the CT-DNA solution leads to an increase in the viscosity of the CT-DNA, thereby clearly demonstrating the intercalative binding of the complex to CT-DNA.38,39
 |
| | Fig. 13 Effect of increasing amount of [VO(sal-cys)(phen)] complex on the specific viscosity of CT DNA. Samples were prepared so as to give total complex/base pair ratios of 0, 0.2, 0.4, 0.6, and 0.8. | |
Gel electrophoresis study for nuclease activity. The double-stranded plasmid pUC19 DNA exists in a compact supercoiled (SC) form. Upon introduction of strand breaks, the supercoiled form of DNA is disrupted into the nicked circular (NC) form or the linear form. If one strand is cleaved, the super coiled form will relax to produce a nicked circular form. If both the strands are cleaved, a linear form will be produced. Relatively fast migration is observed for super coiled form when the plasmid DNA is subjected to electrophoresis, while the nicked circular form migrates slowly and the linear form migrates in between SC and NC.9,29,37 Hence, DNA strand breaks could be quantified by measuring the transformation of the super coiled form into nicked circular and linear forms. The ability of the vanadium complex to induce DNA cleavage was studied by gel electrophoresis using super coiled pUC19 DNA in Tris–HCl/NaCl buffer (pH 7.2). The results of the gel electrophoresis (Fig. 14) experiment and quantitative cleavage data are presented in Table 6. In the gel electrophoresis six bands are observed. Lane 1 contains only DNA and has 87% supercoiled form i.e., form I and 13% relaxed form i.e., form II. On the addition of H2O2 (4 μM), percentage of relaxed form increases to 28% (lane 2) while on addition of the compound (20 μM to 60 μM), the percentage of relaxed form increases through 31 to 39 to 51 in lane 3, 5, 7 respectively. Whereas, on addition of different concentrations of compound and H2O2 together (4 μM H2O2 + 20 μM), (4 μM H2O2 + 40 μM) and (4 μM H2O2 + 60 μM) the percentage of relaxed form of DNA increases to 36% (lane 4), 45% (lane 6) and 69% (lane 8) respectively. This clearly indicates that the compound alone shows moderate nuclease activity but exhibits greater nuclease activity at higher concentration when used in combination with H2O2.9,29,37
 |
| | Fig. 14 (a) Agarose gel (0.9%) electropherogram of supercoiled DNA (0.5 μg) incubated for 45 min at 37 °C, in PBS buffer (0.15 M, pH 7.2) at 37 °C. Lane 1: DNA control; lane 2: DNA + H2O2; lane 3: DNA + complex (20 μM); lane 4: DNA + complex (20 μM) + H2O2; lane 5: DNA + complex (40 μM); lane 6: DNA + complex (40 μM) + H2O2; lane 7: DNA + complex (60 μM); lane 8: DNA + complex (60 μM) + H2O2. | |
Table 6 Results of the cleavage of pUC19 DNA determined by gel electrophoresis study
| Sl no |
Reaction condition |
Form I (% SC) |
Form II (% NC) |
| Lane 1 |
Control DNA |
87 |
13 |
| Lane 2 |
DNA + H2O2 (4 μM) |
72 |
28 |
| Lane 3 |
DNA + complex (20 μM) |
69 |
31 |
| Lane 4 |
DNA + complex (20 μM) + H2O2 |
64 |
36 |
| Lane 5 |
DNA + complex (40 μM) |
61 |
39 |
| Lane 6 |
DNA + complex (40 μM) + H2O2 |
55 |
45 |
| Lane 7 |
DNA + complex (60 μM) |
49 |
51 |
| Lane 8 |
DNA + complex (60 μM) + H2O2 |
31 |
69 |
Conclusion
A new oxovanadium complex [VIVO(sal-cys)(phen)] has been designed and synthesized with the aim of developing multifunctional molecule, active both in the fields of biocatalysis as well as in DNA nicking. The compound mimics the in vitro bromination of organic substrate giving corresponding brominated product. The results of physicochemical studies of DNA binding as well as DNA cleavage activity indicate that the oxovanadium(IV) compound may be useful in DNA manipulation studies. Hence, the newly synthesized complex [VIVO(sal-cys)(phen)], exhibits versatile multifunctional enzyme mimetic catalytic activities both as a bromoperoxidase as well as a DNA nuclease.
Acknowledgements
The authors are thankful to UGC, New Delhi for financial support in the form of a Major Research Project [Sanction no. 39-706/2010(SR)] to K. K. M., where U.S. had been a project fellow.
References
-
(a) D. Rehder, Future Med. Chem., 2012, 4, 1823–1837 CrossRef CAS PubMed;
(b) H. Vilter, Metal Ions in Biological Systems: Vanadium and its Role in Life, ed. H. Sigel and A. Sigel, Marcel Dekker, New York, 1995, vol. 31, ch. 10, p. 325 Search PubMed;
(c) A. Butler, Curr. Opin. Chem. Biol., 1998, 2, 279–285 CrossRef CAS PubMed;
(d) K. E. Liu, A. M. Valentine, D. Qiu, D. E. Edmondson, E. H. Appelman, T. G. Spiro and S. J. Lippard, J. Am. Chem. Soc., 1995, 117, 4997–4998 CrossRef CAS.
-
(a) R. K. Narla, Y. Dong, O. J. D'Cruz, C. Navara and F. M. Uckun, Clin. Cancer Res., 2000, 6, 1546–1556 CAS;
(b) P. P. Hazari, A. K. Pandey, S. Chaturvedi, A. K. Tiwari, S. Chandna, B. S. Dwarakanath and A. K. Mishra, Chem. Biol. Drug Des., 2012, 79, 223–234 CrossRef CAS PubMed.
-
(a) T. L. Fernández, E. T. Souza, L. C. Visentin, J. V. Santos, A. S. Mangrich, R. B. Faria, O. A. C. Antunes and M. Scarpellini, J. Inorg. Biochem., 2009, 103, 474–479 CrossRef PubMed;
(b) D. Rehder, G. Santoni, G. M. Licini, C. Schulzke and B. Meier, Coord. Chem. Rev., 2003, 237, 53–57 CrossRef CAS;
(c) R. L. Robson, R. R. Eady, T. H. Richardson, R. W. Miller, M. Hawkins and J. R. Postgate, Nature, 1986, 322, 388–390 CrossRef CAS.
- T. Ueki, T. Adachi, S. Kawano, M. Aoshima, N. Yamaguchi, K. Kanamori and H. Michibata, Biochim. Biophys. Acta, 2003, 1626, 43–50 CrossRef CAS.
-
(a) Y. Shechter and S. J. D. Karlish, Nature, 1980, 284, 556–558 CrossRef CAS PubMed;
(b) A. Levina and P. A. Lay, Dalton Trans., 2011, 40, 11675–11686 RSC;
(c) Y. Shechter, Diabetes, 1990, 39, 1–5 CrossRef CAS PubMed.
-
(a) H. John, V. McNeill, G. Yuen, H. R. Hoveyda and C. Orvig, J. Med. Chem., 1992, 35, 1489–1491 CrossRef;
(b) D. Gambino, Coord. Chem. Rev., 2011, 255, 2193–2220 CrossRef CAS.
- H. Vilter, Phytochemicals, 1984, 23, 1387–1390 CrossRef CAS.
-
(a) A. G. J. Ligtenbarg, R. Hage and B. L. Feringa, Coord. Chem. Rev., 2003, 237, 89–101 CrossRef CAS;
(b) D. Rehder, G. Santoni, G. M. Licini, C. Schulzke and B. Meier, Coord. Chem. Rev., 2003, 237, 53–63 CrossRef CAS;
(c) V. Kraehmer and D. Rehder, Dalton Trans., 2012, 41, 5225–5234 RSC;
(d) A. Butler, Bioinorg. Catal., 1992, 425–445 Search PubMed.
-
(a) T. K. Si, S. S. Paul, M. G. B. Drew and K. K. Mukherjea, Dalton Trans., 2012, 41, 5805–5815 RSC;
(b) S. Patra, S. Chatterjee, T. K. Si and K. K. Mukherjea, Dalton Trans., 2013, 42, 13425–13435 RSC.
-
(a) S. Rayati, N. Sadeghzadeh and H. R. Khavasi, Inorg. Chem. Commun., 2007, 10, 1545–1548 CrossRef CAS;
(b) H. S. Soedjak, J. V. Walker and A. Butler, Biochemistry, 1995, 34, 12689–12696 CrossRef CAS PubMed;
(c) B. B. Gangadhar, S. B. Prema and S. A. Patil, J. Enzyme Inhib. Med. Chem., 2009, 24, 381–394 CrossRef PubMed.
- U. Saha, T. K. Si, P. K. Nandi and K. K. Mukherjea, Inorg. Chem. Commun., 2013, 38, 43–46 CrossRef CAS.
-
(a) M. Sam, J. H. Hwang, G. Chanfreau and M. M. Abu-Omar, Inorg. Chem., 2004, 43, 8447–8455 CrossRef CAS PubMed;
(b) P. K. Sasmal, S. Saha, R. Majumdar, S. De, R. R. Dighe and A. R. Chakravarty, Dalton Trans., 2010, 39, 2147–2158 RSC.
- D. R. Tatiana, S. Giampiero, P. Maurizio, T. Saison-Behmoaras, B. Alexandre and B. Cacciari, Curr. Med. Chem., 2005, 12, 71–88 CrossRef.
-
(a) G. Verquin, G. Fontaine, M. Bria, E. Zhilinskaya, E. Abi-Aad, A. Aboukaïs, B. Baldeyrou, C. Bailly and J. L. Bernier, J. Biol. Inorg. Chem., 2004, 9, 345–353 CrossRef CAS PubMed;
(b) L. G. Naso, E. G. Ferrer, N. Butenko, I. Cavaco, L. Lezama, T. Rojo, S. B. Etcheverry and P. A. M. Williams, J. Biol. Inorg. Chem., 2011, 16, 653–668 CrossRef CAS PubMed.
- P. Nagababu, J. Naveena, L. Latha and S. Satyanarayana, Chem. Biodiversity, 2006, 3, 1219–1228 CAS.
-
(a) P. Rây and A. K. Mukherjee, J. Indian Chem. Soc., 1950, 27, 707 Search PubMed;
(b) A. K. Mukherjee and P. Rây, J. Indian Chem. Soc., 1955, 32, 505–510 CAS;
(c) G. J. Colpas, B. J. Hamstra, J. W. Kampf and V. L. Pecoraro, J. Am. Chem. Soc., 1994, 116, 3627–3628 CrossRef CAS;
(d) L. J. Theriot, G. O. Carlisle and H. J. Hu, J. Inorg. Nucl. Chem., 1969, 31, 3303–3308 CrossRef CAS.
-
(a) K. Nakajima, M. Kojima, K. Toriumi, K. Saito and K. Fujita, Bull. Chem. Soc. Jpn., 1989, 62, 760–767 CrossRef CAS;
(b) J. C. Pessoa, I. Cavaco, I. Correia, D. Costa, R. T. Henriques and R. D. Gillard, Inorg. Chim. Acta, 2000, 305, 7–13 CrossRef;
(c) M. Kirihara, Coord. Chem. Rev., 2011, 255, 2281–2302 CrossRef CAS;
(d) H.-Y. Zhao, Y.-H. Xing, Y.-Z. Cao, Z.-P. Li, D.-M. Wei, X.-Q. Zeng and M.-F. Ge, J. Mol. Struct., 2009, 938, 54–64 CrossRef CAS.
- G. H. Jeffery, J. Bassett, J. Mendham and R. C. D. Addison, Vogel's Text Book of Quantitative Chemical Analysis, Wesley Longman Limited, UK, 5th edn, 1989 Search PubMed.
- R. G. Parr and W. Yang, Density Functional Theory of Atoms and Molecules, Oxford University Press, Oxford, 1989 Search PubMed.
-
(a) V. Barone and M. Cossi, J. Phys. Chem. A, 1998, 102, 1995–2001 CrossRef CAS;
(b) M. Cossi and V. Barone, J. Chem. Phys., 2011, 115, 4708–4717 CrossRef;
(c) M. Cossi, N. Rega, G. Scalmani and V. Barone, J. Comput. Chem., 2003, 24, 669–681 CrossRef CAS PubMed.
- A. D. Becke, J. Chem. Phys., 1993, 98, 5648–5652 CrossRef CAS.
- C. Lee, W. Yang and R. G. Parr, Phys. Rev. B: Condens. Matter Mater. Phys., 1998, 37, 785–789 CrossRef.
- M. J. Frisch, G. W. Trucks, H. B. Schlegel, G. E. Scuseria, M. A. Robb, J. R. Cheeseman, G. Scalmani, V. Barone, B. Mennucci, G. A. Petersson, H. Nakatsuji, M. Caricato, X. Li, H. P. Hratchian, A. F. Izmaylov, J. Bloino, G. Zheng, J. L. Sonnenberg, M. Hada, M. Ehara, K. Toyota, R. Fukuda, J. Hasegawa, M. Ishida, T. Nakajima, Y. Honda, O. Kitao, H. Nakai, T. Vreven, J. A. Montgomery Jr, J. E. Peralta, F. Ogliaro, M. Bearpark, J. J. Heyd, E. Brothers, K. N. Kudin, V. N. Staroverov, R. Kobayashi, J. Normand, K. Raghavachari, A. Rendell, J. C. Burant, S. S. Iyengar, J. Tomasi, M. Cossi, N. Rega, J. M. Millam, M. Klene, J. E. Knox, J. B. Cross, V. Bakken, C. Adamo, J. Jaramillo, R. Gomperts, R. E. Stratmann, O. Yazyev, A. J. Austin, R. Cammi, C. Pomelli, J. W. Ochterski, R. L. Martin, K. Morokuma, V. G. Zakrzewski, G. A. Voth, P. Salvador, J. J. Dannenberg, S. Dapprich, A. D. Daniels, Ö. Farkas, J. B. Foresman, J. V. Ortiz, J. Cioslowski and D. J. Fox, Gaussian 09, (Revision A.1), Gaussian, Inc., Wallingford, CT, 2009 Search PubMed.
-
(a) T. Liu, H.-X. Zhang and B.-H. Xia, J. Phys. Chem. A, 2007, 111, 8724–8730 CrossRef CAS PubMed;
(b) X. Zhou, H.-X. Zhang, Q.-J. Pan, B.-H. Xia and A.-C. Tang, J. Phys. Chem. A, 2005, 109, 8809–8818 CrossRef CAS PubMed;
(c) X. Zhou, A.-M. Ren and J.-K. Feng, J. Organomet. Chem., 2005, 690, 338–347 CrossRef CAS;
(d) A. Albertino, C. Garino, S. Ghiani, R. Gobetto, C. Nervi, L. Salassa, E. Rosenverg, A. Sharmin, G. Viscardi, R. Buscaino, G. Cross and M. Milanesio, J. Organomet. Chem., 2007, 692, 1377–1391 CrossRef CAS.
- N. M. O'Boyle, A. L. Tenderholt and K. M. Langner, J. Comput. Chem., 2008, 29, 839–845 CrossRef PubMed.
- E. Verhaeghe, D. Buisson, E. Zekri, C. Leblanc, P. Potin and Y. Ambroise, Anal. Biochem., 2008, 379, 60–65 CrossRef CAS PubMed.
- G. J. Colpas, B. J. Hamstra, J. W. Kampf and V. L. Pecoraro, J. Am. Chem. Soc., 1996, 118, 3469–3478 CrossRef CAS.
- J. B. Chaires, N. Dattagupta and D. M. Crothers, Biochemistry, 1982, 21, 3933–3940 CrossRef CAS PubMed.
-
(a) U. Saha and K. K. Mukherjea, Int. J. Biol. Macromol., 2014, 66, 166–171 CrossRef CAS PubMed;
(b) M. Selim and K. K. Mukherjea, J. Biomol. Struct. Dyn., 2009, 26, 561–566 CrossRef CAS PubMed;
(c) M. Selim, S. R. Chowdhury and K. K. Mukherjea, Int. J. Biol. Macromol., 2007, 41, 579–583 CrossRef CAS PubMed.
- L. Krivosudský, P. Schwendt, R. Gyepes and Z. Zak, Polyhedron, 2014, 81, 421–427 CrossRef.
- C. R. Cornman, J. Kampf and V. L. Pecoraro, Inorg. Chem., 1992, 31, 1981–1983 CrossRef CAS.
-
(a) M. R. Maurya and S. Khurana, Transition Met. Chem., 2003, 28, 511–517 CrossRef CAS;
(b) P. Raghunathan and B. B. Das, Chem. Phys. Lett., 1989, 160, 627–631 CrossRef CAS.
- E. Froehlich, A. Gupta, J. Provencher-Mandeville, E. Asselin, J. Bariyanga, G. Bérubé and H.-A. Tajmir-Riahi, DNA Cell Biol., 2009, 28, 31–39 CrossRef CAS PubMed.
- J. K. Barton, A. T. Danishefsky and J. M. Goldberg, J. Am. Chem. Soc., 1984, 106, 2172 CrossRef CAS.
- T. M. Kelly, A. B. Tossi, D. J. McConnel and T. C. Streakas, Nucleic Acids Res., 1985, 13, 6017–6034 CrossRef PubMed.
- T. Biver, F. Secco, M. R. Tine and M. Venturini, J. Inorg. Biochem., 2004, 98, 33–40 CrossRef CAS PubMed.
-
(a) S. R. Chowdhury, M. Selim, S. Chatterjee, S. Igarashi, Y. Yukawa and K. K. Mukherjea, J. Coord. Chem., 2012, 65, 3469–3480 CrossRef CAS;
(b) V. Rajendiran, R. Karthik, M. Palaniandavar, H. S. Evans, V. S. Periasamay, M. A. Akbarsha, B. S. Srinag and H. Krishnamurthy, Inorg. Chem., 2007, 46, 8208–8221 CrossRef CAS PubMed.
- S. Satyanarayana, J. C. Dabrowiak and J. B. Chaires, Biochemistry, 1992, 31, 9319–9324 CrossRef CAS PubMed.
- C. V. Kumar and E. H. Asuncion, J. Am. Chem. Soc., 1993, 115, 8547–8553 CrossRef CAS.
|
| This journal is © The Royal Society of Chemistry 2015 |
Click here to see how this site uses Cookies. View our privacy policy here. 


