CNT addition to the LiBH4–MgH2 composite: the effect of milling sequence on the hydrogen cycling properties†
F. Cova*,
F. C. Gennari and
P. Arneodo Larochette
Consejo Nacional de Investigaciones Científicas y Técnicas, CONICET - Instituto Balseiro (UNCuyo and CNEA), Centro Atómico Bariloche (CNEA), R8402AGP, S. C. de Bariloche, Río Negro, Argentina. E-mail: covaf@cab.cnea.gov.ar
First published on 15th October 2015
Abstract
The composite 2LiBH4![[thin space (1/6-em)]](https://www.rsc.org/images/entities/char_2009.gif) :
:![[thin space (1/6-em)]](https://www.rsc.org/images/entities/char_2009.gif) MgH2 has recently received attention as a potential hydrogen storage material. This is mainly due to its high storage capacity. However, the temperatures needed to obtain adequate reaction kinetics are still too high for practical applications. In the present work we study the effect of Ni and carbon nanotube addition as catalysers. We found that different synthesis methods of the composite lead to different hydrogen absorption/desorption kinetic behaviours. These changes can be attributed to morphological and microstructural differences caused by the dissimilar milling stages at which the nanotubes were introduced during the sample synthesis. An induction time during the hydrogen desorption appeared as a consequence of the different dispersions of the carbon nanotubes observed in the samples prepared with both synthesis methods. It was also found that equilibrium pressure increased when the temperature decreased below 375 °C, this effect was kinetic and it was possible to conclude that the addition of nanotubes had no effect on the thermodynamics of the system.
MgH2 has recently received attention as a potential hydrogen storage material. This is mainly due to its high storage capacity. However, the temperatures needed to obtain adequate reaction kinetics are still too high for practical applications. In the present work we study the effect of Ni and carbon nanotube addition as catalysers. We found that different synthesis methods of the composite lead to different hydrogen absorption/desorption kinetic behaviours. These changes can be attributed to morphological and microstructural differences caused by the dissimilar milling stages at which the nanotubes were introduced during the sample synthesis. An induction time during the hydrogen desorption appeared as a consequence of the different dispersions of the carbon nanotubes observed in the samples prepared with both synthesis methods. It was also found that equilibrium pressure increased when the temperature decreased below 375 °C, this effect was kinetic and it was possible to conclude that the addition of nanotubes had no effect on the thermodynamics of the system.
1. Introduction
In the last few years, many efforts have been devoted to the development of new methods of hydrogen storage in order to establish hydrogen as a viable energy carrier.1,2 Recently, attention has shifted towards the study of complex hydrides and complex hydride based composites due to their high gravimetric storage capacities.3–10 Complex hydrides are usually ionic solids which have an alkali or alkaline earth cation and a complex anion group formed by a central atom (generally N, Al, or B) and surrounding hydrogen atoms linked to the central one by a covalent bond.7,11–16 One of the most studied complex hydride based composite is 2LiBH4![[thin space (1/6-em)]](https://www.rsc.org/images/entities/char_2009.gif) :
:![[thin space (1/6-em)]](https://www.rsc.org/images/entities/char_2009.gif) MgH2, which is composed by the mixture of a complex hydride (LiBH4) and a metallic hydride (MgH2). Metallic hydrides are basically metallic or intermetallic compounds in which the hydrogen occupies interstitial positions.12,17
MgH2, which is composed by the mixture of a complex hydride (LiBH4) and a metallic hydride (MgH2). Metallic hydrides are basically metallic or intermetallic compounds in which the hydrogen occupies interstitial positions.12,17
LiBH4 is a complex hydride which has one of the highest hydrogen storage capacities among all the hydrides. However, its decomposition requires high temperatures for a reasonable absorption/desorption kinetics and the reactions have a very high reaction enthalpy for practical purposes.8,18,19 The presence of MgH2 allows the LiBH4 to decompose to a lower energy state during desorption. In presence of Mg, under the right hydrogen pressure and temperature conditions, the dehydrogenation of LiBH4 derives in the formation MgB2 instead of B. MgB2 is a more stable compound than B and thus the dehydrogenated state of the composite is stabilised respect to the pure LiBH4. This process is called destabilisation and was firstly introduced by Vajo et al.20,21 However, even in destabilised systems, the desorption temperatures remain high for practical applications. In an attempt to overcome these problems, several authors have proposed that the nanoconfinement of different composite systems could improve the reaction kinetics allowing lower temperatures for the reaction.22–26 Additionally, several catalysers have been proposed to increase the reaction rate at low temperatures, however adequate kinetics at temperatures below 250 °C have not been obtained thus far.27–30 On the other hand, carbon nanotubes (CNT) have shown a substantial beneficial effect over the hydrogen sorption properties in several different hydrides and hydride systems.30–32 In particular, the addition of CNT has a catalytic effect in MgH2, which is related to the introduction during ball milling of carbon fragments to the hydride matrix, allowing better interactions of the material with the hydrogen molecule.33 In complex hydrides, the presence of carbon results in the weakening of the bonds between hydrogen and the alkali or alkali-earth metals, leading to a lower desorption energy.33,34 Some studies of the addition of CNT to the composite 2LiBH4![[thin space (1/6-em)]](https://www.rsc.org/images/entities/char_2009.gif) :
:![[thin space (1/6-em)]](https://www.rsc.org/images/entities/char_2009.gif) MgH2 has been done previously showing good results for the first desorption, in particular with the addition of another catalyst like Ru.30 However, the effect of the presence of the CNT has not been thoroughly studied after several absorption/desorption cycles. In fact, Wang et al.35 reported an important loss in the hydrogen storage capacity after the second cycle. For these reasons, in this work, the effect of the addition of carbon nanotubes to the Ni catalysed 2LiBH4
MgH2 has been done previously showing good results for the first desorption, in particular with the addition of another catalyst like Ru.30 However, the effect of the presence of the CNT has not been thoroughly studied after several absorption/desorption cycles. In fact, Wang et al.35 reported an important loss in the hydrogen storage capacity after the second cycle. For these reasons, in this work, the effect of the addition of carbon nanotubes to the Ni catalysed 2LiBH4![[thin space (1/6-em)]](https://www.rsc.org/images/entities/char_2009.gif) :
:![[thin space (1/6-em)]](https://www.rsc.org/images/entities/char_2009.gif) MgH2 composite was studied, with a focus in the stability of the system and its resilience to deterioration after several sorption cycles. Additionally, two different synthesis methods were compared in order to find the effect that the milling sequence has over the sample hydrogen storage properties.
MgH2 composite was studied, with a focus in the stability of the system and its resilience to deterioration after several sorption cycles. Additionally, two different synthesis methods were compared in order to find the effect that the milling sequence has over the sample hydrogen storage properties.
2. Experimental
2.1. Synthesis of the materials
The synthesis of the materials used in this work was done from the following raw materials: MgH2 (Sigma Aldrich, hydrogen storage grade), Ni (Sigma Aldrich, purity 99%), LiBH4 (Sigma Aldrich, purity >90%) and multi-walled carbon nanotubes (Aldrich, 95% of nanotubes and about 5% of carbon). All the sample preparation and handling was done in an argon-filled glove box (MBraun Unilab), with oxygen and moisture levels <1 ppm. These precautions were necessary due to the high reactivity of MgH2 and LiBH4 with air and water.The materials were prepared by mechanical grinding in a medium-energy planetary type mill (Fritsch Pulverisette 6) under 100 kPa of argon atmosphere. All samples were ball-milled at 400 rpm with a ball mass/sample mass ratio of 40![[thin space (1/6-em)]](https://www.rsc.org/images/entities/char_2009.gif) :
:![[thin space (1/6-em)]](https://www.rsc.org/images/entities/char_2009.gif) 1. Because of the slow reaction kinetics of the 2LiBH4
1. Because of the slow reaction kinetics of the 2LiBH4![[thin space (1/6-em)]](https://www.rsc.org/images/entities/char_2009.gif) :
:![[thin space (1/6-em)]](https://www.rsc.org/images/entities/char_2009.gif) MgH2 composite, Ni was added as a catalyst. The chosen composition for the base material was 2LiBH4–MgH2 + 5 wt% Ni. This material, referred as LBMN in the text, was selected as reference based in previous work performed with a composite with this composition.36 CNT were added to the base material in a proportion, 95% LBMN + 5% CNT in weight. Two different samples were prepared by the addition of nanotubes. The first sample was synthesised by milling all the raw materials during 10 hours under the specified conditions, this sample was denominated LBMNC. The other sample was prepared in two steps. Initially MgH2, Ni and LiBH4 were milled for 8 hours in order to form the LBMN sample. After that, CNT were added to the milling chamber and the new mixture was milled for another 2 hours to complete the 10 hour milling used for the first sample. The second sample was named LBMNT.
MgH2 composite, Ni was added as a catalyst. The chosen composition for the base material was 2LiBH4–MgH2 + 5 wt% Ni. This material, referred as LBMN in the text, was selected as reference based in previous work performed with a composite with this composition.36 CNT were added to the base material in a proportion, 95% LBMN + 5% CNT in weight. Two different samples were prepared by the addition of nanotubes. The first sample was synthesised by milling all the raw materials during 10 hours under the specified conditions, this sample was denominated LBMNC. The other sample was prepared in two steps. Initially MgH2, Ni and LiBH4 were milled for 8 hours in order to form the LBMN sample. After that, CNT were added to the milling chamber and the new mixture was milled for another 2 hours to complete the 10 hour milling used for the first sample. The second sample was named LBMNT.
2.2. Characterisation
Microstructural, structural, thermal and hydrogen storage properties of the composites were studied by means of powder X-ray diffraction (PXRD, Bruker Advance D8), Fourier transform infrared spectroscopy (FTIR, PerkinElmer Spectrum 400), differential scanning calorimetry (DSC, TA 2910 calorimeter), scanning electron microscopy (SEM Nova Nano 230, FEI Company), surface area (BET, Micromeritics ASAP 2020) and a Sieverts type volumetric equipment.PXRD (CuKα radiation) and FTIR analyses were performed to obtain the structural information about the samples. A tight sealed sample holder was used during PXRD and FTIR data collection, to completely prevent any interaction between samples and air. For IR spectroscopy measurements, the selected samples were ground with dry KBr and pressed into pellets before introducing them in the airtight sample cell. Solid-state IR spectra were obtained in the range of 800–4000 cm−1 in transmission mode.
Morphological and microstructural characterizations were performed via SEM with energy dispersive X-ray spectroscopy (EDS) analyser. Samples of the synthesised/cycled powders were prepared inside the glove box to prevent decomposition in contact with the atmosphere, and only opened at the moment of measuring.
Textural characteristics of the samples were studied using N2 adsorption isotherms. The isotherms were collected at −196 °C, 100 mg of sample was used. Before performing the measurements, the samples were evacuated at 100 °C for 12 hours to remove any adsorbed molecule that could be present in the surface of the material. Surface area and pore distribution were obtained applying the method of Brunauer, Emmett and Teller (BET method).
The study of the thermal behaviour of the samples was done by DSC at a heating rate of 5 °C min−1. An argon flow of 122 mL min−1 was used to avoid any interaction with the atmosphere during desorption. About 5 mg of sample was loaded into aluminium capsules closed in the glove box.
A modified Sieverts type device, coupled with a mass flow controller was used to measure the kinetics of hydrogenation and dehydrogenation of the samples. The mass flow controller allowed the Sieverts device to keep an almost constant pressure during the whole experiment. Absorptions performed to test the cycling properties of the materials were done at 425 °C and 6000 kPa. Hydrogen desorption measurements were performed at 425 °C and 600 kPa of back pressure. This backpressure is necessary to guarantee that the system follows the desired reaction pathway during the desorption experiment at 425 °C.36–38 Before performing the pressure-composition isotherm absorption measurements, the samples were desorbed with the mentioned conditions.
The method utilised for measuring desorption (absorption) PCIs was as follows: a programmed amount of hydrogen was extracted (introduced) from (into) the system using the mass flow controller. The hydrogen was extracted (introduced) in batches of 0.45 mg (equivalent to 0.3 wt%). Consequently the pressure decreased (increased) around 30 kPa. Then the measurement software waited for 1000 seconds for the system to reach equilibrium. Simultaneously, the software measured the temporal variation of the pressure. In the case that this variation was lower than a fixed value (10−2 kPa seg−1), the system was considered to be in equilibrium and a data point in the PCI curve was saved. A data point was also saved if the 1000 seconds waiting period was achieved.
Composition of the samples after PCI measurements was studied by PXRD and the Rietveld method.39 for the refinement, a pseudo-Voigt shape was assumed; the background introduced by the sample holder was initially set by hand and refined in each run. The ATZ coefficient was obtained using the Fullprof software40 for each PXRD measurement. This coefficient allowed to perform the quantitative phase analysis for each partially absorbed sample.
3. Results and discussion
3.1. Characterisation of the as-milled materials
In order to understand the differences in the as-milled samples caused by the two different methods of synthesis, DSC and PXRD analyses were performed in both samples. In Fig. 1A, the results of the DSC results are presented. In that same figure, the DSC corresponding to the LBMN sample was also added as reference. All the samples show the same peaks. The onsets at 115 °C and 275 °C, correspond to the transition from orthorhombic to hexagonal phases (O → H) and melting of pure LiBH4 respectively.18,41,42 The onset at 345 °C can be attributed to the dehydrogenation of MgH2 while the increment of the heat flow observed at 375 °C can be associated to the LiBH4 desorption.43 Comparing the results from the samples with and without CNT, it can be deduced that the nanotubes do not provide an additional catalytic effect. The decrease in the dehydrogenation temperature observed in the material respect to the pure LiBH4 is due to the Ni.36 However it is possible to notice an effect caused by the CNT. The samples that included the nanotubes present a clearly perceptible sagging of the baseline. This may be due to the variation of the thermal conductivity of the sample caused by the presence of the CNT. It is important to remark that graphite planes that make CNTs have an anisotropic thermal conductivity due to their planar crystal structure. The as-milled LBMNC and LBMNT samples were studied by PXRD to ensure that no reaction occurred among the initial materials during the milling process.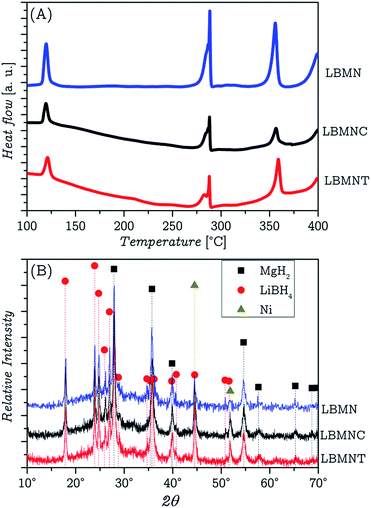 | ||
| Fig. 1 DSC (A) and PXRD (B) analyses of the LBMNC and LBMNT samples. Reference curve corresponding to the LBMN sample is also added. | ||
Fig. 1B shows that only the materials introduced in the vial for milling are present. The Ni is hard to observe as its main peaks overlap with those of LiBH4. CNTs are not seen in the figure because they are invisible to the XRD, even when studied in their pure state.
Comparing the width of the peaks in this figure with the width of the peaks corresponding to LBMN material it can be assumed that the amount of energy transferred to both materials during milling was similar.36 FTIR analyses (presented in the ESI†) of both as-milled samples showed no difference between them and the sample without CNT.
3.2. Kinetic study of the interactions between the samples and hydrogen
As it was mentioned previously, the first dehydrogenation was performed at 425 °C and 600 kPa of backpressure. These conditions ensure that the thermodynamically preferred desorption reaction has MgB2 as a product and prevents the formation of Li2B12H12.42 The presence of MgB2 is what ensure the reversibility of the system.37,38 The desorption measurements did not show a reproducible behaviour during the first desorption, even for samples extracted from the same batch. This phenomenon was observed in all the composite materials, with and without CNT. Similar measurements showed different times required for the reaction completion and the amount of hydrogen desorbed in each measurement was not the same. However the general behaviour of the samples (presence or absence of an induction time and shape of the kinetic curve) was consistent between different samples of the same materials and the dissimilarities between the materials was observed in every measurement.Further PXRD studies of the desorbed samples showed no disparities structure-wise. In our previous work36 this phenomenon was attributed to an uneven distribution or proximity between LiBH4 and MgH2 particles in the powder. This conclusion was taken based on the results reported by Bösenberg et al.41 However, the desorption behaviour of the samples with nanotubes showed significant differences between them, as can be seen in Fig. 2A. In the figure becomes clear that the LBMNC sample presents an important induction time which is not present in the LBMNT samples and LBMN. By contrast, the sample that had the CNT added after the initial milling process, presented a desorption behaviour similar to the sample without nanotubes.
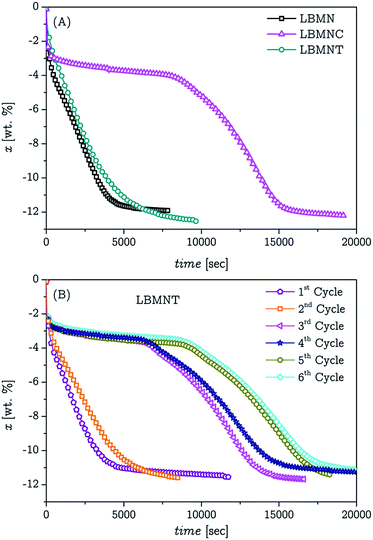 | ||
| Fig. 2 First desorption of the LBMNT, LBMNC and LBMN samples (A). Desorption cycles of sample LBMNT (B). | ||
This is an indication that the CNT have an effect in the system during the milling. This effect is not structural, as it becomes clear from the PXRD and FTIR analyses. While it may be assumed that the Ni catalytic effect can be cancelled by the nanotubes deriving in the presence of the induction time, the results obtained from DSC curves (Fig. 1A) indicate that the catalytic effect is still present in both samples.
In order to determine if the differences between the samples were morphological/microstructural, they were observed by SEM. The images obtained in this study are presented in Fig. 3. It can be seen that there is a considerable difference between the two samples from a morphological point of view. In the images taken with a magnification of 6000× (Fig. 3 C1 and T1) it can be clearly distinguished that in the LBMNT sample, on which the nanotubes were added after a milling process, the material surface appears to be smooth while the other seems to be rough, with lots of cracks on it.
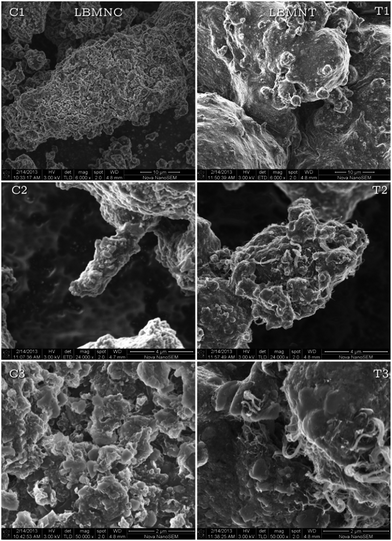 | ||
| Fig. 3 Images taken by SEM of the samples LBMNC (C1, C2 and C3) and LBMNT (T1, T2 and T3) at different magnifications. | ||
One possible explanation for this is that in the LBMNC sample (C1) the agglomerates created from multiple particles are stuck to each other. In the LBMNT sample (T1), the agglomerates are coated by graphite layers detached from the nanotubes. This could be a reason that explains why the surface of this sample seems to be smooth. This reasoning however, do not explain why the graphite layer detachment and subsequent coating of the composite does not occur in the LBMNC material. An observation of both materials at higher magnification (24![[thin space (1/6-em)]](https://www.rsc.org/images/entities/char_2009.gif) 000×) is presented in Fig. 3 C2 and T2. In those images it can be seen that in the LBMNC sample (C2) there are tubular structures that appear to be inserted in the agglomerates. In Fig. 3 C2, it is possible to notice the tip of one of these tubular structures protruding from an agglomerate. This type of structure is unusual in milled materials, so it could be assumed that these are braids of nanotubes coated by the 2LiBH4
000×) is presented in Fig. 3 C2 and T2. In those images it can be seen that in the LBMNC sample (C2) there are tubular structures that appear to be inserted in the agglomerates. In Fig. 3 C2, it is possible to notice the tip of one of these tubular structures protruding from an agglomerate. This type of structure is unusual in milled materials, so it could be assumed that these are braids of nanotubes coated by the 2LiBH4![[thin space (1/6-em)]](https://www.rsc.org/images/entities/char_2009.gif) :
:![[thin space (1/6-em)]](https://www.rsc.org/images/entities/char_2009.gif) MgH2 composite during the milling process. The coating deposited on the surface of the nanotubes could have caused the confinement of graphite layers and thus it was not possible for the planes to detach from the CNT. In the image corresponding to the LBMNT sample (T2) nanotubes are clearly visible on the material surface and coming out from inside the material. The presence of the nanotubes exposed on the surface would allow the formation of a graphite layer covering the surface. Since the nanotubes are not covered by the composite, the graphite layers are not confined, and it is possible for them to be detached from the nanotubes surface.
MgH2 composite during the milling process. The coating deposited on the surface of the nanotubes could have caused the confinement of graphite layers and thus it was not possible for the planes to detach from the CNT. In the image corresponding to the LBMNT sample (T2) nanotubes are clearly visible on the material surface and coming out from inside the material. The presence of the nanotubes exposed on the surface would allow the formation of a graphite layer covering the surface. Since the nanotubes are not covered by the composite, the graphite layers are not confined, and it is possible for them to be detached from the nanotubes surface.
Finally, a detail of both samples is presented in Fig. 3 C3 and T3 in a higher magnification (50![[thin space (1/6-em)]](https://www.rsc.org/images/entities/char_2009.gif) 000×). It is possible to notice that when observed at this level of detail, the morphology of both materials, LBMNT (T3) and LBMNC (C3), is similar. The only observable difference is the presence of the coating and the nanotubes on the surface. This would reinforce the hypothesis presented earlier about the LBMNT material, been similar to the LBMC, but with the cover of graphite layers.
000×). It is possible to notice that when observed at this level of detail, the morphology of both materials, LBMNT (T3) and LBMNC (C3), is similar. The only observable difference is the presence of the coating and the nanotubes on the surface. This would reinforce the hypothesis presented earlier about the LBMNT material, been similar to the LBMC, but with the cover of graphite layers.
Considering that the presence of carbon nanotubes on the surface of the material could have an influence on the specific area, BET area measurements were made in both materials. However, the results showed a specific area of 5 m2 g−1 in both cases. These values are similar to the area obtained for the LBMN sample. The measurements also did not show any change in the type or the hysteresis of the N2 isotherm. From these results it is possible to deduce that the induction time observed is related to the morphology of the LBMNC sample. One possible explanation for the presence of this induction time may be that the nanotubes covered by the composite previously observed by SEM (Fig. 3 C2) could hinder the nucleation of the MgB2 phase. It has been reported that the graphite planes are introduced inside the MgH2 matrix during milling which could make the interactions of Mg with LiBH4 more difficult. These graphitic layers could occupy the places of the boron layers formed on MgB2 and thus slowing down their nucleation.41,44,45
After some cycles of hydrogenation/dehydrogenation the LBMNT sample started to show the same induction time observed in the LBMNC sample. This effect is shown in Fig. 2B. As it can be seen in the figure, the induction time appears after only 3 cycles and it grows with each cycle. After the 6th cycle, the induction time is similar to the one observed for the LBMNC sample. To find an explanation to this phenomenon the LBMNT sample was removed after several hydrogen absorption/desorption cycles and observed at SEM. The images obtained are presented in Fig. 4. It is possible to notice that now the nanotubes can be clearly observed as tubes covered by the composite. There is also a straightening of the nanotubes; this could be caused by the solidification of the LiBH4 over its surface. The nanotubes provide a site for the nucleation and when the crystals start to grow, they cause a tension that unbend the nanotubes causing them to adopt the straight position observed in the figure. This covering may have an effect similar to the observed in the LBMNC sample and be the reason for the induction time observed after some hydrogenation/dehydrogenation cycles.
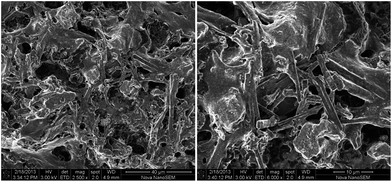 | ||
| Fig. 4 Images taken by SEM of the LBMNT sample after several absorption/desorption cycles at two different magnifications. | ||
3.3. Thermodynamic study of the interactions between the samples and hydrogen
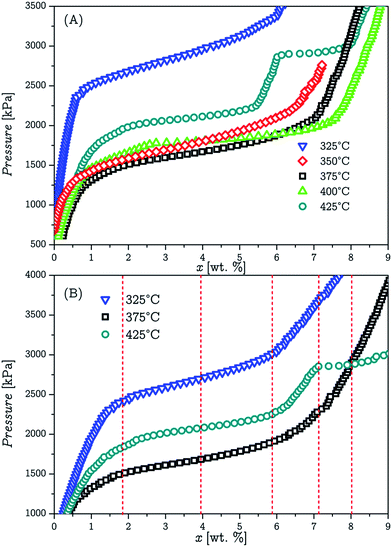
The thermodynamic study of the samples was performed by PCI measurements as described in the experimental section. Absorption isotherms were obtained in a temperature range varying from 325 °C to 425 °C for both samples. Each measurement was done with a fresh sample to prevent any effect that may appear after the first absorption/desorption cycle. The results for the LBMNT sample are presented in Fig. 5A. The LBMNC sample (not presented) had a similar behaviour. The plateau pressures for temperatures in the range between 375 °C and 425 °C are consistent with the reported previously for the 2LiBH4![[thin space (1/6-em)]](https://www.rsc.org/images/entities/char_2009.gif) :
:![[thin space (1/6-em)]](https://www.rsc.org/images/entities/char_2009.gif) MgH2 composite.36,46 The equilibrium pressures at temperatures below 375 °C however, show an increment when the temperature decreases. This result was not expected, as this would indicate that a different reaction was occurring at those temperatures. Furthermore, the enthalpy of this reaction should be negative, in contrast to the positive enthalpy of the reaction: MgB2 + LiH + H2 → LiBH4 + MgH2. This behaviour is highly unusual for this kind of reactions, although not impossible.
MgH2 composite.36,46 The equilibrium pressures at temperatures below 375 °C however, show an increment when the temperature decreases. This result was not expected, as this would indicate that a different reaction was occurring at those temperatures. Furthermore, the enthalpy of this reaction should be negative, in contrast to the positive enthalpy of the reaction: MgB2 + LiH + H2 → LiBH4 + MgH2. This behaviour is highly unusual for this kind of reactions, although not impossible.
In order to get a better understanding of the obtained results, the PCI measurements were redone, and the measurements were stopped at fixed values of absorbed hydrogen. The samples were then quenched to prevent any reaction that could happen after the measurement had finished. This process was done for 3 different temperatures, 325 °C, 375 °C and 425 °C, and the measurements were stopped at 5 different amounts of absorbed hydrogen (indicated in Fig. 5B with dashed vertical lines).
Each measurement was done with a new fresh sample. The amounts of absorbed hydrogen in each measurement are shown in Fig. 5B. The quenched and withdrawn samples were subsequently analysed by PXRD. The results from the PXRD analyses are shown in Fig. 6. It is possible to notice from the results, that at 375 °C and 325 °C, MgB2 decomposition and MgH2 formation occur simultaneously. However at 425 °C, the decomposition of MgB2 gives as result the formation of Mg, and in a different step the Mg hydrogenates to form MgH2. These results were expected considering the double plateau observed at 425 °C. The obtained diffractograms were refined utilising the Rietveld method in order to get the phase composition for each one and compare the pathways at 325 °C and 375 °C. The average value for the Rwp obtained from the refinements was 10.5% with a χ2 value of 1.2. These results are presented in Fig. 7.
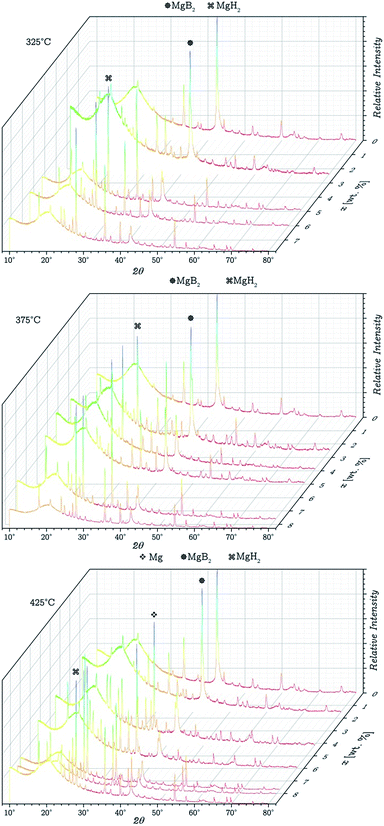 | ||
| Fig. 6 PXRD of the samples withdrawn (from the PCI measurements) with different amounts of absorbed hydrogen and temperatures. | ||
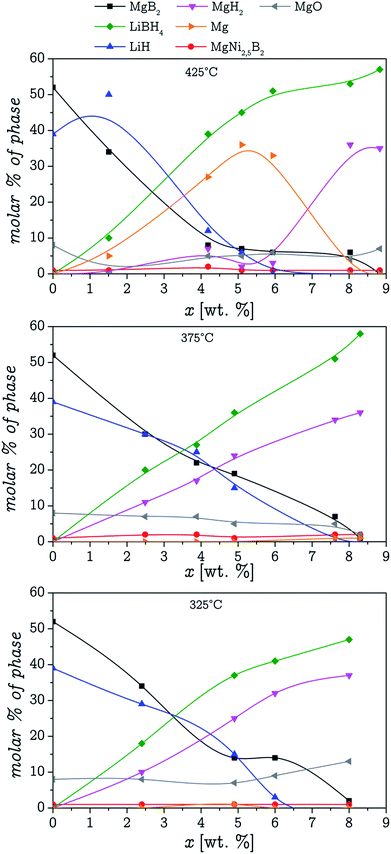 | ||
| Fig. 7 Molar percentage of every phase as a function of the amount of hydrogen absorbed at 3 different temperatures. | ||
It is important to notice that the absorbed hydrogen percentage shown in Fig. 6 and 7 do not match the values at which the samples were quenched presented in Fig. 5B. This is because the weight of absorbed hydrogen for each sample was recalculated based on the results obtained from the Rietveld refinement. Therefore these values are a better representation of the actual quantity of hydrogen present in the samples. The difference observed between both amounts of absorbed hydrogen can be attributed to several factors like the time needed to remove the samples from the heater and quench them, volumetric measurements errors and the weight of the sample.
In Fig. 6 broad peak can be observed at low angles. This is part of the background and belongs to the dome shaped sample holder required to prevent the interaction between the samples and air. From this figure it can be deduced that the hydrogen absorption reactions at 375 °C and 325 °C, both follow the same path (only one step: MgB2 + LiH + H2 → LiBH4 + MgH2 without the formation of Mg as an intermediate reaction), and the inconsistences observed in the equilibrium pressure (Fig. 5A) are not due to a different reaction occurring. A possible explanation for the unusual behaviour of the samples is that at 325 °C the hydrogenation reaction is limited by its kinetic. Additional PCI measurements were performed increasing the amount of time that the measurement software waited to reach equilibrium at 325 °C, however, the obtained plateau pressures in these experiments were similar to the obtained with a shorter waiting time. This may imply that at temperatures below 375 °C, the reaction is very slow, and would require to wait for the equilibrium an amount of time high enough to induce the presence of significant measurement errors.
At lower temperatures, the energetic barriers presented by the different reaction steps became hard to surpass for the system, which results in the stopping of the reaction. Higher pressures increase the chemical potential of the hydrogen in gaseous state, thus reducing the reaction barrier. Greater pressures also increase the number of attempts that the hydrogen in gaseous states does for crossing the energy barrier. This is equivalent to consider that the higher pressures guarantee the necessary driving force for the reaction to happen. It is possible that at 325 °C and 350 °C the rate constant may be so small that a much greater driving force is needed for the reaction to happen. If this is correct, then the pressure measured at the absorption PCI is not the equilibrium pressure but the pressure that ensures a driving force that is required for the reaction to happen.
Is it possible to conclude from these results that the presence of CNT do not have any impact in the thermodynamics of the system.
4. Conclusions
The effect of the addition of CNT to the Ni catalysed 2LiBH4![[thin space (1/6-em)]](https://www.rsc.org/images/entities/char_2009.gif) :
:![[thin space (1/6-em)]](https://www.rsc.org/images/entities/char_2009.gif) MgH2 composite was studied. It was found that the steps utilised during the synthesis of the materials had a noticeable effect in the first desorption process. The milling of the nanotubes with the raw materials from scratch resulted in the apparition of an induction time. This time was not present in the material without nanotubes and in the material in which the nanotubes were added in a further step. Since between both materials with nanotubes showed the presence of the same phases, the induction time could be attributed to the morphology of the system. It was clearly observed in the images taken by SEM that the CNT in both materials were dispersed differently. In the LBMNC sample, they were covered by the composite. When this happens the interaction between the surface of the nanotubes and the material may hinder the formation of MgB2 deriving in the observed induction time. In the LBMNT sample the CNT were dispersed in the surface of the 2LiBH4
MgH2 composite was studied. It was found that the steps utilised during the synthesis of the materials had a noticeable effect in the first desorption process. The milling of the nanotubes with the raw materials from scratch resulted in the apparition of an induction time. This time was not present in the material without nanotubes and in the material in which the nanotubes were added in a further step. Since between both materials with nanotubes showed the presence of the same phases, the induction time could be attributed to the morphology of the system. It was clearly observed in the images taken by SEM that the CNT in both materials were dispersed differently. In the LBMNC sample, they were covered by the composite. When this happens the interaction between the surface of the nanotubes and the material may hinder the formation of MgB2 deriving in the observed induction time. In the LBMNT sample the CNT were dispersed in the surface of the 2LiBH4![[thin space (1/6-em)]](https://www.rsc.org/images/entities/char_2009.gif) :
:![[thin space (1/6-em)]](https://www.rsc.org/images/entities/char_2009.gif) MgH2 composite and were not covered by it. Unlike the LBMNC, this second sample did not show the induction time. The explanation about the interaction that causes the presence of the induction time is reinforced by the fact that after some hydrogenation/dehydrogenation cycles the LBMNT sample showed the same induction time and when it was observed in the SEM after several cycles, the CNT were again covered by the composite. It is important to remark that the presence of the induction time severely hinders the applicability of the material as a hydrogen storage system.
MgH2 composite and were not covered by it. Unlike the LBMNC, this second sample did not show the induction time. The explanation about the interaction that causes the presence of the induction time is reinforced by the fact that after some hydrogenation/dehydrogenation cycles the LBMNT sample showed the same induction time and when it was observed in the SEM after several cycles, the CNT were again covered by the composite. It is important to remark that the presence of the induction time severely hinders the applicability of the material as a hydrogen storage system.
An unusual behaviour was observed in the equilibrium pressure at temperatures below 375 °C. The pressure augmented when the temperature decreased. PXRD analyses of the samples obtained with different amounts of hydrogen absorbed at several temperatures showed that the reactions at temperatures below 375 °C followed the same pathway that reactions above that temperature. This indicates that the behaviour was probably caused by kinetic reasons that made impossible to measure the real equilibrium pressure of the system. From these results can be deduced that the presence of the nanotubes do not have any effect on the thermodynamics of the system.
Under the studied experimental conditions, it was found that the initial enhancement in the kinetic behaviour disappears after a few hydrogenation/dehydrogenation cycles, generating induction times of almost two hours. On the other hand, this disadvantage is not outweighed by an improvement in the already complex thermodynamics of the system. Taking both results into account, it is possible to conclude that the system is severely limited in its application as a potential hydrogen storage material.
Acknowledgements
This study has been partially supported by CONICET (National Council of Scientific and Technological Research), CNEA (National Commission of Atomic Energy), ANPCyT (PICT N° 1052) and Instituto Balseiro (University of Cuyo).Notes and references
- G. S. Walker, Solid-state hydrogen storage, Woodhead Publishing Limited, 2008 Search PubMed.
- A. Züttel, A. Borgschulte and L. Schlapbach, Hydrogen as a future energy carrier, Wiley-VHC, 2011 Search PubMed.
- B. Bogdanović and M. Schwickardi, J. Alloys Compd., 1997, 253–254, 1–9 CrossRef.
- B. Bogdanović and M. Schwickardi, Appl. Phys. A: Mater. Sci. Process., 2001, 72, 221–223 CrossRef.
- C. M. Jensen and K. Gross, Appl. Phys. A: Mater. Sci. Process., 2001, 72, 213–219 CrossRef CAS.
- G. D. Sandrock, K. Gross and G. Thomas, J. Alloys Compd., 2002, 339, 299–308 CrossRef CAS.
- Y. Nakamori and S.-I. Orimo, J. Mater. Sci. Eng. B, 2004, 108, 48–50 CrossRef PubMed.
- A. Züttel, S. Rentsch, P. Fischer, P. Wenger, P. Sudan, P. Mauron and C. Emmenegger, J. Alloys Compd., 2003, 356–357, 515–520 CrossRef.
- M. Gao, J. Gu, H. Pan, Y. Wang, Y. Liu, C. Liang and Z. Guo, J. Mater. Chem. A, 2013, 1, 12285 CAS.
- H. Cao, H. Wang, T. He, G. Wu, Z. Xiong, J. Qiu and P. Chen, RSC Adv., 2014, 4, 32555 RSC.
- A. Züttel, A. Borgschulte and S.-I. Orimo, Scr. Mater., 2007, 56, 823–828 CrossRef PubMed.
- E. H. Majzoub and E. C. E. Rönnebro, Mater. Sci. Eng., R, 2012, 73, 15–26 CrossRef CAS PubMed.
- W. Bronger, J. Alloys Compd., 1995, 229, 1–9 CrossRef CAS.
- S.-I. Orimo, Y. Nakamori, J. R. Eliseo, A. Züttel and C. M. Jensen, Chem. Rev., 2007, 107, 4111–4132 CrossRef CAS PubMed.
- H.-W. Li, Y. Yan, S. Orimo, A. Züttel and C. M. Jensen, Energies, 2011, 4, 185–214 CrossRef CAS PubMed.
- J. Mao, Z. Guo and H. Liu, RSC Adv., 2012, 2, 1569 RSC.
- G. D. Sandrock, J. Alloys Compd., 1999, 293–295, 877–888 CrossRef CAS.
- A. Züttel, P. Wenger, S. Rentsch, P. Sudan, P. Mauron and C. Emmenegger, J. Power Sources, 2003, 118, 1–7 CrossRef.
- W. Cai, H. Wang, D. Sun, Q. Zhang, X. Yao and M. Zhu, RSC Adv., 2014, 4, 3082–3089 RSC.
- J. J. Vajo and G. L. Olson, Scr. Mater., 2007, 56, 829–834 CrossRef CAS PubMed.
- J. J. Vajo, S. L. Skeith and F. Mertens, J. Phys. Chem. B, 2005, 109, 3719–3722 CrossRef CAS PubMed.
- M. H. W. Verkuijlen, P. Ngene, D. W. De Kort, C. Barré, A. Nale, E. R. H. van Eck, P. J. M. van Bentum, P. E. De Jongh and A. P. M. Kentgens, J. Phys. Chem. C, 2012, 116, 22169–22178 CAS.
- T. K. Nielsen, U. Bösenberg, R. Gosalawit-Utke, M. Dornheim, Y. Cerenius, F. Besenbacher and T. R. Jensen, ACS Nano, 2010, 4, 3903–3908 CrossRef CAS PubMed.
- G. Mulas, R. Campesi, S. Garroni, E. Napolitano, C. Milanese, F. Dolci, E. Pellicer, M. D. Baró and A. Marini, J. Alloys Compd., 2012, 536, S236–S240 CrossRef CAS PubMed.
- R. Gosalawit-Utke and T. K. Nielsen, J. Phys. Chem. C, 2011, 116, 1526–1534 Search PubMed.
- A. F. Gross, J. J. Vajo, S. L. van Atta and G. L. Olson, J. Phys. Chem. C, 2008, 112, 5651–5657 CAS.
- O. Friedrichs, J. W. Kim, A. Remhof, F. Buchter, A. Borgschulte, D. Wallacher, Y. W. Cho, M. Fichtner, K. H. Oh and A. Züttel, Phys. Chem. Chem. Phys., 2009, 11, 1515–1520 RSC.
- H. Shao, M. Felderhoff and C. Weidenthaler, J. Phys. Chem. C, 2015, 119, 2341–2348 CAS.
- B. C. Weng, X. Yu, Z. Wu, Z. L. Li, T. S. Huang, N. X. Xu and J. Ni, J. Alloys Compd., 2010, 503, 345–349 CrossRef CAS PubMed.
- J. Mao, Z. Guo, X. Yu and H. Liu, J. Alloys Compd., 2011, 509, 5012–5016 CrossRef CAS PubMed.
- M. G. Verón, H. Troiani and F. C. Gennari, Carbon, 2011, 49, 2413–2423 CrossRef PubMed.
- Y. Yan, Y. S. Au, D. Rentsch, A. Remhof, P. E. de Jongh and A. Züttel, J. Mater. Chem. A, 2013, 1, 11177 CAS.
- C. Wu and H.-M. Cheng, J. Mater. Chem., 2010, 20, 5390 RSC.
- P. A. Berseth, A. G. Harter, R. Zidan, A. Blomqvist, C. Moysés Araújo, R. H. Scheicher, R. Ahuja and P. Jena, Nano Lett., 2009, 9, 1501–1505 CrossRef CAS PubMed.
- P.-J. Wang, Z.-Z. Fang, L.-P. Ma and X.-D. Kang, Int. J. Hydrogen Energy, 2008, 33, 5611–5616 CrossRef CAS PubMed.
- F. H. Cova, E. C. E. Rönnebro, Y. J. Choi, F. C. Gennari and P. Arneodo Larochette, J. Phys. Chem. C, 2015, 119, 15816–15822 CAS.
- F. E. Pinkerton, M. S. Meyer, G. P. Meisner, M. P. Balogh and J. J. Vajo, J. Phys. Chem. C, 2007, 111, 12881–12885 CAS.
- J. Yang, A. Sudik and C. Wolverton, J. Phys. Chem. C, 2007, 111, 19134–19140 CAS.
- H. M. Rietveld, J. Appl. Crystallogr., 1969, 2, 65–71 CrossRef CAS.
- J. Rodríguez-Carvajal, Phys. B, 1993, 192, 55–69 CrossRef.
- U. Bösenberg, S. Doppiu, L. Mosegaard, G. Barkhordarian, N. Eigen, A. Borgschulte, T. R. Jensen, Y. Cerenius, O. Gutfleisch, T. Klassen, M. Dornheim and R. Bormann, Acta Mater., 2007, 55, 3951–3958 CrossRef PubMed.
- S.-I. Orimo, Y. Nakamori, G. Kitahara, K. Miwa, N. Ohba, S. Towata and A. Züttel, J. Alloys Compd., 2005, 404–406, 427–430 CrossRef CAS PubMed.
- T. K. Nielsen, M. Polanski, D. Zasada, P. Javadian, F. Besenbacher, J. Bystrzycki, S. Jørgen and T. R. Jensen, ACS Nano, 2011, 5, 4056–4064 CrossRef CAS PubMed.
- U. Bösenberg, D. B. Ravnsbæk, H. Hagemann, V. D'Anna, C. B. Minella, C. Pistidda, W. van Beek, T. R. Jensen, R. Bormann, M. Dornheim, V. D. Anna and W. van Beek, J. Phys. Chem. C, 2010, 114, 15212–15217 Search PubMed.
- L. Mosegaard, B. Møller, J.-E. Jørgensen, U. Bösenberg, M. Dornheim, J. C. Hanson, Y. Cerenius, G. S. Walker, H. J. Jakobsen, F. Besenbacher and T. R. Jensen, J. Alloys Compd., 2007, 446–447, 301–305 CrossRef CAS PubMed.
- M. R. Ghaani, M. Catti and A. Nale, J. Phys. Chem. C, 2012, 116, 26694–26699 CAS.
Footnote |
| † Electronic supplementary information (ESI) available. See DOI: 10.1039/c5ra19504g |
| This journal is © The Royal Society of Chemistry 2015 |

