Studies of dispersed liquid crystals in binary mixtures with ionic liquid and their excitation by electric signals

Jagdeesh Kumar Srivastavaa, Rajendra Kumar Singha, Ravindra Dharb and Shri Singh*a
aDepartment of Physics, Banaras Hindu University, Varanasi, India. E-mail: srisingh23@gmail.com; Fax: +91 542 2368390; Tel: +91 9935025416
bCentre of Material Sciences, University of Allahabad, Allahabad, India

Received 21st September 2015 , Accepted 30th September 2015

First published on 7th October 2015


Abstract

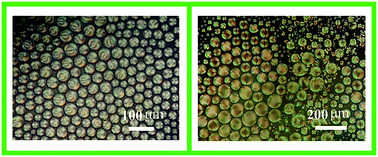
We report the results of dispersion studies of two nematogens (i) 6CHBT (4-(trans-4-n-hexylcyclohexyl)isothiocyanatobenzene) and (ii) PCH5 (4-(trans-4-pentyl-cyclohexyl)benzonitrile) in their binary mixtures with phosphonium based ionic liquid [P6,6,6,14][Ntf2] (trihexyl(tetradecyl)phosphoniumbis(trifluoromethylsulfonyl)amide). The morphology and properties of these mixtures have been investigated by using differential scanning calorimetry (DSC), polarizing optical microscopy (POM), Fourier transform infrared spectroscopy (FTIR), thermogravimetric analysis (TGA), and, their excitations by electric signals. For both the liquid crystals, nematic droplets are found to be dispersed in the ionic liquid having a particular anion, i.e., [Ntf2]. These droplets closely resemble the common droplet morphologies observed in polymer dispersed liquid crystals. Thermal and morphological investigations on the mixtures show a decrease in the peak value of the isotropic to nematic transition and broadening of the associated peak with a decrease in the compositions of nematogens in mixtures. As a result, nematic droplets in a wide temperature range ∼20 °C (i.e., from ∼16 °C to ∼36 °C) are observed for various mixtures. Electrical excitations of the mixtures show significant changes in the droplet size and nematic director orientation inside the droplets due to change in the anchoring conditions with the application of external electric pulses. The influence of the electric field on these nematic droplets and their stability over a wide temperature range suggests their potential for various device development applications.

Introduction

Liquid crystal (LC) dispersion has been the subject of considerable interest in the field of soft condensed state, and during the past two decades much attention has been paid to investigate its behaviour from the point of view of basic understanding and applications.1–5 One of the main outcomes of these dispersion studies results in the form of polymer dispersed liquid crystals (PDLCs).6,7 They are useful not only in various device development applications1,2 but also in addressing the fundamental questions related to the phase separation,3 director configurations in confined geometries,4 electro-optical properties,5 etc. The most common studies on PDLCs have been focused to improve its electro-optical and morphological properties,8,9 droplet size,10–13 phase diagram and miscibility behaviour,14–16 etc. Attention is being paid to continue the work with the use of different polymeric substrates,17,18 multicolour PDLCs,19 photo alignment techniques,20 self-assembling of LCs10,21,22 and synthesis of ionic liquid crystals (ILCs) having various mesophases.23–25

The phase segregation and self-assembling using partially incompatible molecules provide additional functionality such as ionic conductivity to these materials.22 Nematic, being the least ordered and viscous among the various mesophases can be realigned under external stimulation more easily as compared with other mesophases.25 Such materials have also found applications in ion transport,25 smart windows,26 reverse mode PDLCs,27,28 etc. Dielectric force induced LC alignment and interfacial deformation inside the LC droplets have been also the subject of considerable interest.29,30 Alignment of the LC molecules can also be controlled internally by the weak intermolecular interactions such as hydrogen bonding and ionic interactions using some partially incompatible ionic molecules.23,24 This may also enhance the ionic conductivity of the mixtures as well. Therefore, ionic liquid crystals with nematic phase or nematic liquid crystals with ionic properties may provide new scopes for the technological improvements.

Motivation to the present work originates from the fact that inspite of extensive studies on ionic liquid crystals having various mesophases23,24 there are only sporadic studies on the ionic liquid crystals exhibiting nematic phase near room temperature.25,31,32 It is obvious because most of the ILCs consist of a single ionic head group involving linear molecules which is connected with one or multiple long aliphatic tails. The micro-segregation of incompatible units, aggregation of compatible units and minimization of volume results generally in the lamellar or columnar phases at higher temperatures.23–25 Being difficulties in having nematogenic ILCs, our curiosity is to inspect the changes occurring in the droplet morphologies and LC director orientations inside these droplets in the well explored nematogenic compounds, when an ionic flavor is added to their mixtures. With the addition of ionic moieties in these mixtures, even a small change in the externally applied electric field or pulse width is supposed to make significant influence on the LC director orientation and droplet morphology due to sufficient swift in anchoring conditions near isotropic to nematic phase transition temperature.33,34

For the said purpose, we focused our attention on two nematogens 6CHBT and PCH5 which show the co-existence of isotropic to nematic transition viadroplets’ in their mixtures with other solvents.33–36 In the present study, binary mixtures of these two nematogens with phosphonium ionic liquid i.e., [P6,6,6,14][Ntf2] have been used to obtain the phase separated LC droplets having a close resemblance with the droplets found in conventional PDLCs. Materials and methodologies used for the preparation and investigation of the various binary mixtures have been discussed in Experimental section. The Results and discussion section concerns with the thermal and morphological investigations, effect of varying field strength on LC droplets and their director orientation, thermal stability and interaction behaviour of LCs and IL. Paper ends with the Summary and conclusions in the last section.

Experimental

Materials

For the preparation of various binary mixtures both nematogens and ionic liquid were procured from Sigma-Aldrich which were of the highest available purity and used without further purification. The liquid crystals 6CHBT i.e., 4-(trans-4-n-hexylcyclohexyl)isothiocyanato benzene and PCH5 i.e., 4-(trans-4-pentyl-cyclohexyl)benzonitrile have 99% purity, whereas, the purity of ionic liquid [P6,6,6,14][Ntf2] i.e., trihexyl(tetradecyl)phosphonium bis(trifluoromethylsulfonyl)amide is 95%. To remove the volatile impurities from the ionic liquid it is dried in vacuum (at ∼10−3 Torr) for 24 hours before using it in mixtures. We have chosen these nematogens on the basis of some earlier studies related with the coexistence of isotropic and nematic (IN) regions in their mixtures with other solvents.33,34 The 6CHBT is a widely studied NLC which shows nematic droplets in coexistence with isotropic regions of phenyl isocyanate33 and benzene.34 Another NLC, PCH5 had also been well studied and shows dynamics very similar to 6CHBT in nematic phase.35,36 The phosphonium ionic liquid (PIL) with [Ntf2] anion has been used in the present investigation due to its special property of forming matrix with low glass transition temperature and preferential interaction between [Ntf2] anion and phosphonium cation.37 Studies on these materials motivated us to use them in our present work for preparing binary mixtures where phase separated nematic droplets can also be observed.

Methodologies

The binary mixtures have been prepared by stirring different compositions of nematogens and PIL at 120 °C for about three hours. Measurements were carried out after keeping the mixtures at room temperature for more than 72 hours so that the stability of the mixtures can be ensured. The abbreviations used for various binary mixtures in the text are given in Table 1.
Table 1 Abbreviation for various binary mixtures of NLCs and PIL. [P6,6,6,14][Ntf2] = IL, 6CHBT = LC1 and PCH5 = LC2
Variation of LCs in IL (by wt%) IL
LC1 LC2
90 ILLC1(90) ILLC2(90)
80 ILLC1(80) ILLC2(80)
75 ILLC1(75) ILLC2(75)
60 ILLC1(60) ILLC2(60)
50 ILLC1(50) ILLC2(50)


Thermal studies of the mixtures have been carried out using differential scanning calorimeter (Mettler Toledo DSC 1) at scanning rate of 10 °C min−1 with continuous purging of N2 gas at a rate ∼30 ml min−1. The phase transition temperatures have been measured with temperature accuracy and precision at ±0.2 K and ±0.02 K, respectively, and the transition enthalpy with an accuracy of 1%. In order to ensure complete stability of the mixtures and removing moisture, the DSC measurements were performed for two heating–cooling cycles in the temperature range of −40 °C to 120 °C with a hold of 10 minute at 120 °C during the first step. Thermal analyses of these mixtures have been made for the second cooling step.

Morphological investigation of various binary mixtures were carried out after filling them in ITO coated glass cells of thickness 25 μm by capillary action method in their isotropic liquid state at temperature ∼35 °C. These cells are sealed immediately by an adhesive to avoid air bubbles and then subjected to polarizing optical microscope Leitz DMR POM at 100× magnification for further investigation. For controlled temperature operations, homemade water-bath and sample holder with PID temperature controller having accuracy 0.1 °C were used. Effect of the electric field on LC droplets and LC director orientation inside the droplets were studied by applying rectangular electric pulses to these cells through a multifunction generator. Rectangular electric pulses with varying amplitudes (2, 3, 4, 5, and 6 V) and three different pulse widths in the ratios 1[thin space (1/6-em)]:[thin space (1/6-em)]4, 1[thin space (1/6-em)]:[thin space (1/6-em)]1 and 4[thin space (1/6-em)]:[thin space (1/6-em)]1, i.e., the pulses having duty cycles 20%, 50% and 80%, respectively, have been used.

For studying the probable interaction and shift in the characteristic vibrations as a result of binary mixings of nematogens and PIL, Perkin Elmer FTIR 1 spectrometer with 0.5 cm−1 resolution was employed. The Fourier transform infrared (FTIR) spectra of the mixtures were recorded by wetting KBr pellets with a tiny drop of the mixture.

Mettler Toledo TGA/DSC 1 having accuracy of ±0.3 K was used to study the decomposition temperatures and thermal stability of the mixtures. For studying decomposition behavior, thermogravimetric analyses (TGA) were carried out after keeping the mixtures in alumina pans under N2 atmosphere and heating them in the temperature range 30 °C to 600 °C at scanning rate of 10 °C min−1.

Results and discussion

Thermal investigations

The DSC thermograms for various binary mixtures of both the nematogens and IL under second cooling steps are shown in Fig. 1 and their thermal properties are given in Table 2. As compared with isotropic–nematic transition temperature (TIN) of pure LC1 (TIN = 41.6 °C), its mixture with IL shows remarkable decrease in TIN of LC1 (Fig. 1a). For ILLC1(50), observed decrease is 7.5 °C (in this case, TIN = 34.1 °C). DSC thermograms show that with the decrease in the composition of LC1 in various mixtures not only the onset and endset of transitions decrease but also result in the broadening of the peak (ΔT) associated with IN transition. At full width half maxima, ΔT = 1.3 °C for LC1, whereas, it is 2.9 °C in the case of ILLC1(75). This broadening can be visualized more clearly on zooming the DSC thermograms for IN transition region and is shown in the inset of Fig. 1a. It is observed that the nematic phase spreads in a much wider temperature range in their binary mixtures as compared with pure LC1.
image file: c5ra19503a-f1.tif
Fig. 1 DSC thermograms during second cooling step from 110 °C to −40 °C for various mixtures of (a) LC1 and (b) LC2 with IL and their pure constituents. Insets of the figures show enlarged views of the respective regions.
Table 2 Thermal investigation of pure LCs and their mixtures with IL for different compositions (by wt%) observed in cooling cycle of DSCa
Mixtures TCr ΔHCr TIN ΔHIN TIN-onset TIN-endset ΔTIN
a TCr: crystallization transition temperature, ΔHCr: enthalpy of crystallization, TIN: isotropic to nematic transition temperatures, ΔHIN: enthalpy of IN transition, TIN-onset and TIN-endset: onset and endset of IN transition, ΔTIN: peak width of IN transition.
LC1 −3.8 46.94 41.6 2.28 42.3 39.8 1.3
ILLC1(90) −3.7 42.16 36.9 2.89 38.5 35.2 1.7
ILLC1(80) −3.6 22.10 35.8 2.41 37.8 33.8 2.4
ILLC1(75) −5.7 29.59 35.1 2.06 36.8 32.0 2.9
ILLC1(60) −3.0 23.94 34.9 0.82 36.2 32.2 2.3
ILLC1(50) −7.2 19.44 34.1 0.49 35.0 31.5 2.0
LC2 −5.2 66.10 55.3 4.18 56.1 54.0 1.2
ILLC2(90) −3.4 58.05 36.7 2.71 43.9 32.6 8.4
ILLC2(80) −4.3 50.00 19.9 0.7 22.5 16.2 3.4
ILLC2(60) −8.6 36.53
ILLC2(50) −20.4 29.60


For cooling at temperatures below 10 °C, DSC thermograms show double crystallization peaks for LC1 and multiple crystallization peaks for its various mixtures. This double crystallization peak is due to very complex nature of LC1 i.e., 6CHBT and is reported to get influenced by thermal history (i.e. the starting temperature) and operating conditions in a DSC experiment.38,39 Witko et al.,39 have suggested that the structural interaction between 6CHBT molecules should exhibit two distinct and energetically separated modes with its peculiar temperature dependency. Later, it has also been shown that the bulk 6CHBT exhibits several energetically stable and unstable conformers with head-to-head configuration being energetically most favorable one.38 This structural complexity in the bulk 6CHBT is the main reasons for occurrence of double crystallization peaks in the DSC thermograms at temperatures below 10 °C.38 Occurrence of multiple melting and (or) crystallization peaks at lower temperature in the DSC thermograms of these mixtures may be associated with the initial melting and then re-crystallization of the melted mixtures at lower temperature during the process of thermal scanning. Our thought is based on the generalization of the earlier works describing the multiple melting phenomena in 6CHBT39 and work done by Shuren et al.,40 on nylon 1010. It describes the phenomenon of multiple melting as a continuously occurring process of melting and re-crystallization during thermal scanning of the material. Occurrence of an exothermic peak (as a valley) between two endothermic peaks during heating scan is a confirmation for re-crystallization.40

Thermal investigation of pure LC2 i.e., PCH5 shows single and sharp crystallization peak at lower temperature which gets broadened for the mixtures with smaller content of IL (Fig. 1b). As shown in the inset of Fig. 1b only one broad crystallization peak is found for ILLC2(90) and ILLC2(80) but multiple crystallization peaks occur for comparatively higher contents of IL in the mixtures. It is also interesting to note that for intermediate compositions maxima of the crystallization peak occur at temperatures slightly higher than that of pure LC2 (Fig. 1b) while a shift to lower values in the maxima of the crystallization peak is observed for relatively higher IL content in the mixtures i.e., for ILLC2(60) and ILLC2(50). Moreover, in these mixtures onset of multiple crystallization occur at temperatures slightly higher than the onset of single crystallization temperature found in pure LC2. It might be due to freezing/crystallization of pure IL at temperatures relatively higher than the crystallization temperatures of pure LC2. Findings are similar to the one observed for binary mixtures of LC1 and IL where multiple crystallization peak dominates over the double crystallization peak of pure LC1 with increasing IL content in the mixtures (Fig. 1a). Since IL shows similar crystallization behavior with both the nematogens in their mixtures at higher IL contents, multiple crystallization peaks in these mixtures may result as a combined effect of both the constituents i.e., LC and IL.

In the region of IN transition various binary mixtures of LC2 and IL show a drastic decrease in TIN for decreasing content of LC2 in their mixtures with IL (Fig. 1b). For ILLC2(90) and ILLC2(80), TIN is 36.7 °C and 19.9 °C, respectively, which is much lower than TIN = 55.3 °C for pure LC2. Moreover, like LC1, for mixtures with LC2 we find a significant increase in the range of nematic transition temperature. For pure LC2, ΔT = 1.2 °C, whereas, for ILLC2(90) and ILLC2(80) the ΔT values are 8.4 °C and 3.4 °C, respectively.

Morphological investigations

For various binary mixtures, morphological studies are made in two steps. Initially, LC droplets are studied during cooling of the mixtures (in ITO coated glass cells) from an already heated isotropic state. In the next step cells are subjected to rectangular electric pulses for studying the effect of electric field strength on the LC droplet formation and change in the LC director orientation inside these droplets.
LC droplets morphology. Results of morphological studies for various mixtures of LC1 and IL are shown in Fig. 2. For ILLC1(90), Fig. 2a shows two distinct regions with the occurrence of (i) schlieren texture in the broad nematic (i.e. an LC rich) domain and (ii) nematic droplets of different sizes in an IL rich domain. Similar observations have also been made for ILLC1(80). At lower concentrations of LC1 in the mixtures morphological investigations show only the nematic droplets (and not the broad nematic domains) distributed almost uniformly over the entire area of the cell. Sizes of these nematic droplets decrease with decrease in the concentration of LC1 in various mixtures. Fig. 2b and c show the observed decrease in the size of nematic droplets for the two mixtures ILLC1(75) and ILLC1(60) at 28 °C. A much larger decrease in the droplet size and TIN is found for ILLC1(50) (Fig. 2d). In this case, POM images show only tiny nematic droplets at comparatively much lower temperatures (∼20 °C). For all these mixtures, stable nematic droplets occur at temperatures upto ∼20 °C as observed through POM. On further cooling, slight increase in the droplet size is observed due to coalescence of smaller droplets into the larger one. Freezing of nematic droplets in IL rich domains is also observed for temperatures below 10 °C.
image file: c5ra19503a-f2.tif
Fig. 2 POM images for (a) ILLC1(90), (b) ILLC1(75), (c) ILLC1(60) at 28 °C; and for (d) ILLC1(50) at 20 °C.

The binary mixing of LC2 and IL also shows the similar behaviour. But, in this case, a large decrease in the IN transition temperatures is observed for decreasing content of LC2 in IL. Temperature dependent morphological investigations for ILLC2(90) are shown in Fig. 3. From POM, it was observed that cooling from an isotropic state at ∼50 °C, formation of tiny nematic droplets starts at ∼44 °C and it covers the entire region at ∼40 °C (Fig. 3a). Cooling of the mixtures to further lower temperature show coalescence of tiny nematic droplets into a larger one (Fig. 3b–e). Coalescence of smaller nematic droplets results in the macroscopic nematic domains with well defined schlieren textures at ∼28 °C (Fig. 3f). These observations are similar to the one discussed earlier for LC1 content above 80 wt% in IL (Fig. 2a). For both the nematogens (i.e., 6CHBT and PCH5) uniform nematic droplets with decrease in the droplet size have been observed for decreasing content of LCs below 80 wt%. Uniformity in the droplet size is maintained due to the formation of tiny droplets at temperatures just below the isotropic state. These tiny droplets get attached with the surface of the substrate (glass) where relatively strong surface anchoring prevents further coalescence among these droplets.


image file: c5ra19503a-f3.tif
Fig. 3 Evolution of the droplet morphology for ILLC2(90) at (a) 40 °C, (b) 37 °C, (c) 35 °C, (d) 34 °C, (e) 33 °C and (f) 28 °C showing the coalescence of nematic droplets in macroscopic domains.

Fig. 4 shows the POM images for two different composition of LC2 (i.e., 80% and 75%) in IL. It shows decrease in both (i) the droplet size and (ii) the temperature, where, stable and nearly uniform nematic droplets were formed with decrease in the concentration of LC2. For ILLC2(80) starting from the isotropic phase at ∼35 °C, formation of tiny nematic droplet starts at ∼32 °C. Fig. 4a shows the nematic droplets covering the entire area of the cell at 28 °C and it remains stable upto temperature ∼16 °C. At further cooling freezing of these droplets in the IL rich phase occurs with an opaque appearance at temperature below 10 °C (Fig. 4b). Change in the droplet size during heating from an already freeze state to the temperature 28 °C is shown in Fig. 4c. Similar results were also observed for ILLC2(75) with slight decrease in the droplet size with composition (Fig. 4d–f). Moreover, from the DSC investigations of ILLC2(60) and ILLC2(50), phase changes are found at much lower temperatures. In this case, any specific information about the nature of the phase transition cannot be inferred through POM due to freezing of the mixtures at an earlier temperature (∼10 °C).


image file: c5ra19503a-f4.tif
Fig. 4 POM images for ILLC2(80): (a), (b) and (c); for ILLC2(75): (d), (e) and (f). During cooling from an isotropic state to 28 °C (a) and (d); to 10 °C (b) and (e); and during heating from an already cooled state at lower temperature to 28 °C (c) and (f).
Electrical excitations of LC droplets. Morphological investigations of various binary mixtures under changing electric field strengths show that the size of the nematic droplets and LC director orientation inside the droplets can be tuned by the application of electric signals of different field strengths. Throughout the studies, rectangular electric pulses with varying amplitudes (2, 3, 4, 5, and 6 V) and three different pulse widths in the ratios 1[thin space (1/6-em)]:[thin space (1/6-em)]4, 1[thin space (1/6-em)]:[thin space (1/6-em)]1 and 4[thin space (1/6-em)]:[thin space (1/6-em)]1, i.e., the rectangular pulses having duty cycles 20%, 50% and 80%, respectively, have been used.

Fig. 5a shows the POM image obtained at room temperature for ILLC1(60) after heating it at an isotropic state and then cooling to a lower temperature in the presence of electric pulse of 3 V with 20% duty cycle. Increasing the pulse widths in the ratios 1[thin space (1/6-em)]:[thin space (1/6-em)]4, 1[thin space (1/6-em)]:[thin space (1/6-em)]1 and 4[thin space (1/6-em)]:[thin space (1/6-em)]1 show maltese type crosses with only a slight changes in the droplet morphology (Fig. 5a–c). These changes become significant when compared with the images captured after removing the field (Fig. 5d).


image file: c5ra19503a-f5.tif
Fig. 5 POM images for ILLC1(60) captured at room temperature after cooling from an isotropic state in the presence of rectangular electric pulse of 3 V with the duty cycle (a) 20%, (b) 50%, (c) 80% and (d) after removal of the field.

However, cooling of ILLC1(60) from an isotropic state to a lower temperature in the presence of electric pulse of 3 V with 50% duty cycle shows nematic droplets of much smaller size and uniform distribution as compared with the one observed for electric pulse of 3 V with 20% duty cycle (Fig. 6a). To study the effect of field strength on the LC droplet orientation, electric pulses of increasing field strengths and duty cycles in the consecutive steps of 50%, 80% and 20%, respectively, have been applied to the cell. Comparisons show that LC droplet orientation changes for both with increase in the field strength and also with change in the duty cycle. With increase in the field strength particularly for electric pulse of 5 V (with duty cycles 50% and 80%), nematics droplets of smaller size get disappeared. These nematic droplets appear again with lowering or removal of the applied electric pulses (Fig. 6g–i). It may be due to the changes occurring in IL with increasing field strength, which in turn cause the LC director orientations to change in droplets surrounded by IL as an effect of anchoring.


image file: c5ra19503a-f6.tif
Fig. 6 POM images for ILLC1(60) using electric pulses of different field strengths and duty cycles; (a) 3 V, 50%, (b) 3 V, 80%, (c) 3 V, 20%, (d) 4 V, 50%, (e) 4 V, 80%, (f) 4 V, 20%, (g) 5 V, 50%, (h) 5 V, 80%, (i) 5 V, 20%, respectively. Images are captured after cooling the mixture to room temperature from an isotropic state in the presence of rectangular electric pulse of 3 V with duty cycle 50%.

Further, increasing the field strength above 5 V dissociation of IL starts in the mixture and is observed as a change in the color of the cell before and after the application of the electric field. In this case, after removal of applied electric field, POM image shows the encapsulation of LC droplets in the dissociated IL (Fig. 7). Behavior of the mixture is re-investigated by applying electric pulses of different field strength and monitoring them though POM. Observations show significant change in the LC droplet orientation with the application of the field as compared to the one observed without field (Fig. 7 and 8). In a dissociated mixture further increase in the field strength and variation in the pulse width upto a certain limit (where the anchoring effect is suppressed) do not make significant changes in the orientation of the LC droplets. However, it affects the dissociation process of IL which appears as a change in the optical contrasts in the POM images (Fig. 8a–l). As compared with dissociated mixtures (Fig. 8), non-dissociated mixtures show that only a small change in the field strength and pulse width is sufficient to change the anchoring condition. As a result, significant changes in the droplet morphology and director orientations were observed before the dissociation of IL in the mixtures (Fig. 6).


image file: c5ra19503a-f7.tif
Fig. 7 POM images at room temperature for ILLC1(60) after removing the electric pulse of 6 V, applied earlier to the mixture.

image file: c5ra19503a-f8.tif
Fig. 8 POM images for ILLC1(60) using electric pulses of different field strengths and duty cycles; (a) 3 V, 50%, (b) 3 V, 80%, (c) 3 V, 20%, (d) 4 V, 50%, (e) 4 V, 80%, (f) 4 V, 20%, (g) 5 V, 50%, (h) 5 V, 80%, (i) 5 V, 20%, (j) 6 V, 50%, (k) 6 V, 80%, (l) 6 V, 20%, respectively. Images are captured at room temperature using the cell on which electric pulses up to 6.0 V have already been applied.

Fig. 9 shows the morphological changes observed in the binary mixtures of LC2 i.e., PCH5 and IL by varying the electric field strength and pulse width. For ILLC2(80), nematic droplets with uniformity in size, arrangement and LC director orientations are observed at 3 V. Observed morphology for electric pulses of 3 V and 50% duty cycle show uniformly distributed nematic droplets with schlieren textures which also follow a definite pattern of LC director orientations within the droplets (shown in the circled region) (Fig. 9a). In the same mixture, enhancement in the duty cycle to 80% (with electric pulse of 3 V) results in bipolar droplets having partial ordering of the LC directors within the droplets (shown in the rectangular region) (Fig. 9b). Decrease in the duty cycle to 20% show bipolar droplets with increase in droplet size due to coalescence of smaller nematic droplets into the larger one (Fig. 9c). Processes of coalescence get affected by change in the field strength because it imposes different anchoring conditions at the surface of the droplets. Fig. 9d shows LC droplets of intermediate size with uniformity in the arrangement of maltese type of crosses in ILLC2(80) when electric pulse of 4 V and 50% duty cycle is applied. When the field is removed or duty cycle is decreased, nematic droplets of comparatively smaller size get coalesced in to the larger one due to the reduced anchoring conditions (Fig. 9c and e). Further, electric pulse of 4.5 V with 80% duty cycle shows stable and uniform droplets for ILLC2(90) (Fig. 9f).


image file: c5ra19503a-f9.tif
Fig. 9 POM images (a–e) for ILLC2(80) and (f) for ILLC2(90). Electric pulses of different field strengths 3 V with duty cycle (a) 50%, (b) 80%, (c) 20% (d) 4 V with duty cycle 50%, (e) no field and (f) 4.5 V with duty cycle 80% have been used to capture the respective photographs.

Effect of varying field strengths and anchoring conditions on the LC director orientations in the region of IN phase coexistence has been discussed by Kedziora et al. for 6CHBT dissolved in benzene solution.34 It is described that in the nematic phase i.e., for temperature < TIN when applied electric field is below a critical value, it is not strong enough to turn the LC directors away from the surface of the electrode and molecules get oriented parallel to the electrode surfaces. But, when the applied field is higher than a critical value, electric field rotates the LC director in a direction perpendicular to the electrode surface. However, close to TIN a two phase region with pseudonematic domains in the form of droplets exists. In this case, nematic droplets are surrounded by the isotropic phase where surface effects become negligible. Consequently, even a weaker electric field is sufficient to rotate the LC directors inside a nematic droplet in the direction parallel to the field (i.e., perpendicular to the electrode surface). With decrease in the temperature droplets grow in size and interaction with the aligning surfaces becomes more effective which rotates the LC director in a direction parallel to the electrode surfaces.33 POM images in the present manuscript show that LC director orientation and droplet randomization is affected significantly with change in the pulse width i.e., duty cycle of the applied voltage. These effects are described in the later portion of the manuscript in the frame of Landau-de Gennes (LDG) theory.

For both the nematogens (i.e., 6CHBT and PCH5) investigation on DSC thermograms and POM images show decrease in the onset and endset of IN transitions for decreasing compositions of nematogens in the mixtures. Therefore, IN transition range (ΔT) in the mixtures can be optimized by making change in compositions of both the constituents. Noticeably, this optimization also depends on some other factors like isotropic to nematic transition temperature (TIN),41 applied fields,33 correlation lengths,34,35 long and short time-scale dynamics,35,36 etc. Nematic state in the binary mixtures of nematogens with other mesogens,14 solvents,33,34 polymers,16 etc. can be achieved either by decreasing the temperature of the mixtures below its isotropic state or by increasing the concentration of nematogenic molecules in the unit volume of the mixtures at constant temperature (but, below the clearing temperature of the nematogen).34 In such mixtures, transition go through two phase regions with boundary concentrations of nematogens at which (i) first drop of the nematic phase appears and (ii) last drop of the isotropic phase disappears. These two boundary concentrations are determined by constructing the phase diagram using DSC and POM. Transition temperatures data obtained through POM and DSC thermograms have been used frequently to construct the phase diagrams.14,16,33,34 Studies reveal that the phase diagram of IN transition viadroplet state’ (i.e., the region of coexistence of the isotropic and nematic phases) provides an appropriate information about the critical concentration of nematogens for occurrence of IN transition and observed decrease in TIN for decreasing LC concentrations in the mixtures with other materials.33,34

At temperatures slightly above but close to IN transitions orientational dynamics of LC molecules gets influenced by the local structures existing in their isotropic phase.42 Due to short-range orientational ordering of the LC molecules, pseudonematic domains are formed in the isotropic phase and their size increases as the temperature of the mesogen approaches to TIN.34 This pretransitional phenomena observed in isotropic phase of the mesogen in the vicinity of nematic phase is interpreted by the Landau-de Gennes (LDG) theory.42 The LDG theory shows that close to IN phase transition, isotropic phase is nematically ordered on a distance scale defined by intermolecular correlation length (ξ) which depends strongly on temperature and is usually few degrees below TIN.42 Correlation length (ξ) is also reported to depend on the LC concentration i.e., the number of LC molecules in the unit volume of the mixtures.34 Two experimental facts are crucial for concentration dependence of ξ; (i) domain size becomes infinite for transition to nematic phase and (ii) for a two phase regions i.e., for coexistence of IN transition domain size become finite and is observed as pseudonematic domains (i.e., droplets) through POM.34 In the region of coexistence, on a distance scale shorter than ξ, the nematogens form pseudonematic domains with local order parameter SL ≠ 0 while it is S = 0 for a macroscopically isotropic phase.36 In this case, for an applied electric pulse when field is in ON state, LC molecules experience a torque and get partially aligned (S ≠ 0) in the direction of the field. But, for an OFF state, removal of the field reestablishes S = 0 in the LC molecules which were left earlier with S ≠ 0. Restoration of S = 0 is described in two time regimes.35,36 First one is the intradomain relaxation (responsible for the short time scale dynamics) which brings the local order back to its equilibrium but leaves the local director in a direction slightly aligned with the direction of applied field. Another one is the domain randomization which restores the direction of the local directors after having in a long-lived anisotropy and is responsible for long time scale dynamics described by LDG theory.

These investigations confirm the occurrence of nematic droplets in the binary mixtures of both the nematogens (i.e., 6CHBT and PCH5) with phosphonium ionic liquid having [Ntf2] anion. It suggests that for both the nematogens, IL behaves as a less/non-interacting pseudo matrix where dispersion of LCs having a close resemblance with the common droplet morphologies observed in PDLCs becomes possible. This non-interacting and dispersive behaviour of nematogens in their mixtures with IL becomes more clear using FTIR and TGA investigations.

Dispersion studies of LC1 and LC2 in IL

The FTIR spectra and TGA thermograms for LC1, IL and their mixtures are shown in Fig. 10. Various vibrational bands observed in FTIR spectra were identified with the available data38,43–48 and are given in Table 3. Szaleniec et al., have made a detailed investigation on the molecular properties of 6CHBT using theoretical FTIR spectra and electrostatic potential distribution (ESP).38 Our experimental FTIR spectra matches nicely with their theoretical FTIR spectra. As reported for bulk 6CHBT, –N[double bond, length as m-dash]C[double bond, length as m-dash]S ligand involves various interactions including C[triple bond, length as m-dash]N stretching at 2184 cm−1, C[double bond, length as m-dash]N stretching at 2075 cm−1 and –N[double bond, length as m-dash]C[double bond, length as m-dash]S stretching at 2125 cm−1 which result in a broadened peak in the range 2000 cm−1 to 2140 cm−1 (Fig. 10). The other characteristic peaks are associated with in-plane bending of the NCS group or out-of-plane bending of the aromatic ring at 536 cm−1, out-of-plane bending of the aromatic hydrogen atoms at 828 cm−1, ring breathing C[double bond, length as m-dash]C stretching at 932 cm−1, scissor deformations of CH3 and CH2 groups at 1447 cm−1, CH2 bending at 1466 cm−1, aromatic ring stretching combined with C[double bond, length as m-dash]N stretching at 1506 cm−1 and various symmetric and asymmetric aliphatic chain stretching in the range 2850 cm−1 to 3050 cm−1. The FTIR spectra of IL i.e., [P6,6,6,14][NtF2] show the characteristic vibrations related to Ntf2 anion at 1059 cm−1, 1137 cm−1, 1195 cm−1 and 1378 cm−1 along with other vibrations related to long aliphatic chain (Table 3). Vibrations related to Ntf2 in the range 1000 cm−1 to 1400 cm−1 have not shown any change and occur only for mixtures with higher IL contents.
image file: c5ra19503a-f10.tif
Fig. 10 (a) FTIR spectra and (b) TGA thermogram for LC1, IL and their various mixtures.
Table 3 IR vibrational bands (cm−1) for various mixtures of LC1 and IL
Assignment Vibrational bands (cm−1)
LC1 ILLC1(90) ILLC1(80) ILLC1(50) IL
C–H stretching of the aliphatic chain 3033 3033 3033 3033
C–H stretching in alkyl chain 2958 2958 2958 2959 2960
Asymmetric C–H stretching in cyclohexane and CH2 groups of n-hexane 2922 2922 2924 2924 2929
C–H stretching in alkyl chains 2851 2852 2854 2855 2859
C[triple bond, length as m-dash]N stretching 2184 2184 2184 2184
C[double bond, length as m-dash]N stretching in the NCS ligand and –N[double bond, length as m-dash]C[double bond, length as m-dash]S stretching at 2125 cm−1 2000–2140 2000–2140 200–2140 2000–2140
Aromatic ring stretching combined with C[double bond, length as m-dash]N stretching 1506 1506 1506 1506
CH2 bending 1466 1467 1467 1468 1468
Scissor deformations of CH3 and CH2 groups 1447 1447 1447 1447
CH3 bending 1417 1417 1414
Ntf2 related vibrations of IL in the range 1000 cm−1 to 1400 cm−1 1378 1378 1378
1195 1195 1195 1195
1137 1137 1137
1059 1059 1059
Ring breathing C[double bond, length as m-dash]C stretching 934 934 934 934
Out-of-plane bending of the aromatic hydrogen atoms 828 828 828 828
Out of plane C–H bending 720 720 720 720
In-plane bending of the NCS group or out-of-plane bending of the aromatic ring 536 536 536 536


It is important to note from the Table 3 that the characteristic vibrations which were observed only in 6CHBT or only in [P6,6,6,14][NtF2] have not shown any significant change in their mixtures. The only exception occurs at 1414 cm−1 which is related with CH3 bending in IL molecules. However, the vibrational bands related with stretching/bending of aliphatic chains which were observed in both 6CHBT and in [P6,6,6,14][NtF2] show small shifts due to overlapping of corresponding vibrations in their mixtures. In the Fig. 10a, ILLC1(80) and ILLC1(50) show some additional vibrations below 1000 cm−1 which were not observed either in LC1 or in ILLC1(90) but they were found in IL. Absence of an appreciable shift in the characteristic vibrations of both the constituents suggests a non-interacting behaviour between LC1 and IL in their mixtures.

The TGA thermograms for pure LC1, IL and for their mixtures are shown in Fig. 10b. It shows that the decomposition temperatures for pure LC1 and IL are at ∼300 °C and ∼430 °C, respectively. Different mixtures show a two step decomposition in which weight loss associated with each step decomposition depends strongly on the composition of respective constituents. Moreover, for mixtures, both, the first and second step decompositions are observed much closer to the decomposition temperatures of pure LC1 (∼300 °C) and IL (∼430 °C). It shows that the thermal stability of both the constituents remains intact separately in their mixtures. Similar thermogravimetric observations were also found for the various mixtures of LC2 and IL with decomposition of LC2 at ∼270 °C.

Summary and conclusions

In the present work, we have observed the formation of nematic droplets at room temperature in various binary mixtures of the nematic liquid crystals, 6CHBT and PCH5, with phosphonium ionic liquid [P6,6,6,14][Ntf2]. These mixtures have been investigated using DSC, POM, FTIR and TGA techniques.

The thermal and morphological investigations on these mixtures show that for both the LCs, peak value of TIN decrease drastically as compared to pure LCs. In fact, TIN is decreased, respectively, by 7.5 °C for ILLC1(50), 18.6 °C for ILLC2(90) and 35.4 °C for ILLC2(80). Inspite of the fact that IN transition temperature range is very narrow for most of the binary mixture, POM images for various combinations show the occurrence of stable nematic droplets over a wide temperature range ∼20 °C (i.e. from ∼16 °C to ∼36 °C) with change in the composition of LCs in their mixtures. Moreover, change in the LC droplets size and director orientations inside these droplets have been observed with application of rectangular electric pulses. Thus, by tailoring the compositions of various mixtures and applied field strengths with a swift in anchoring condition, uniform nematic droplets in a desired temperature range and size can be obtained. The FTIR investigations for various binary mixtures show only a slight change in some of the vibrational bands of LC1 due to overlapping with the corresponding IL vibrations. The TGA investigation of various binary mixtures does not show significant change in the decomposition temperature of both the LCs (i.e., 6CHBT and PCH5) in [P6,6,6,14][Ntf2]. The weight loss associated with each decomposition step depends strongly on the composition of their respective constituents i.e., LCs and IL. It shows that both the constituents remain nearly immiscible in their mixtures. Thus, the FTIR and TGA analyses combined with the thermal and morphological studies for various binary mixtures confirm that both the LCs behave as a dispersed (entrapped) material in the non-interacting pseudo matrix formed by PIL having [Ntf2] anion.

In brief, dispersions of nematic droplets near room temperatures have been observed for both the 6CHBT and PCH5 in their binary mixtures with [P6,6,6,14][Ntf2]. These nematic droplets resemble much with the common droplet morphologies observed in PDLCs. Even small changes in applied electric field or pulse width have significant effects on the LC droplet size and director orientations within the droplets. It demonstrates strong potential for these kinds of mixtures along with some other mesogens and ionic solvents in PDLC based device applications with improved performance and eco-friendly behaviour.

References

  1. L. Vicari, Optical Applications of Liquid Crystals, IOP Publishing, 2003 Search PubMed.
  2. D. K. Yang and S. T. Wu, Fundamentals of Liquid Crystal Devices, John Wiley & Sons, 2006 Search PubMed.
  3. P. S. Drzaic, Liquid Crystal Dispersions, World Scientific, Singapore, 1995 Search PubMed.
  4. P. Pasini, C. Zannoni and S. Zumer, Computer Simulations of Liquid Crystals and Polymers, Nato Science Series, Kluwer Academic Publishers, Netherlands, 2003 Search PubMed.
  5. F. Simoni, Nonlinear Optical Properties of Liquid Crystals and Polymer Dispersed Liquid Crystals, World Scientific, Singapore, 1997 Search PubMed.
  6. D. A. Higgins, Probing the Mesoscopic Chemical and Physical Properties of Polymer Dispersed Liquid Crystals, Adv. Mater., 2000, 12, 251–264 CrossRef CAS.
  7. S. Singh, J. K. Srivastava and R. K. Singh, Polymer Dispersed Liquid Crystals, in Liquid Crystalline Polymers, ed. V. K. Thakur and M. R. Kessler, Springer Int. Pub., Switzerland, 2016,  DOI:10.1007/978-3-319-22894-5_7.
  8. M. M. Dzhons, S. A. Bulgakova, I. A. Pantyukhina and I. A. Kazantzeva, Effects of Chemical Structure and Composition of the Polymer Matrix on the Morphology and Electro-Optical Performance of Polymer Dispersed Liquid Crystal Films, Liq. Cryst., 2011, 38, 1263–1268 CrossRef CAS PubMed.
  9. N. H. Park, S. C. Noh, P. Nayek, M. H. Lee, M. S. Kim, L. C. Chien, J. H. Lee, B. K. Kim and S. H. Lee, Optically isotropic liquid crystal mixtures and their application to high-performance liquid crystal devices, Liq. Cryst., 2015, 4, 530–536 CrossRef PubMed.
  10. E. Perju, E. Paslaru and L. Martin, Polymer dispersed liquid crystal composites for bio-applications: thermotropic surface and optical properties, Liq. Cryst., 2015, 42, 370–382 CrossRef CAS PubMed.
  11. P. Song, Y. Gao, F. Wang, L. Zhang, H. Xie, Z. Yang and H. Yang, Studies on the electro-optical and the light scattering properties of PDLC films with the size gradient of the LC droplets, Liq. Cryst., 2015, 42, 390–396 CrossRef CAS PubMed.
  12. G. B. Hadjichristov, Y. G. Marinov and A. G. Petrov, Linear Size Gradient Single Layers of Polymer Dispersed Liquid Crystal Micrometer Sized Droplets for Diffractive Optics, Opt. Mater., 2009, 31, 1578–1585 CrossRef CAS PubMed.
  13. P. Formentin, R. Palacios, J. F. Borrull, J. Pallares and L. F. Marsal, Polymer Dispersed Liquid Crystal based on E7: Morphology and Characterization, Synth. Met., 2008, 158, 1004–1008 CrossRef CAS PubMed.
  14. S. L. Srivastava and R. Dhar, Thermodynamic study of binary mixtures of liquid crystals cholesteryl myristate and dodecyloxybenzoic acid, Mol. Cryst. Liq. Cryst., 2001, 366, 79–90 CrossRef CAS PubMed.
  15. E. R. Soule, N. M. Abukhdeir and A. D. Rey, Thermodynamics, Transition Dynamics and Texturing in Polymer Dispersed Liquid Crystals with Mesogens Exhibiting a Direct Isotropic/Smectic A Transition, Macromolecules, 2009, 42, 9486–9497 CrossRef CAS.
  16. J. K. Srivastava, R. K. Singh, R. Dhar and S. Singh, Phase Diagrams and Morphology of Polymer-Dispersed Liquid Crystals: An Analysis, Liq. Cryst., 2012, 39, 1402–1413 CrossRef CAS PubMed.
  17. J. Y. Kim, H. Y. Woo, J. W. Baek, T. W. Kim, E. A. Song, S. C. Park and D. W. Ihm, Polymer Dispersed Liquid Crystal Devices using Highly Conducting Polymers as Electrodes, Appl. Phys. Lett., 2008, 92, 183301 CrossRef PubMed.
  18. J. Zou and J. Fang, Adhesive Polymer Dispersed Liquid Crystal Films, J. Mater. Chem., 2011, 21, 9149–9153 RSC.
  19. N. Kumano, T. Seki, M. Ishii, H. Nakamura, T. Umemura and Y. Takeoka, Multicolor Polymer Dispersed Liquid Crystals, Adv. Mater., 2011, 23, 884–888 CrossRef CAS PubMed.
  20. O. Yaroshchuk and Y. Reznikov, Photoalignment of Liquid Crystals: Basics and Current Trends, J. Mater. Chem., 2012, 22, 286–300 RSC.
  21. F. Merola, S. Grilli, S. Coppola, V. Vespini, S. D. Nicola, P. Maddalena, C. Carfagna and P. Ferraro, Reversible Fragmentation and Self Assembling of Nematic Liquid Crystal Droplets on Functionalized Pyroelectric Substrates, Adv. Funct. Mater., 2012, 22, 3267–3272 CrossRef CAS PubMed.
  22. T. Kato, Self Assembly of Phase Segregated Liquid Crystal Structures, Science, 2002, 295, 2414–2418 CrossRef CAS PubMed.
  23. K. Binnemans, Ionic Liquid Crystals, Chem. Rev., 2005, 105, 4148–4204 CrossRef CAS PubMed.
  24. K. V. Axenov and S. Laschat, Thermotropic Ionic Liquid Crystals, Materials, 2011, 4, 206–259 CrossRef CAS PubMed.
  25. W. Li, J. Zhang, B. Li, M. Zhang and L. Wu, Branched Quaternary Ammonium Amphiphiles: Nematic Ionic Liquid Crystals near Room Temperature, Chem. Commun., 2009, 5269–5271 RSC.
  26. D. Cupelli, F. P. Nicoletta, S. Manfredi, M. Vivacqua, P. Formoso, G. de Filpo and G. Chidichimo, Self Adjusting Smart Windows based on Polymer Dispersed Liquid Crystals, Sol. Energy Mater. Sol. Cells, 2009, 93, 2008–2012 CrossRef CAS PubMed.
  27. F. P. Nicoletta, D. Cupelli, G. de Filpo, M. Macchione and G. Chidichimo, Quasilinear Electro Optical Response in a Polymer Dispersed Nematic Liquid Crystal, Appl. Phys. Lett., 2000, 77, 3689–3691 CrossRef CAS PubMed.
  28. D. Cupelli, F. P. Nicoletta, G. de Filpo, P. Formoso and G. Chidichimo, Reverse Mode Operation Polymer Dispersed Liquid Crystal with a Positive Dielectric Anisotropy Liquid Crystal, J. Polym. Sci., Part B: Polym. Phys., 2011, 49, 257–262 CrossRef CAS PubMed.
  29. H. Ren, S. H. Lee and S. T. Wu, Reconfigurable Liquid Crystal Droplets using a Dielectric Force, Appl. Phys. Lett., 2009, 95, 241108 CrossRef PubMed.
  30. S. K. Fan, C. P. Chiu and J. W. Lin, Electrowetting on Polymer Dispersed Liquid Crystal, Appl. Phys. Lett., 2009, 94, 164109 CrossRef PubMed.
  31. C. V. Yelamaggad, M. Mathews, U. S. Hiremath, D. S. S. Rao and S. K. Prasad, Self-organization of mesomeric–ionic hybrid heterocycles into liquid crystal phases: a new class of polar mesogens, Chem. Commun., 2005, 1552–1554 RSC.
  32. K. Goossens, P. Nockemann, K. Driesen, B. Goderis, C. G. Walrand, K. V. Hecke, L. V. Meervelt, E. Pouzet, K. Binnemans and T. Cardinaels, Imidazolium Ionic Liquid Crystals with Pendant Mesogenic Groups, Chem. Mater., 2008, 20, 157–168 CrossRef CAS.
  33. N. Tomasovicova, P. Kopcansky, M. Koneracka, L. Tomco, V. Zavisova, M. Timko, N. Eber, K. F. Csorba, T. T. Katona, A. Vajda and J. Jadzyn, The Structural Transitions in 6CHBT based Ferronematic Droplets, J. Phys.: Condens. Matter, 2008, 20, 204123 CrossRef CAS PubMed.
  34. P. Kedziora, J. Jadzyn and L. Hellemans, Dynamics of the Nonlinear Dielectric Properties of a Nematogenic Compound Dissolved in a Nonpolar Medium, Phys. Rev. E: Stat. Phys., Plasmas, Fluids, Relat. Interdiscip. Top., 2002, 66, 021709 CrossRef.
  35. J. Li, H. Cang, H. C. Andersen and M. D. Fayer, A Mode Coupling Theory Description of the Short and Long Time Dynamics of Nematogens in the Isotropic Phase, J. Chem. Phys., 2006, 124, 014902 CrossRef PubMed.
  36. J. Li, I. Wang and M. D. Fayer, Three Homeotropically Aligned Nematic Liquid Crystals: Comparison of Ultrafast to Slow Time Scale Dynamics, J. Chem. Phys., 2006, 124, 044906 CrossRef PubMed.
  37. S. Ueda, J. Kagimoto, T. Ichikawa, T. Kato and H. Ohno, Anisotropic Proton Conductive Materials formed by the Self Organization of Phosphonium type Zwitterions, Adv. Mater., 2011, 23, 3071–3074 CrossRef CAS PubMed.
  38. M. Szaleniec, R. T. Sobieraj and W. Witko, Theoretical Study of 1-(4-hecylclohexyl)-4-isothiocyanatobenzene: Molecular Properties and Spectral Characteristics, J. Mol. Model., 2009, 15, 935–943 CrossRef CAS PubMed.
  39. W. Witko, A. M. Padol and P. M. Zielinski, Multiple melting phenomena in low mass mesogenic compound, Phase Transitions, 2007, 80, 717–724 CrossRef CAS PubMed.
  40. F. U. Shuren and C. Taoyung, Multiple melting in Nylon 1010, Polym. Commun., 1983, 2, 145–151 Search PubMed.
  41. P. Kopcansky, M. Koneracka, M. Timko, I. Potocova, L. Tomco, N. Tomasovicova, V. Zavisova and J. Jadzyn, The structural transitions in ferronematics and ferronematic droplets, J. Magn. Magn. Mater., 2006, 300, 75–78 CrossRef CAS PubMed.
  42. P. G. de Gennes, Physics of Liquid Crystals, Oxford University Press, Oxford, 1974 Search PubMed.
  43. D. S. Jacob, S. Makhluf, I. Brukental, R. Lavi, L. A. Solovyov, I. Felner, I. Nowik, R. Persky, H. E. Gottlieb and A. Gedanken, Sonochemical Synthesis and Characterization of Ni(C4H6N2)6(PF6)2, Fe(C4H6N2)6(BF4)2 and Ni(C4H6N2)6(BF4)2 in 1-butyl-3-methylimidazole with hexafluorophosphate and tetrafluoroborate, Eur. J. Inorg. Chem., 2005, 2669–2677 CrossRef CAS PubMed.
  44. R. Verma, R. Dhar, M. C. Rath, S. K. Sarkar, V. K. Wadhawan, R. Dabrowski and M. B. Tykarska, Optimization of the Display Parameters of a Room Temperature Nematic Material (6CHBT) by using Electron Beam Irradiation, J. Disp. Technol., 2010, 6, 8–13 CrossRef CAS.
  45. M. P. Singh, R. K. Singh and S. Chandra, Studies on Imidazolium based Ionic Liquids having a Large Anion Confined in a Nanoporous Silica Gel Matrix, J. Phys. Chem. B, 2011, 115, 7505–7514 CrossRef CAS PubMed.
  46. Y. Mochizuki and K. Sugawara, Removal of Organic Sulfur from Hydrocarbon Resources using Ionic Liquids, Energy Fuels, 2008, 22, 3303–3307 CrossRef CAS.
  47. J. C. Lassegues, J. Grondin, D. Cavagnat and P. Johansson, New Interpretation of CH Stretching Vibrations in Imidazolium Based Ionic Liquids, J. Phys. Chem. A, 2009, 113, 6419–6421 CrossRef CAS PubMed.
  48. S. B. Dhiman, G. S. Goff, W. Runde and J. A. Laverne, Gamma and heavy ion radiolysis of ionic liquids: a comparative study, J. Nucl. Mater., 2014, 453, 182–187 CrossRef CAS PubMed.

This journal is © The Royal Society of Chemistry 2015