DOI:
10.1039/C5RA19442C
(Paper)
RSC Adv., 2015,
5, 88848-88856
Highly active spherical amorphous MoS2: facile synthesis and application in photocatalytic degradation of rose bengal dye and hydrogenation of nitroarenes†
Received
21st September 2015
, Accepted 12th October 2015
First published on 13th October 2015
Abstract
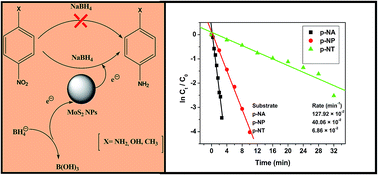
Herein, we developed a facile method to prepare amorphous spherical MoS2 via a simple solvothermal decomposition of a precursor complex MoO2(acda)2 (Hacda = 2-aminocyclopentene-1-dithiocarboxylic acid) in the presence of triethylenetetramine (TETA) as a solvent at 200 °C in an inert atmosphere. The as-obtained product was characterized by X-ray diffraction analysis (XRD), electron diffraction X-ray spectroscopy (EDX), transmission electron microscopy (TEM), and UV-vis spectroscopic techniques. The transmission electron microscopic study ascertains the amorphous particles to be of spherical structure. The amorphous MoS2 has shown photocatalytic activity for the degradation of rose bengal (RB) dye under visible light illumination. The kinetics of the decomposition process was also investigated and found to show the pseudo-first-order reaction kinetics with rate constants of 5.0 × 10⁻² min−1. Furthermore, amorphous MoS2 was found to be highly effective in catalyzing the reduction of a series of nitroarenes to the corresponding anilines by an eco-friendly protocol.
1. Introduction
With increasing demand for p-aminophenol, with versatile uses as ubiquitous raw materials or intermediates for the manufacture of agrochemicals, dyes, drugs, polymers, rubbers and different natural products, the reduction of p-nitrophenol1–9 has drawn extensive attention in recent years. Silver, gold, platinum and palladium metal NPs or metal nanocomposites10–12 are known to be typical catalysts applied in the catalytic hydrogenation of p-nitrophenol. Although the catalytic performances of these catalysts are relatively satisfactory, there is a need to limit the use of such very expensive catalysts. It is thus desirable to move away from rare elements and catalyze the reaction through cheap, earth-abundant materials. This challenge has led to the exploration of molybdenum sulfides as catalysts for the hydrogenation of p-nitrophenol. Moreover, preparation of MoS2 are of considerable attention for its potential applications in many areas as catalysis,13 potential hydrogen storage media,14 electrode materials for Mg2+ ion and Li+ ion batteries,15,16 solid super lubricants,17,18 superconductors,19,20 and photo-electrochemical solar cells,21,22 hydrogen evolution reaction. In contrast no such reports are concerned on the catalytic behaviour of amorphous MoS2 for the decomposition of organic pollutants like dyes23–29 and for the catalytic reduction of nitro groups to amino groups. Now a days, the synthesis of amorphous MoS2 is a great challenge due to its high performances mainly due to high surface area and large concentration of lattice defects in the amorphous structures. Therefore a simple, cost-effective method for the synthesis of amorphous MoS2 is essential to explore the different catalytic activities. Despite all other various solution-phase synthetic strategies, the thermo decomposition of a single-source precursor (SSP) method may be useful, since it has been proven facile and valid in obtaining a variety of metal chalcogenide NPs with the characteristics of single crystallites, pure phases, definite stoichiometries and monodispersities. O'Brien pioneered this facile synthetic process and first obtained different chalcogenides30–33 viz. sulphides and selenides by using SSP. Furthermore, Vittal and co-workers extended this method successfully for preparing various metal chalcogenides34–37 using the SSP compounds.
In this study, spherical amorphous MoS2 is prepared solvothermally from a mononuclear single source precursor complex MoO2(acda)2. We demonstrate here that amorphous MoS2 exhibits efficient photocatalytic property towards degradation of RB dye. In order to confirm that the hydroxyl radicals (˙OH) cause the photodegradation, we perform the photoluminescence study of terephthalic acid (TA) in presence of amorphous MoS2. We also demonstrate for the first time the catalytic activity of MoS2 towards the reduction of aromatic nitro compounds to the corresponding amino compounds in presence of NaBH4.
2. Experimental
2.1. Chemicals and materials
All the solvents and materials were of analytical grade and used without further purification. Ammonia (NH3), carbon disulfide (CS2), cyclopentanone, hydrochloric acid, ammonium molybdate, acetylacetone, rose bengal (RB), terephthalic acid (TA), p-nitrophenol (p-NP), p-nitrotoluene (p-NT), p-nitroaniline (p-NA), p-aminophenol (p-AP), triethylenetetramine (TETA) were purchased from Sigma-Aldrich. Nano-sized titanium dioxide (TiO2) (Degussa-P25) was purchased from Degussa Company.
2.2. Synthesis
The ligand, 2-aminocyclopentene-1-dithiocarboxylic acid (Hacda) has already been synthesized according to the previously reported method.38 The precursor complex, MoO2(acda)2 was prepared according to the prescribed method.39
2.3. Synthesis of the amorphous MoS2
The synthesis of amorphous MoS2 was carried out through a solvothermal decomposition of synthesized precursor complex using nucleophilic solvent TETA. The precursor complex MoO2(acda)2 (200 mg) was dissolved in 4 mL TETA and transferred into a 10 mL round bottom flask. The reaction mixture was then heated for 1.5 h at 200 °C in an inert atmosphere. The black particles, that deposited, was collected by centrifugation, washed several times with methanol and finally dried in air.
2.4. Physical measurements
Electronic absorption spectra were investigated on a JASCO V-530 spectrophotometer. Powder X-ray diffraction (XRD) pattern was obtained on a Philips PW 1140 parallel beam X-ray diffractometer with Bragg–Brentano focusing geometry and monochromatic Cu Kα radiation (λ = 1.540598 Å). TEM measurements were made on a JEOL JEM-2100 microscope using an accelerating voltage of 200 kV. EDX analysis was carried out by using Hitachi S-3400 N (EDX, Horiba EMAX) instrument. Photoluminescence spectra were recorded using a Photon Technology International (LPS-220B). The BET (Brunauer–Emmett–teller) surface area of the samples were analysed on Quantachrome Autosorb-1 instrument.
2.5. Photocatalytic activity test
The photocatalytic activity of prepared amorphous MoS2 was evaluated by examining the photodegradation of RB dye. The experiments were carried out in a round bottom flask kept in a thermostatted bath at 25 °C and the light source used in the measurements was an incandescent tungsten halogen lamp (200 W), placed vertically on the reaction vessel at a distance of ∼10 cm. The catalytic experiments were separately carried out with 40 mL aqueous solution of RB (1 × 10⁻⁵ M) using 20 mg of the catalyst (amorphous MoS2). During irradiation, 3 mL aliquot was withdrawn at a specific time intervals and centrifuged. The clear solutions of the dye were measured on a UV-vis spectrophotometer in the range 450–600 nm. Commercial photocatalyst TiO2 was also used as the reference to compare the photo-catalytic activity under the same experimental conditions.
To find out the active species behind the degradation process, this reaction was carried out in nitrogen and open air atmosphere separately. Finally, in order to detect whether the photodegradation of RB by MoS2 occurs through the generation of hydroxyl radical or not, the photoluminescence study of terephthalic acid (TA) was carried out in presence of catalyst. In this case, 40 mL aqueous solution of sodium terephthalate (2 × 10⁻³ M) containing 20 mg of MoS2 was irradiated with light for a given period of time. An aliquot (3 mL) of the solution was withdrawn from the solution mixture and centrifuged and its luminescence spectrum was recorded between 350 and 600 nm using 315 nm as the excitation wavelength.
2.6. Reduction of nitro-arenes using NaBH4 in the presence of amorphous MoS2
The reduction of p-NP by NaBH4 was studied as a model reaction to check out the catalytic activity of amorphous MoS2 for heterogeneous systems. Under the experimental condition (25 °C), the reduction does not step forward at all with NaBH4 only. However in the presence of MoS2 it goes to completion to produce p-AP within a very short time. In a quartz cuvette, an aliquot of 25 μL of p-NP stock solution (1 × 10⁻² M) was added to a solution of 2.5 mL of 0.1 M NaBH4. At this step, the p-nitrophenol was converted to nitrophenolate anion (λmax = 400 nm). Then after the addition of catalyst, UV-vis spectra of the sample were recorded in every 2 min interval in the range of 200–500 nm. The rate constant of the reduction process was determined by measuring the change in absorbance of the initially observed peak at 400 nm as a function of time. In a similar way, the study was carried out by varying the initial concentrations of p-NP in the range 0.6–1.4 × 10⁻⁴ M keeping constant the catalyst dose at 0.4 g L−1 and borohydride concentration at 0.1 M to standardize the initial concentration of p-NP. The effect of borohydride concentration was also studied in the range of 0.02–0.1 M, at fixed initial p-NP concentration at 1 × 10⁻⁴ M and catalyst dose at 0.4 g L−1. While studying the effect of catalyst dose, the catalyst concentration was varied in the range of 0.2–1.0 g L−1, keeping unaltered the final concentration of p-NP at 1.0 × 10⁻⁴ M and NaBH4 at 0.1 M. These similar reactions were also performed for p-nitroaniline (p-NA) and p-nitrotoluene (p-NT) to understand the substituent's effect on the catalytic reduction.
3. Results and discussion
3.1. Synthesis and characterization of amorphous MoS2
The MoS2 amorphous sphere was synthesized by solvothermal route by decomposition of the precursor complex MoO2(acda)2 in the presence TETA as nucleophilic solvent at 200 °C for 1.5 h at inert atmosphere (Scheme 1).
 |
| Scheme 1 Schematic representation of formation of amorphous MoS2. | |
To confirm the formation of amorphous MoS2 and to asses it's crystalline phase, X-ray diffractogram was recorded. The corresponding powder X-ray diffraction (XRD) pattern (Fig. 1) indicated that the as-synthesized MoS2 particles were amorphous40,41 as no signals of crystalline diffraction peaks were present in XRD peak (A). After annealed the samples at temperature 700 °C, the particles began to crystallize (XRD peak (B)), revealing the formation of crystalline molybdenite-3R type MoS2 (JCPDS card no. 17-0744). As seen from the XRD pattern, the peaks centred at 2θ values of 33.48, 34.63, 38.09, 39.39, and 58.70 correspond to reflections from (101), (012), (104), (110) crystal planes of the molybdenite-3R MoS2 respectively, and all these diffraction peaks can be indexed as rhombohedra phase of MoS2 (JCPDS card no. 17-0744). The lattice constants of MoS2 calculated from XRD patterns are a = b = 3.16 and c = 18.33.
 |
| Fig. 1 Powder XRD patterns for amorphous MoS2 as-synthesized (A) and after annealing under Ar at 700 °C for 2 h (B). | |
The composition of amorphous MoS2 was confirmed by the EDX elemental analysis which is shown in Fig. S1† and supported that the nanocrystal was composed of Mo and S with the ratio 1
:
2. To provide additional insight into the structure of the as prepared nanomaterials, TEM analysis was carried out. Typical TEM image in Fig. 2(a) illustrates that the amorphous MoS2 are spherical in morphology approximately with an average diameters of 606.55 nm. Besides, the HRTEM image (Fig. 2(b)) also shows an amorphous nature because of absence of discernible lattice fringe.41 Moreover, high-resolution TEM (HRTEM) images (Fig. 2(c)) showed no evidence of crystallinity, suggesting that the particles were amorphous. Consistently, the selected area electron diffraction (SAED) pattern (Fig. 2(c)) showed only diffuse rings which strongly support the amorphous nature of the as synthesized MoS2 particles.40 Detailed information from Fig. 2(d) revealed that spherical nano-sphere possess a range of size of ∼416.78–629.34 nm. In conclusion, the amorphous nature obtained from XRD data is strongly supported by TEM images.
 |
| Fig. 2 (a) TEM image, (b) HRTEM image, (c) SAED pattern (d) large area of TEM image and (e) particle size distribution of the as-synthesized amorphous MoS2 nanoparticles. | |
3.2. Optical properties
A typical optical property of amorphous MoS2 was investigated by the UV-vis spectroscopic technique and is shown in Fig. 3(a). The room temperature absorption spectrum was recorded by dispersing the sample in toluene. In solution, the first prominent absorption peak at 415 nm wavelength, which is attributed to transitions involving the direct band gap and the second absorption shoulder was seen at 596 nm, which is corresponds to the indirect band gap of MoS2 amorphous sphere. The presence of both direct and indirect bandgap simultaneously in a same material was also reported42 earlier. Generally, the Tauc plot is used to determine the bandgap of semiconductor materials using the Tauc's relation [(αhν)1/n = A(hν − Eg)], where, hν is the incident photon energy, ‘A’ is a constant and ‘n’ is the exponent, the value of which is determined by the type of electronic transition causing the absorption and can take the values 1/2 or 2 depending upon whether the transition is direct or indirect. The direct bandgap of MoS2 amorphous sphere is 2.25 eV (Fig. 3(b)), suggesting that MoS2 amorphous sphere is a direct bandgap material. Moreover, Fig. 3(c) shows that MoS2 amorphous sphere also contains a significant amount of indirect bandgap (1.41 eV) structure, as the TM plot for indirect bandgap also presents linear sections in that photon energy range.
 |
| Fig. 3 (a) UV-vis absorption spectra of amorphous MoS2. Tauc_Mott plot for (b) direct and (c) indirect bandgap of nanoparticles. The intercept of a solid line with the horizontal axis defines the value of the bandgap. | |
The presence of both direct and indirect bandgap simultaneously in the same particles having smaller indirect bandgap than the direct bandgap causes the better use as efficient catalyst for catalytic reactions under solar light irradiation, provided enough phonons (lattice vibrations) are available to assist the indirect electron transition from the valence band (VB) to the conduction band (CB).
The N2 adsorption–desorption isotherms analysis (Fig. S2†) provides further detailed information about the specific surface area of the catalyst. The specific surface area of this sample was calculated to be 32.63 m2 g−1 by the BET equation. The large surface area of MoS2 amorphous sphere is expected to accelerate the photocatalytic reaction by providing more active sites and promoting the separation efficiency of photocarriers.
3.3. Photocatalytic activity of amorphous MoS2
To establish the potentiality of the prepared materials as photocatalyst, the catalytic performances of amorphous MoS2 was examined by the photodegradation of RB subjecting to light irradiation as followed by spectrophotometric monitoring. In this regard, RB has drawn great attention as it is a fluorescent dye and commonly used in textile, photographic and photochemical industries.
This photodegradation was studied by monitoring the time dependent UV-vis spectral changes of RB solution in the presence of amorphous MoS2 under the irradiation. The characteristic peak at 540 nm gradually decreases with irradiation time and disappears completely after 75 min suggesting the complete photodegradation (Fig. S3†). The high potent photocatalytic activity of amorphous MoS2 became evident only when a comparative experiment was carried out with TiO2 (Degussa-P25). The comparative studies were made using the RB solution (1 × 10⁻⁵ M) in the following way: (i) without catalyst in dark, (ii) without catalyst in light, (iii) TiO2 in light. (iv) Amorphous MoS2 in light. The experimental results are expressed by the change in relative concentration of RB with irradiation time and are shown in Fig. 4. Under these conditions (i) and (ii), the degradations of RB are insignificant within the test period suggesting the photodegradation of RB is negligible which ensures that, in the absence of catalyst, the self-degradation of all the dyes are almost negligible. A little change is observed for condition (iii) i.e., using TiO2 as the catalyst. Finally, in presence of amorphous MoS2 the degradation of RB under visible light irradiation becomes very distinct. The reaction rates for the photocatalytic decomposition of RB were determined using the pseudo-first order reaction kinetics. The reaction rate constant is obtained from the ln(C0/Ct) vs. t plot (inset Fig. 4) and is found to be 5.0 × 10⁻² min−1. Furthermore, the stability of this particle is established by reusing this amorphous MoS2 for successive four times (Fig. S4†).
 |
| Fig. 4 Time dependent UV-vis spectral changes of aqueous solution of RB by amorphous MoS2 under different conditions (i) without catalyst in dark, (ii) without catalyst in light, (iii) commercial TiO2 in light, (iv) amorphous MoS2 in light. Inset: kinetic plots for the photodegradation of RB catalyzed by amorphous MoS2. | |
3.4. Mechanistic studies
To identify the reactive intermediate and the perfect atmosphere for the photo-degradation process, this photocatalysis was carried out under pure nitrogen and in open air atmosphere separately.43 Fig. 5 indicates that in nitrogen atmosphere the rate of degradation is slower than in open air. The photoinduced holes react with surface-bound H2O and produce the OH˙ radical species that are extremely strong oxidant for the mineralization of organic dyes. Meanwhile, the electrons that are formed can react with the adsorbed molecular oxygen to yield O2˙ which combine with H+ to produce HO2˙ (ref. 44) which can further react with the trapped electrons to generate OH˙ radicals.45 So the presence of oxygen accelerates the OH˙ radical mediated photocatalysis and in our case the rate of reaction became double in presence of oxygen (Table 1). In addition, the presence of ˙OH radical as reactive species was further confirmed through a well known photoluminescence technique using terephthalic acid (TA) as a probe. In this process, a strong fluorescent molecule 2-hydroxyterephthalic acid (HTA) is generated by the capture of ˙OH by terephthalic acid.46–52 The detection process has been carried out through photoluminescence study (Fig. 6) of sodium terephthalate solution in presence of amorphous MoS2. A gradual increase in emission intensity at 425 nm is observed with increasing the irradiation time, which indicates the generation of hydroxyl radicals and the probable mechanism is as follows. |
MoS2 + visible light → MoS2 (ecb− + hvb+)
| (1) |
|
MoS2 (hvb+) + H2O → H+ + ˙OH
| (2) |
|
MoS2 (ecb−) + O2ads → O2˙−
| (3) |
|
2ecb− + H+ + ˙OH2 → ˙OH + OH−
| (5) |
|
MoS2 (hvb+) + HO− → ˙OH
| (6) |
|
Organic pollutants + ˙OH → degradation products
| (7) |
 |
| Fig. 5 Degradation of RB under visible light (450–600) in the presence of amorphous MoS2 under open air, and nitrogen atmosphere. Inset: kinetic plots for the photodegradation of RB catalyzed by amorphous MoS2 in open air and nitrogen atmosphere. | |
Table 1 Rate of degradation of rose bengal in different atmosphere
Dye |
Atmosphere |
Rate of degradation |
Rose bengal |
Open air |
5.0 × 10⁻² |
N2 atmosphere |
2.5 × 10⁻² |
 |
| Fig. 6 Photoluminescence spectral changes of terephthalic acid solution in presence of MoS2. | |
3.5. Catalytic reduction of p-nitrophenol
The catalytic activity of as-prepared amorphous particles was further extended towards the reduction of p-NP and its derivatives by NaBH4 which was monitored spectrophotometrically in aqueous medium. The red shift of the peak has been observed from 317 to 400 nm occurred immediately after the addition of NaBH4 due to the formation of p-nitrophenolate ion53 in alkaline condition. Though this reduction is thermodynamically feasible due to favourable potential differences (E0 for p-NP/p-AP = −0.76 V and H3BO3/BO4− = −1.33 V vs. NHE), the peak at 400 nm remain unaltered even for a couple of days in the absence of any catalyst probably due to kinetic inertness. After the addition of amorphous MoS2, the intensity of yellow colour of the p-nitrophenolate ion (λmax = 400 nm) immediately starts to decrease due to catalytic reduction by relaying electrons from the donor BH4− to the acceptor p-nitrophenolate ion via amorphous MoS2 right after the adsorption of both onto the nanoparticle surfaces. In this kind of reaction, the nanoparticles act as the primary active species to catalyze the reactions by facilitating the transfer of electrons from BH4− to the reactants (Scheme 2), thus leading to the effective reduction of the nitro group. This decolouration was quantitatively monitored spectrophotometrically with time (Fig. 7) and this time dependent study has been noted by a successive decrease of the peak height at 400 nm with the simultaneous appearance of a new peak at 293 nm (UV spectrum of an authentic sample of p-AP) which can be assigned due to formation of p-AP. The isosbestic point54 between the two peaks is also observed, indicating that the two principal species are responsible for this conversion. Here the NaBH4 was used in large excess to maintain the pH of the solution and to prevent the aerial oxidation of p-AP. This reduction showed pseudo first order kinetics (Fig. 8) with respect to p-NP or p-AP concentration as the initial concentration of NaBH4 was 1000 times higher than p-NP.
 |
| Scheme 2 Schematic representation of reduction of nitroarenes in presence of amorphous MoS2. | |
 |
| Fig. 7 Time dependent absorption spectra for the catalytic reduction of p-NP by NaBH4 in presence of amorphous MoS2 [conditions: [p-NP] = 1.0 × 10⁻⁴ M; [catalyst] = 0.4 g L−1; [NaBH4] = 0.1 M]. | |
 |
| Fig. 8 Concentration vs. time plot for p-NP reduction using amorphous MoS2. Inset. Kinetic plot for the reduction process of p-NP catalyzed by amorphous MoS2. Ct indicates the concentrations of substrates at time t and C0 is the initial concentrations of the substrates. | |
To investigate the kinetic study clearly, we have chosen the peak at 400 nm because the rate of decrease of absorbance reflects more significantly comparing with the rate of increase of absorbance of new peak at 293 nm.
The effect of the different external parameters like-NaBH4 concentration, p-NP concentration, catalyst dose and reaction temperature on the rate of reaction was investigated thoroughly in a systematic manner. In order to examine the effect of NaBH4 concentration on the reduction rate of the p-NP, we have varied the concentration of NaBH4 from 0.02–0.1 M. As depicted in Fig. 9, that in the concentration range of borohydride 0.02–0.05 M, the rate is increased with the increase in BH4− concentration, and in the range of 0.05–0.1 M it remained constant. Thus, the borohydride concentration selected for our entire study was 0.1 M, which is large excess compared to that of p-NP, to make the reaction independent (zero-order) of borohydride concentration. The liberated hydrogen from BH4− prevented the aerial oxidation of p-aminophenol.
 |
| Fig. 9 Effect of NaBH4 concentration on catalytic reduction of p-NP in the presence of amorphous MoS2 conditions: [p-NP] = 1.0 × 10⁻⁴ M; [MoS2] = 0.4 g L−1; temperature = 298 K. | |
To evaluate the final concentration of p-NP, the reaction was studied with various initial concentrations (range 0.4–1.4 × 10⁻⁴ M), and the pseudo-first order reaction rate constants (k) were compared. The rate constants should depend on the initial concentrations of p-NP, as the rate of reaction is independent on the concentration of NaBH4. This dependency has been reflected in the Fig. 10, showing the rate of reduction using amorphous MoS2 maintaining the other parameters such as catalyst dose and borohydride concentration remained constant.
 |
| Fig. 10 Effect of p-NP concentration on catalytic reduction of p-NP in the presence of amorphous MoS2 conditions: [BH4−] = 0.1 M; [MoS2] = 0.4 g L−1; temperature = 298 K. | |
To observe the effect of catalyst dose, we carried out this hydrogenation by altering the amount of catalyst (0.2–1.0 mg), keeping the other parameters constant. There is a linear relationship between the reaction rate and the catalyst concentration (Fig. 11) which is the characteristic of heterogeneous catalysis.55–57
 |
| Fig. 11 Effect of catalyst concentration on catalytic reduction of p-NP in the presence of amorphous MoS2 conditions: [p-NP] = 1.0 × 10⁻⁴ M; [BH4−] = 0.1 M; temperature = 298 K. | |
To examine the dependency of catalytic reduction rate on temperature, this reaction was studied at four different temperatures 298, 308, 318, and 328 K under the following conditions, [BH4−] = 0.1 M, [p-NP] = 1 × 10⁻⁴ M, and [catalyst] = 0.4 g L−1. The value of rate constant (k) increases with the increase in temperature (Fig. 12). The activation energy was finally calculated from the slope of the straight line using the Arrhenius equation (k = Ae−Ea/RT) and is found to be 5.14 kcal mol−1 for the amorphous MoS2 catalyzed p-NP reduction lies within the surface catalyzed reactions (2–10 kcal mol−1).
 |
| Fig. 12 Effect of temperature on catalytic reduction of p-NP in the presence of MoS2. Conditions: [p-NP] = 1.0 × 10⁻⁴ M; [BH4−] = 0.1 M; [MoS2] = 0.4 g L−1. | |
To measure the efficiency of a catalyst, the turnover number (TON) and the turnover frequency (TOF) are two important parameters. In heterogeneous catalysis, the number of reactant molecules that 1 g of catalyst can convert into products is called TON and the TOF is simply TON/time. To evaluate the TON and TOF for MoS2 first we calculate the percentage of the yield (Fig. S5†) of this reduction and finally, for amorphous MoS2 as the catalysts, using 1.0 × 10⁻⁴ M concentration of p-NP and 0.4 g L−1 catalyst dose, the TOF was found to be 6.7 × 10¹⁷ mol−1 g−1 s−1 which is 20 times higher than literature.9
3.6. Substitution effect
To understand the effect of substituents to this reduction, a formal kinetic analysis of a series of X substituted nitroarenes [X = HO, Me and NH2] were performed (Fig. 8, S6 and S7†). Considering that the concentration of catalyst remains constant at initial time and assuming a pseudo-first order dependence of the reaction rate on the nitroarene concentration, eqn (8) can be applied.where, k is the rate constant and x is the consumption of the X substituted nitroarene at reaction time t.
It has been observed worth noting that the kinetic activity nitroarenes is remarkably affected by the nature of the X substituent group, in which the reduction proceeds faster as the electron-donating ability of the substituent group improves. The donating ability of the mentioned substituents are as NH2 > OH > CH3. Fig. 13 shows the comparative rate of reduction of nitroarenes which is p-NA > p-NP > p-NT and is also comparable with the literature.58 The respective pseudo-first-order reaction rate constants were calculated to be 127.92 × 10⁻², 40.06 × 10⁻² and 6.86 × 10⁻² min−1 (Table 2).
 |
| Fig. 13 Time-dependent conversion plots for the reduction of nitroarenes by amorphous MoS2. | |
Table 2 Reduction of various nitroarenes using amorphous MoS2
Different nitro compounds |
Time |
Rate |
p-Nitrotoluene |
32 min |
6.86 × 10⁻² |
p-Nitrophenol |
10 min |
40.06 × 10⁻² |
p-Nitroaniline |
2 min 40 s |
127.92 × 10⁻² |
4. Conclusion
In conclusion, amorphous spherical MoS2 has been successfully prepared from a mononuclear Mo(VI) precursor complex MoO2(acda)2 by a simple solvothermal method. Here, we have reported that the amorphous MoS2 could be a promising material for photocatalysis under natural solar light irradiation. It should also be pointed out that the MoS2 photocatalysts are cost saving and recyclable photocatalysts that exhibit high photocatalytic efficiency (up to 96%) to decompose the RB. Moreover, the excellence of the as-prepared MoS2 catalyst for reduction of nitroarenes to the aniline compounds by excess NaBH4 has been evaluated. Considering all the experimental results, the MoS2 may be potentially effective as catalyst for the waste water treatment, and also towards the reduction of the nitroarenes. To the best of our knowledge, it is the first report on the reduction of a series of nitroarenes using such a cheap amorphous MoS2 as a catalyst and also exerts the high TOF value for the p-NP reduction. Significantly, we reveal a single-step, one-pot, and eco-friendly reduction of nitroarenes to corresponding aminoarenes by NaBH4 catalyzed by amorphous MoS2, which may opens up its potential application in the design of various industrially important catalysts.
Acknowledgements
Authors are thankful to Prof. K. Nag, Department of Inorganic Chemistry, IACS, Kolkata, India, for helpful discussion. N. S is indebted to DST_INSPIRE, India, for his JRF [IF-130593]. The authors also acknowledge to DST-project (Scheme No. SB/S1/IC-33/2013) for funding and also MHRD (India) for providing instrumental facilities to the Department of Chemistry, IIEST.
References
- S. Cai, H. Duan, H. Rong, D. Wang, L. Li, W. He and Y. Li, ACS Catal., 2013, 3, 608–612 CrossRef CAS
. - S. Fountoulaki, V. Daikopoulou, P. L. Gkizis, I. Tamiolakis, G. S. Armatas and I. N. Lykakis, ACS Catal., 2014, 4, 3504–3511 CrossRef CAS
. - S. Wunder, F. Polzer, Y. Lu, Y. Mei and M. Ballauff, J. Phys. Chem. C, 2010, 114, 8814–8820 CAS
. - Z. D. Pozun, S. E. Rodenbusch, E. Keller, K. Tran, W. Tang, K. J. Stevenson and G. Henkelman, J. Phys. Chem. C, 2013, 117, 7598–7604 CAS
. - E. Seo, J. Kim, Y. Hong, Y. S. Kim, D. Lee and B. S. Kim, J. Phys. Chem. C, 2013, 117, 11686–11693 CAS
. - J. Yang, X. Wang, X. Zhao, J. Dai and S. Mo, J. Phys. Chem. C, 2015, 119, 3068–3078 CAS
. - A. Gangula, R. Podila, R. M., L. Karanam, C. Janardhana and A. M. Rao, Langmuir, 2011, 27, 15268–15274 CrossRef PubMed
. - K. Bera, S. Baksi, M. Nag, S. C. Bera, D. Mukhopadhyay and S. Basak, New J. Chem., 2014, 38, 2739–2743 RSC
. - K. Esumi, R. Isono and T. Yoshimura, Langmuir, 2004, 20, 237–243 CrossRef CAS
. - S. Saha, A. Pal, S. Kundu, S. Basu and T. Pal, Langmuir, 2010, 26(4), 2885–2893 CrossRef CAS PubMed
. - Y. Choi, H. S. Bae, E. Seo, S. Jang, K. H. Park and B. S. Kim, J. Mater. Chem., 2011, 21, 15431–15436 RSC
. - J. Pal, C. Mondal, A. K. Sasmal, M. Ganguly, Y. Negishi and T. Pal, ACS Appl. Mater. Interfaces, 2014, 6, 9173–9184 CAS
. - J. Chen, S. L. Li, Q. Xu and K. Tanaka, Chem. Commun., 2002, 1722–1723 RSC
. - J. Chen, N. Kuriyama, H. T. Yuan, H. T. Takeshita and T. Sakai, J. Am. Chem. Soc., 2001, 123, 11813–11814 CrossRef CAS
. - X. L. Li and Y. D. Li, J. Phys. Chem. B, 2004, 108, 13893–13900 CrossRef CAS
. - Q. Wang and J. H. Li, J. Phys. Chem. C, 2007, 111, 1675–1682 CAS
. - L. Rapoport, Y. Bilik, Y. Feldman, M. Homyonfer, S. R. Cohen and R. Tenne, Nature, 1997, 387, 791–793 CrossRef CAS
. - W. X. Chen, J. P. Tu, Z. D. Xu, R. Tenne, R. Rosenstveig, W. L. Chen and H. Y. Gan, Adv. Eng. Mater., 2002, 4, 686–690 CrossRef CAS
. - J. T. Ye, Y. J. Zhang, M. Yoshida, Y. Saito and Y. Iwasa, J. Supercond. Novel Magn., 2014, 27, 981–985 CrossRef CAS
. - J. T. Ye, Y. J. Zhang, R. Akashi, M. S. Bahramy, R. Arita and Y. Iwasa, Science, 2012, 338, 1193–1196 CrossRef CAS PubMed
. - H. Tributsch and J. C. Bennett, J. Electroanal. Chem., 1977, 81, 97–111 CrossRef CAS
. - A. B. Laursen, S. Kegnaes, S. Dahl and I. Chorkendorff, Energy Environ. Sci., 2012, 5, 5577–5591 CAS
. - A. K. Dutta, S. K. Maji, D. N. Srivastava, A. Mondal, P. Biswas, P. Paul and B. Adhikary, ACS Appl. Mater. Interfaces, 2012, 4, 1919–1927 CAS
. - A. K. Dutta, S. K. Maji, K. Mitra, A. Sarkara, N. Saha, A. Ghosh and B. Adhikarya, Sens. Actuators, B, 2014, 192, 578–585 CrossRef CAS PubMed
. - S. K. Maji, A. K. Dutta, P. Biswas, D. N. Srivastava, P. Paul, A. Mondal and B. Adhikary, Appl. Catal., A, 2012, 419–420, 170–177 CrossRef CAS PubMed
. - A. Sarkar, A. B. Ghosh, N. Saha, A. K. Dutta, D. N. Srivastava, P. Paul and B. Adhikary, Catal. Sci. Technol., 2015, 5, 4055–4063, 10.1039/c5cy00473j
. - W. Zhao, C. Chen, X. Li, J. Zhao, H. Hidaka and N. Serpone, J. Phys. Chem. B, 2002, 106, 5022–5028 CrossRef CAS
. - Y. Zhang, H. Xu, Y. Xu, H. Zhang and Y. Wang, J. Photochem. Photobiol., A, 2005, 170, 279–285 CrossRef CAS PubMed
. - H. Zuoli, Q. Wenxiu, C. Jing, Y. Xingtian, H. Yucheng and R. Jiangbo, ACS Appl. Mater. Interfaces, 2012, 4(12), 6816–6826 Search PubMed
. - T. Trindade and P. O'Brien, J. Mater. Chem., 1996, 6, 343–347 RSC
. - T. Trindade, P. O'Brien and X. M. Zhang, Chem. Mater., 1997, 9, 523–530 CrossRef CAS
. - T. Trindade, P. O'Brien, X. M. Zhang and M. Motevalli, J. Mater. Chem., 1997, 7, 1011–1016 RSC
. - B. Ludolph, M. A. Malik, P. O'Brien and N. Revaprasadu, Chem. Commun., 1998, 1849–1850 RSC
. - M. T. Ng, C. B. Boothroyd and J. J. Vittal, Chem. Commun., 2005, 3820–3822 RSC
. - T. Lu, O. Y. Ti, K. P. Loh and J. J. Vittal, J. Mater. Chem., 2006, 16, 272–277 RSC
. - T. Lu, H. I. Elim, W. Ji and J. J. Vittal, Chem. Commun., 2006, 4276–4278 Search PubMed
. - M. T. Ng, C. B. Boothroyd and J. J. Vittal, J. Am. Chem. Soc., 2006, 128, 7118–7119 CrossRef CAS PubMed
. - K. Nag and D. S. Joardar, Inorg. Chim. Acta, 1975, 14, 133–141 CrossRef CAS
. - M. Choudhury, J. Chem. Soc., Dalton Trans., 1984, 115–120 RSC
. - J. M. McEnaney, J. C. Crompton, J. F. Callejas, E. J. Popczun, A. J. Biacchi, N. S. Lewis and E. Schaak, Chem. Mater., 2014, 26, 4826–4831 CrossRef CAS
. - Y. Fang, L. Xiao, J. Qian, X. Ai, H. Yang and Y. Cao, Nano Lett., 2014, 14, 3539–3543 CrossRef CAS PubMed
. - S. Deka, A. Genovese, Y. Zhang, K. Miszta, G. Bertoni, R. Krahne, C. Giannini and L. Manna, J. Am. Chem. Soc., 2010, 132, 8912–8914 CrossRef CAS PubMed
. - H. Gnayem and Y. Sasson, ACS Catal., 2013, 3, 186–191 CrossRef CAS
. - S. Horikoski, A. Tokunaga, H. Hidaka and N. Serpone, J. Photochem. Photobiol., A, 2004, 162, 33–40 CrossRef
. - S. Kaneco, M. A. Rahman, T. Suzuki, H. Katsumata and K. Ohta, J. Photochem. Photobiol., A, 2004, 163, 419–424 CrossRef CAS PubMed
. - X. Yu, J. Yu, B. Cheng and B. Huang, Chem.–Eur. J., 2009, 15, 6731–6739 CrossRef CAS PubMed
. - J. Yu, G. Dai and B. Huang, J. Phys. Chem. C, 2009, 113, 16394–16401 CAS
. - J. Yu, J. Zhang and S. Liu, J. Phys. Chem. C, 2010, 114, 13642–13649 CAS
. - J. Yu, J. Zhang and M. Jaroniec, Green Chem., 2010, 12, 1611–1614 RSC
. - Y. He, D. Li, G. Xiao, W. Chen, Y. Chen, M. Sun, H. Huang and X. Fu, J. Phys. Chem. C, 2009, 113, 5254–5262 CAS
. - M. Li, D. Sun, W. Li, Y. Chen, Z. Chen, Y. He and X. Fu, J. Phys. Chem. C, 2008, 112, 18076–18081 Search PubMed
. - J. S. Hu, L. L. Ren, Y. G. Guo, H. P. Liang, A. M. Cao, L. J. Wan and C. L. Bai, Angew. Chem., Int. Ed., 2005, 44, 1269–1273 CrossRef CAS PubMed
. - N. C. Sharma, S. V. Sahi, S. Nath, J. G. Parsons, J. L. Gardea-Torresde and T. Pal, Environ. Sci. Technol., 2007, 41, 5137–5142 CrossRef CAS
. - K. Bera, T. Ghosh and S. Basak, J. Phys. Chem. C, 2015, 119, 1800–1808 CAS
. - S. Panigrahi, S. Basu, S. Praharaj, S. Pande, S. Jana, A. Pal, S. K. Ghosh and T. Pal, J. Phys. Chem. C, 2007, 111, 4596–4605 CAS
. - S. Jana, S. K. Ghosh, S. Nath, S. Pande, S. Praharaj, S. Panigrahi, S. Basu, T. Endo and T. Pal, Appl. Catal., A, 2006, 313, 41–48 CrossRef CAS PubMed
. - S. Jana, S. Pande, S. Panigrahi, S. Praharaj, S. Basu, A. Pal and T. Pal, Langmuir, 2006, 22, 7091–7095 CrossRef CAS PubMed
. - H. S. Shin and S. Huh, ACS Appl. Mater. Interfaces, 2012, 4, 6324–6331 CAS
.
Footnote |
† Electronic supplementary information (ESI) available: Fig. S1–S6. See DOI: 10.1039/c5ra19442c |
|
This journal is © The Royal Society of Chemistry 2015 |
Click here to see how this site uses Cookies. View our privacy policy here.