Integrating three-dimensional graphene/Fe3O4@C composite and mesoporous Co(OH)2 nanosheets arrays/graphene foam into a superior asymmetric electrochemical capacitor

Huanwen Wangab, Hui Teng Tana, Huan Yic, Yu Zhanga, Guilue Guoa, Xuefeng Wang*c, Srinivasan Madhavi*ab and Qingyu Yan*ab
aSchool of Materials Science and Engineering, Nanyang Technological University, Singapore 639798, Singapore. E-mail: Madhavi@ntu.edu.sg; alexyan@ntu.edu.sg
bEnergy Research Institute@NTU, Nanyang Technological University, Singapore 637553, Singapore
cDepartment of Chemistry, Shanghai Key Lab of Chemical Assessment and Sustainability, Tongji University, Shanghai 200092, China. E-mail: xfwang@tongji.edu.cn

Received 19th September 2015 , Accepted 9th October 2015

First published on 12th October 2015


Abstract

Aqueous electrolyte-based asymmetric electrochemical capacitors (AECs) are promising in the field of energy storage because of their wider potential windows compared to the symmetric capacitors and higher ionic conductivity compared to the organic electrolytes. Most of the research works on AECs are directed towards cathode materials, while anode materials have rarely been investigated. Herein, a novel AEC is constructed, in which two highly conductive and lightweight graphitic substrates, graphene framework and graphene foam, are hybridized with Fe3O4@C core–shell nanoparticles (anodes) and mesoporous Co(OH)2 nanosheets arrays (NAs) (cathodes), respectively. The as-assembled AEC device shows extended cell voltage (0.0–1.6 V) and excellent cycle stability (72% retention after 8000 cycles). More importantly, a high specific energy of 75 W h kg−1 is achieved at a specific power of 400 W kg−1. Even at a 10.3 s charge/discharge rate, specific energy as high as 33 W h kg−1 can be retained.

1. Introduction

The urgent demand to replace non-renewable fossil fuels and growing concerns about the air pollution/climate change problems have stimulated extensive research on energy storage and conversion systems to explore alternative energy sources over recent years.1–3 As a promising electrochemical energy storage device, electrochemical capacitor (EC) exhibits high specific power (ten times more than batteries), fast charge–discharge (with seconds) and excellent cycling stability, which can be utilized in hybrid vehicles, portable electronics, and backup energy systems.4,5 Although much progress has been achieved in developing novel nanostructured materials and understanding their charge storage mechanisms, current ECs still suffer from relatively low specific energy, especially at high charge/discharge rates.6,7 Generally, the cell voltage plays an important role in boosting specific energy (E) according to the equation E = 1/2CV2, where C is the cell capacitance and V is the cell voltage. Organic (or ionic liquid) electrolytes have been reported to be able to improve the specific energy of a SC.8 However, in consideration of environmentally friendliness, ionic conductivity as well as cost issues, aqueous electrolyte-based asymmetric electrochemical capacitors (AECs) are regarded to be more promising by combining a faradaic cathode (as energy source) and a capacitive anode (as power source) to increase the cell voltage for higher energy.9,10

Up to now, a number of AECs has been fabricated by integrating Co, Ni, Mn-based materials as cathodes and porous carbons (such as activated carbon, graphene, CNTs, carbon fiber, etc.) as anodes in alkaline or neutral electrolytes. Despite their great progress, the energy densities of these AECs are still difficult to approach (or exceed) at least that of lead acid batteries (20–40 W h kg−1) in most cases. Besides, some high energy densities of AECs in references are always at the cost of their power densities.11,12 From the viewpoint of electrode design and research focus of the AECs, several aspects should be urgently addressed.

Firstly, steering more attention towards anode materials. In literature, massive attention has often been focused on the development of cathode materials such as NiO,10,13 CoOx,14 MnO2,15–17 Co(OH)2,18 Ni(OH)2,5 etc. In contrast, the exploration of anode material for AECs is far less than cathode materials. Actually, the capacitance of an AEC device is dependent on the electrode with lower capacitance (anode), rather than the one with higher capacitance (cathode), following this equation:19

 
1/CAEC = 1/Ccathode + 1/Canode (1)

Hence, developing novel anode materials with high specific capacitance, appropriate working potential window and low electrical resistance is the key to achieve AEC with higher specific energy without sacrificing its high specific power. For instance, Wang and co-workers have demonstrated that adding RuO2 into graphene anode can effectively push the specific energy of graphene/Ni(OH)2//graphene AEC from 31 W h kg−1 to 48 W h kg−1 at a voltage window of 1.5 V in 1 M KOH aqueous solution.20

Secondly, designing binder (or additive)-free (cathode, anode) electrodes. In previous AECs, either cathode or anode electrode is usually prepared by the traditional slurry-coating technique for electrochemical measurement. In this case, the binders (or additives) involved greatly decrease the electrical conductivity of the electrode materials.21,22 Thus, the binder-free electrode can avoid the use of other auxiliary components such as conductive agents and binders so that it is optimized for higher power performances with the lowest resistivity possible.

Thirdly, lightweight electrode systems. Generally, the specific capacitance, specific energy and specific power are usually expressed in F g−1, W h kg−1 and kW kg−1, respectively. The most commonly used substrates (such as nickel foam, stainless steel, titanium foil, or carbon cloth) have occupied a large portion of mass in the AEC device, but they have almost no capacitance contribution to the device. This would inevitably lower the practical energy and power densities of the AECs. Furthermore, lightweight is also a requisite for future portable electronics. Thus, developing ultralight substrate is highly needed for AECs.

Finally, low cost. In recent research, nanoporous gold served as the conductive substrate to substantially enhance the specific energy of the PPy//MnO2 AEC.23 In addition, higher energy storage performance has also been achieved using palladium (Pd) functionalized graphene composite and RuO2 decorated graphene sheets as the efficient anode materials for AECs.20,24 Unfortunately, the high cost of Au, Pd, Ru-based materials has restricted their potential industrial applications. Therefore, optimizing AECs for being both high capacitance performance and low fabrication cost is still challenging.

On the basis of the above principles, we tried to combine all the aforementioned strategies. In the present work, we firstly selected two kinds of three-dimensional (3D), freestanding, ultralight and highly conductive graphene networks, namely graphene framework and graphene foam (GF), to serve as the substrate skeleton for AECs. Meanwhile, Fe3O4@C core–shell hybrids and mesoporous Co(OH)2 nanosheets arrays (NAs) were adopted as inexpensive anode and cathode materials, respectively. Since this optimal electrode configuration enables fast electron transport through the underlying graphene layers to the electroactive nanomaterials, the as-fabricated Co(OH)2 NAs/GF//graphene/Fe3O4@C AEC displays high specific energy and specific power (75 W h kg−1 and 24 kW kg−1, based on the entire mass of the anode and cathode) as well as satisfactory cycling performance (72% retention after 8000 cycles).

2. Experimental section

2.1. Synthesis of graphene/Fe3O4@C composites

The graphene/Fe3O4@C composites were synthesized by a two-step process. In the first step, graphene/Fe2O3 composites were prepared as follows: graphite oxide was firstly synthesized using a modified Hummers method.25,26 A 60 mL of graphite oxide (2 mg mL−1) aqueous dispersion was firstly mixed with FeCl3·6H2O (420 mg) by sonication for 4 h. Then the resulting mixture was sealed in a Teflon-lined autoclave and was hydrothermally treated at 180 °C for 8 h. Finally, the as-prepared sample was freeze-dried overnight and followed by vacuum drying at 60 °C for 12 h. In the second step, the as-obtained graphene/Fe2O3 composites were placed into a tube furnace. Before heating, the tube containing the sample was pumped down to residual pressure of ∼0.5 Pa. After that, the temperature was raised to 500 °C at a heating rate of 5 °C min−1. The acetylene (C2H2) gas was then introduced into the tube until the pressure reached ∼104 Pa. After reacting for 1 h, the tube furnace was rapidly cooled to room temperature at a rate of 20 °C min−1. The weight percent of Fe3O4 in the composite was estimated to be ∼62%.

2.2. Synthesis of mesoporous Co(OH)2 NAs/GF

GF was prepared by a nickel foam-directed chemical vapor deposition (CVD) as previously reported.27 The Co(OH)2 NAs/GF was prepared by an electrodeposition technique as follows: before the deposition, GF was firstly treated with 5 M HNO3 for 0.5 h at 45 °C, to increase its wettability. The electrodeposition was performed in a standard three-electrode glass cell consisting of the clean GF working electrode, a platinum foil counter electrode and a saturated calomel reference electrode (SCE) at room temperature. The Co(OH)2 was electrodeposited upon GF at −0.9 V (vs. SCE) in a 6 mM Co(NO3)2·6H2O aqueous electrolyte using a CHI660D electrochemical working station. After electrodepositing for ∼2 min, the green GF was carefully rinsed with deionized water and absolute ethanol for several times, and finally dried in air. The weight and thickness of the Co(OH)2 NAs/GF were calculated to be 1.80–1.85 mg cm−2 and ∼200 μm, respectively. The weight percent of Co(OH)2 in the Co(OH)2 NAs/GF composite was ∼67%.

2.3. Material characterization

The morphology of the products were characterized by field emission scanning electron microscopy (FESEM; Philips XSEM30, Holland) and transmission electron microscopy (TEM; JEOL, JEM-2010, Japan). The crystal structure of the samples was examined by X-ray diffraction (XRD; Philips PC-APD) with Cu Kα radiation (λ = 1.5418 Å), operating at 40 kV, 60 mA. Raman spectra were collected using a 514 nm laser with RM100 under ambient conditions, with a laser spot size of ∼1 mm. Nitrogen adsorption/desorption isotherms were measured using a Micromeritics Tristar 3000 analyzer.

2.4. Electrochemical measurement

The graphene/Fe3O4@C composites and the Co(OH)2 NAs/GF were directly used as the binder/additive-free working electrodes by cutting them into small thin round slices with a thickness of ∼1 mm and processing these slices into thinner electrodes upon pressing. A three-electrode system was firstly used to measure the electrochemical performances of the graphene/Fe3O4@C composites and the Co(OH)2 NAs/GF as the working electrodes in 1 M KOH aqueous solution, using a platinum foil as the counter electrode and SCE as the reference electrode. The test current densities were based on the mass of each electrode.

The AEC device was measured in a two-electrode system using graphene/Fe3O4@C composites as anodes and Co(OH)2 NAs/GF as cathodes. The mass ratio of the active materials (Co(OH)2 NAs/GF[thin space (1/6-em)]:[thin space (1/6-em)]graphene/Fe3O4@C) was estimated to be 0.8 according to the specific capacitance and the potential window obtained from their corresponding GCD measurements. The Co(OH)2 NAs/GF and graphene/Fe3O4@C electrodes with optimized mass ratio (≈1 × 1 cm2; graphene/Fe3O4@C mass: ≈2.2 mg, Co(OH)2 NAs/GF mass: ≈1.8 mg) were separated by a polypropylene membrane separator that soaked with 1 M KOH electrolyte solution and pressed together within two PET sheets. CV and GCD experiments were carried out using the electrochemical workstation (CHI660D, Chenhua, Shanghai). The current densities were set based on the total mass of two electrodes. The equations for calculating the specific capacitance, specific energy and specific power were shown in ESI.

3. Results and discussion

3.1. Anode electrode material: graphene/Fe3O4@C composites

The schematic diagram represented the formation process of the 3D graphene/Fe3O4@C composites is shown in Fig. 1A, which involves two major steps: (1) under electrostatic interactions, Fe3+ cations from FeCl3 can favorably bind with the oxygen-containing groups on the graphene oxide (GO) sheets. During the hydrothermal process, Fe3+ ions are gradually hydrolyzed into FeOOH and further decomposed into Fe2O3 on the surface of the GO sheets. At the same time, high pressure and temperature conditions inside the sealed reactor can diminish the oxygenated functionalities of the GO. In the end, the combination of the hydrogen bonding and the π–π interaction enables the formation of graphene/Fe2O3 composites;28,29 (2) under C2H2 atmosphere, in situ transformation of the obtained graphene/Fe2O3 composites into the graphene/Fe3O4@C composites was successfully achieved by undergoing the following chemical reaction:
 
3Fe2O3 + C2H2 → 2Fe3O4 + 2C + H2O (2)

image file: c5ra19323k-f1.tif
Fig. 1 Schematic illustration of the formation process (A) and FESEM images (B–D) of the 3D graphene/Fe3O4@C composites. The inset shows the photograph of the graphene/Fe3O4@C composites.

This gas-phase synthesis technique can retain the 3D porous morphology. On the other hand, the as-generated carbon encapsulated nanostructure (namely, core–shell structure) can act as a protective layer to prevent the architectures from destruction/degradation and effectively enhance the cycling stability of the iron oxides, as indicated in the following discussion. The carbon layer on the Fe3O4 coating is typically porous, which can allow the permeation of the electrolyte to reach the oxides.

The 3D morphology of the as-synthesized sample was confirmed by FESEM. In the low magnification FESEM image (Fig. 1B), graphene/Fe3O4@C composites display an interconnected macroporous morphology, in which pore size ranging from a few hundred nanometers to several micrometers are observed (Fig. 1C). From the high magnification FESEM image (Fig. 1D), it can be clearly observed that the Fe3O4 particles with a size of 50–100 nm are anchored on the surface of the ultrathin and flexible graphene nanosheets. Nitrogen adsorption–desorption analysis reveals a typical Brunauer–Emmett–Teller (BET) surface area of 122.1 m2 g−1 for the graphene/Fe3O4@C composites (Fig. S1A in ESI). The type-IV isotherm curve that displays a distinct hysteresis loop in Fig. S1A (ESI) is indicative of the existence of a large number of mesopores in the composites. The pore size distribution of the graphene/Fe3O4@C composites specifically reveals the uniform size of ∼3.7 nm (Fig. S1B in ESI). The hybrid structure is capable of preventing graphene sheets from closely restacking when they are packed or compressed into an electrode structure, thereby maintaining a mesoporous structure (e.g. pores size around 3.7 nm).

The compositional/structural information of the graphene/Fe3O4@C composites is further unraveled by XRD patterns, Raman spectroscopy and TEM measurements. Fig. 2A shows the XRD patterns of the as-prepared samples. Diffraction peaks obtained from the graphene/Fe2O3 composites can be assigned to Fe2O3 (JCPDS no. 33-0664). Moreover, the absence of conventional stacking of graphene layers along the (002) direction suggests that the graphene sheets disperse homogeneously in the 3D composite framework, making them remains in monolayer form. After the C2H2 treatment at 500 °C, almost all the Fe2O3 are converted into Fe3O4 (JCPDS, No. 01-1111). In addition, a board diffraction hump appears in the range of 24–28°, which may be the reflections originated from the combination of the carbon shell and the graphene. As shown in Fig. 2B, the Raman spectrum of the graphene/Fe3O4@C composites presents the characteristic D and G bands of carbon (graphene) at 1334 and 1582 cm−1 and the fundamental Raman scattering peaks of Fe3O4 at 200–600 cm−1, which are in agreement with previous references.30,31 To further confirm the generation of carbon shell on surface of the Fe3O4 nanoparticles, we annealed the pure Fe2O3 at 500 °C under C2H2 atmosphere. From Fig. 2B, it can be clearly seen that, in addition to the bands corresponding to Fe3O4, the characteristic D and G bands of carbon also appear clearly, which indicate the successful reaction between the Fe2O3 and gaseous C2H2 to form Fe3O4@C.


image file: c5ra19323k-f2.tif
Fig. 2 XRD patterns (A) of the graphene/Fe2O3 and the graphene/Fe3O4@C composites, Raman spectra (B) of the graphene/Fe3O4@C composites and the Fe3O4@C, TEM images (C–E) and SAED pattern (F) of the graphene/Fe3O4@C composites.

Fig. 2C shows the TEM image of the graphene/Fe3O4@C composites, in which a number of nanoparticles are uniformly deposited on the ultrathin graphene sheet. Fig. 2D reveals a typical Fe3O4 particle with highly crystalline nature that is encapsulated by a thin layer of carbon shell. High-resolution TEM (HRTEM) image reveals clear lattice fringes with a d spacing of 0.48 nm, corresponding to the (111) plane of Fe3O4 (Fig. 2E). As shown in Fig. 2F, the SAED reflection spots that corresponds to the particles in Fig. 2D can be indexed to Fe3O4 with inverse spinel crystal structure (JCPDS no. 01-1111).

To evaluate the electrochemical properties of the graphene/Fe3O4@C composites, we performed cyclic voltammogram (CV) and galvanostatic charge–discharge (GCD) measurements. Fig. 3A shows typical CV curves of graphene/Fe3O4@C composites within the potential range of −1.2 to −0.1 V at 5 and 10 mV s−1. These CV curves have one pair of redox peaks, corresponding to the conversion between Fe(II) and Fe(0).32,33 When it is scanned to negative potential range, Fe(II) is reduced to Fe(0) before the emergence of appreciable hydrogen evolution. When it is subsequently scanned to the reverse direction, Fe(0) is oxidized back to Fe(II), corresponding to one oxidation peak observed in the CV curves. It is also noted that these CV curves retain similar shape with an increase in scan rate. This indicates that the transports of electrolyte ions and electrons in or close to the active material can be synchronized with the rapid electrons transfer from the external circuit.


image file: c5ra19323k-f3.tif
Fig. 3 Electrochemical properties of the graphene/Fe3O4@C composite. (A) CV curves. (B and C) GCD curves at different current densities, ranging from 1 to 30 A g−1. (D) Capacitance values versus current density. (E) Cycling performance measured at 4 A g−1 for 1000 cycles.

Fig. 3B and C exhibits the GCD curves of the graphene/Fe3O4@C composites. The capacitance values of the graphene/Fe3O4@C composites are calculated based on the discharging curves and are summarized in Fig. 3D. The specific capacitance can achieve a maximum specific capacitance of 485 F g−1 at a low current density of 1 A g−1, which can still retain to be 245 F g−1 (about 51% retention) even at a current density as high as 30 A g−1. These values are much higher than that of many carbon anode materials reported for AECs from literature. Since the electrode reaction (Fe(II) ↔ Fe(0)) of the graphene/Fe3O4@C composites in KOH electrolyte is very similar to the conversion reactions of anodes (MxOy + 2yLi+ + 2yexM + yLi2O) in Li ion battery, the cycling stability become quite important in this case. In our previous work,7 a Fe2O3/graphene composite was reported to have only 69% retention of its initial capacitance after 200 cycles in 1 M KOH electrolyte. As shown in Fig. 3E, 88% of the initial capacitance can be retained at a current density of 4 A g−1 for 1000 cycles, indicating the increased stability of the AEC. The TEM and FESEM tests are used to investigate the structural change after cycling. As shown in the Fig. S2A (ESI), 3D porous morphology is retained after cycling. The TEM image reveals that Fe3O4 nanoparticles are still anchored on the graphene sheets after cycling (Fig. S2B in ESI).

The mass (mA) of the Fe3O4 material taking part in the surface redox reaction can be calculated by the following two equations,

 
Q = C × m × ΔV (3)
 
mA = n × MA = Q × MA/z × F (4)
where Q is the charge, C is specific capacitance, ΔV is the potential drop during discharge, m is the mass of active material in the working electrode, mA is the material mass with taking part in redox reaction, n is the amount of substance, MA is the molar mass, F is Faraday constant (96[thin space (1/6-em)]485.34C mol−1) and z is the stoichiometric coefficient of electron transport in electrochemical processes. According to the capacitance value (485 F g−1) of graphene/Fe3O4@C and weight percent (62%) of Fe3O4 in the composite, it can be found that ∼25% of the Fe3O4 material takes part in the surface redox reaction.

To investigate the contribution of graphene to the total capacitance of graphene/Fe3O4@C anode, pure graphene was synthesized by the same procedure in the absence of FeCl3·6H2O. Fig. S3 in ESI shows electrochemical properties of pure graphene in the potential window of −1 to −0.1 V vs. SCE. The CV curves of pure graphene exhibit typical rectangular shape at different sweep rates (Fig. S3A in ESI), indicating good charge propagation at the electrode surface. According to the galvanostatic charge–discharge test (Fig. S3B in ESI), the specific capacitance is calculated to be 167 F g−1, which is much lower than that of the graphene/Fe3O4@C composite. In consideration of the weight percent (38%) of graphene in the composite, the contribution of graphene is 63 F g−1 for the graphene/Fe3O4@C composite. Comparatively, Fe3O4 has the contribution of 423 F g−1 to the total capacitance of the composite.

All in all, the as-prepared graphene/Fe3O4@C composites are comparable or even more superior to the best results reported for FeOx-based SC electrodes in the literature in terms of specific capacitance, rate capability and/or cycling stability (Table S1 in ESI).

3.2. Cathode electrode material: mesoporous Co(OH)2 NAs/GF

3D graphene foams (GFs) prepared by CVD are constructed by defect-free graphenes with continuous and highly conductive networks. Its high quality, graphitic nature as well as ultralight weight (∼0.6 mg cm2) make GF an ideal 3D current collector.34 Herein, mesoporous Co(OH)2 NAs/GF is prepared by a facile electrodeposition, which is schematically showed in Fig. 4A. When the electrical current passes through the electrolyte containing Co(NO3)2, nitrate ions can be reduced on the GF surface to produce hydroxide ions (OH). The generation of OH raises the local pH value, resulting in the uniform precipitation of Co(OH)2 on the GF surface.35
image file: c5ra19323k-f4.tif
Fig. 4 Schematic illustration of the formation process (A), FESEM images (B, C) and TEM images (D and E) of the mesoporous Co(OH)2 NAs/GF. The inset of (E) shows the SAED pattern of the Co(OH)2 NAs/GF.

Fig. 4B and C present the FESEM images of Co(OH)2 NAs/GF at different magnifications. From the low magnification FESEM image (Fig. 4B), it is clearly observed that the surface of the graphene skeleton is continuous with obvious ripples and wrinkles. In the high magnification image (Fig. 4C), Co(OH)2 nanosheets are deposited uniformly on the GF substrate. These nanosheets grow perpendicularly to the graphene support, and are interconnected with each other, forming an ordered array with a highly porous structure. This unique morphology is highly accessible by electrolyte ions when it is used as an electrode for SCs. From the inset of Fig. 4C, it can be seen that the thickness of the Co(OH)2 is ∼10 nμm. From TEM image (Fig. 4D), the interconnected nanosheets are homogeneously grown on the graphene sheets, which is in contrast to the pure GF (Fig. S4 in ESI). As shown in Fig. 4E, the individual Co(OH)2 nanosheet is assembled from the nanoparticles, forming a mesoporous structure. Fig. S5 (ESI) further reveals these nanoparticles with particle size of ∼2 nm and the existence of interstitial mesopores with size ranging from 2 to 3 nm. The SAED pattern (inset of Fig. 4E) displays well-defined diffraction rings that can be well indexed to α-Co(OH)2 phase (JCPDS 74-1057), illustrating its polycrystalline characteristics.

We also carried out XRD, Raman and FT-IR analyses (Fig. 5) to further investigate the microstructure of the Co(OH)2 NAs/GF. As shown in Fig. 5A, in addition to the (002) reflection plane of GF,11 two board peaks indicates that the electrodeposited cobalt hydroxides show poor crystallinity. As seen in the Raman spectra of the GF (Fig. 5B), the G/2D ratio calculated from the G band and 2D band at 1579 and 2726 cm−1, respectively, reveals the typical Raman characteristics of few-layer graphene. In the case of Co(OH)2 NAs/GF (Fig. 5B), apart from the pristine peaks of GF, there are three additional Raman peaks, i.e., a sharp peak at 522 cm−1 and two broad peaks at 462 cm−1 and 1043 cm−1, which can be assigned to the CoO (Ag) symmetric stretching mode, the OCoO bending mode and the OH deformation mode, respectively, in Co(OH)2.36,37 The Raman results further suggest the successful integration of the Co(OH)2 NAs onto the GF. The FT-IR spectrum (Fig. S6 in ESI) indicates the typical features of α-Co(OH)2. The broad band at ∼3433 cm−1 represents the stretching vibration between the bonding of H2O to the hydrogen belonged to hydroxyl groups in vicinity. The bands at 1628, 1380, 662 and 528 cm−1 correspond to the bending mode of water molecules, the presence of NO3 anions, the δ(Co–O–H) and the νCo–O stretching vibrations, respectively.38


image file: c5ra19323k-f5.tif
Fig. 5 XRD pattern (A) of the Co(OH)2 NAs/GF, Raman spectra (B) of GF and Co(OH)2 NAs/GF.

Electrochemical properties of the Co(OH)2 NAs/GF electrode is presented in Fig. 6. Fig. 6A shows the CV curves of the Co(OH)2 NAs/GF in 1 M KOH electrolyte at different scan rates, ranging from −0.20 V to 0.55 V. Obviously, there are two redox peaks attributed to the following faradaic reactions of Co(OH)2:39

 
Co(OH)2 + OH ⇔ CoOOH + H2O + e (5)
 
CoOOH + OH ⇔ CoO2 + H2O + e (6)


image file: c5ra19323k-f6.tif
Fig. 6 Electrochemical properties of the Co(OH)2 NAs/GF. (A) CV curves. (B) GCD curves at different current densities from 1 to 30 A g−1. (C) Capacitance values as a function of current densities. (D) Cycling stability measured at 4 A g−1 for 1000 cycles.

Fig. 6B exhibit the GCD curves of the Co(OH)2 NAs/GF electrode at different current densities. Redox characteristics can be observed in the GCD curves that correlate to the redox peaks of Co(OH)2 in the CV curves. The specific capacitance can be calculated from the discharge curves, as illustrated in Fig. 6C. The capacitance values of Co(OH)2 NAs/GF is 1160 F g−1 at 1 A g−1 and retains 556 F g−1 after having 30-fold increase in current density (30 A g−1) (Fig. 6C). In addition, the Co(OH)2 NAs/GF electrode retains 95% of initial capacitance after 1000 cycles (Fig. 6D). This superior pseudocapacitive performance may be attributed to the combination of 3D highly conductive GF with mesoporous NAs structure for fast electrons and ions transportation.

3.3. Mesoporous Co(OH)2 NAs/GF//graphene/Fe3O4@C composite AEC

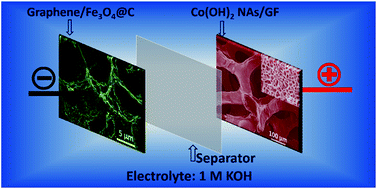
On the basis of the above results, a novel AEC was constructed which composed of graphene/Fe3O4@C composites anode and mesoporous Co(OH)2 NAs/GF cathode in 1 M KOH electrolyte solution (Fig. 7A). The voltage split depends on the capacitance of each active electrode material. In this regard, the charge balance (Q+ = Q) between the anode and cathode electrodes is essential to achieve higher level of specific energy using AEC configuration. The stored charge is related to the specific capacitance (C), the potential window in the GCD process (ΔV), and the mass of the electrode (m), which can be expressed as the following equation: Q = C × ΔV × m. According to the specific capacitances and potential windows for the graphene/Fe3O4@C composites and the Co(OH)2 NAs/GF in the aforementioned three-electrode system (Fig. 3E, 6D and 7B), the optimal mass ratio between the two electrodes in the AEC is expected to be mcathode/manode = 0.8.
image file: c5ra19323k-f7.tif
Fig. 7 (A) Schematic diagram of the Co(OH)2 NAs/GF//graphene/Fe3O4@C composite AEC devise in 1 M KOH electrolyte. (B) CV curves of individual Co(OH)2 NAs/GF and graphene/Fe3O4@C composite electrodes at 5 mV s−1. (C) CV curves of the AEC at various scan rates. (D) Variation of charge and discharge peak current with scan rate from 5 to 50 mV s−1. (E) Specific capacitances of the AEC as a function of current densities, (F) cycling performance of the AEC at 4 A g−1 for 8000 cycles. The insets of (E) are GCD curves of the AEC at various current densities (ranging from 0.5 to 30 A g−1).

Fig. 7C shows typical CV curves of the Co(OH)2 NAs/GF//graphene/Fe3O4@C composite AEC at various scan rates. The operating voltage of AEC can be successfully extended to 1.6 V. Two broad redox peaks that arise from the individual redox-active anode and cathode are observed. Similar to the results of single electrodes measured in three electrode configuration, a linear relationship of the scan rates ranging from 5 to 50 mV s−1 has also been achieved between peak current and scan rate with R2 = 0.99828 and 0.99513 for the charge and discharge curves, respectively (Fig. 7D). This faradaic pseudocapacitive nature of the AEC can be reasonably attributed to the perfect design of anode and cathode materials. The GCD curves at different current densities, ranging from 0.5 to 30 A g−1, are shown in the insets of Fig. 7E. All the discharge curves are symmetric to their corresponding charge counterparts, suggesting a good reversibility and a high coulombic efficiency. The coulombic efficiency of the 1st cycle is 96%. The relationship between capacitance values (based on the total mass of the Co(OH)2 NAs/GF cathode and graphene/Fe3O4@C composite anode) and current density is illustrated in Fig. 7E. The specific capacitance reaches a maximum value of 210 F g−1 at 0.5 A g−1 and retains 92 F g−1 at a high current density of 30 A g−1 (a full charge–discharge cycle is completed in 10.3 s). Fig. 7F shows the cycling performance of the AEC measured at a current density of 4 A g−1 for 8000 cycles. The capacitance retention after 8000 charge–discharge cycles is up to 72%, indicating a reasonable stability of the Co(OH)2 NAs/GF//graphene/Fe3O4@C composite AEC. The decay in specific capacitance may be caused by the mechanical expansion of Fe3O4 during ion insertion/desertion process and Fe dissolution into electrolyte. It is expected that using gel electrolyte may alleviate the dissolution problem but the reduced ionic conductivity may result in lower specific power.40,41 In addition, the series resistance of the devices is estimated to be 2.0 Ω (Rs = 1.3 Ω; Rct = 0.7 Ω) from the EIS measurement (Fig. S7 in ESI). The relatively small serial resistances of our AEC devise imply a fast charge transfer between the electrolyte and electrodes.

The specific energy and specific power are commercial indicators to assess the performances of an AEC. The GCD curves were used to evaluate these two parameters for our Co(OH)2 NAs/GF//graphene/Fe3O4@C composite AEC device. Fig. 8 shows the Ragone plot of specific E versus P values. The maximum specific energy of the AEC is up to 75 W h kg−1 at a specific power of 400 W kg−1. Even at a specific power of 24 kW kg−1, a high specific energy of 33 W h kg−1 can still be achieved. It should be noted that the specific power of 24 kW kg−1 corresponds to a full charge–discharge cycle completed in 10.3 s. Such energy and power densities of the as-fabricated AEC have exceeded the best results of AECs with carbon materials as anodes in references, such as NiCo2S4 hollow spheres//graphene/carbon spheres (42.3 W h kg−1 at 476 W kg−1),42 Ni(OH)2/CNT/NF//AC (50.6 W h kg−1 at 95 W kg−1),43 the Ni(OH)2/graphene//porous graphene (13.5 W h kg−1 at 15.2 kW kg−1),44 CoO@PPy nanowire array//AC (43.5 W h kg−1 at 87.5 W kg−1),45 and 3D macroporous graphene/MnO2//macroporous graphene (44 W h kg−1 at 11.2 kW kg−1).46 Furthermore, the energy storage ability of our AEC device is more superior than most of the AECs using redox-active materials as anodes, such as graphene-MnO2//graphene-MoO3 (42.6 W h kg−1 at 276 W kg−1),47 2D MnO2//γ-FeOOH (37.4 W h kg−1 at 16 kW kg−1).48 Besides, Co(OH)2 NAs/GF//graphene/Fe3O4@C aerogel ASC shows slightly lower specific energy and power than those of alkaline rechargeable Ni/Fe battery (100.7 W h kg−1 at 287 W kg−1 and 70.9 W h kg−1 at 1.4 kW kg−1).


image file: c5ra19323k-f8.tif
Fig. 8 Ragone plot of the Co(OH)2 NAs/GF//graphene/Fe3O4@C composite AEC devise (black square). Scatter dots refer to the specific power and their corresponding specific energy reported in the literature (the reference numbers are indicated in the figure).

To further demonstrate the importance of the anodes in achieving high energy density for ASCs, pure GAs have also been prepared for constructing Co(OH)2 NAs/GF//GA ASC (Fig. S8 in ESI). Electrochemical properties of the Co(OH)2 NAs/GF//GA ASC devise are shown in Fig. S9 (ESI). The specific energy of the ASC is 27 W h kg−1 at a specific power of 375 W kg−1. When the specific power is 23 kW kg−1, a specific energy of 12 W h kg−1 can be achieved. Obviously, these values of the Co(OH)2 NAs/GF//GA ASC are much lower than that of Co(OH)2 NAs/GF//graphene/Fe3O4@C ASC (Fig. 8).

It is worth pointing out that these specific energy and specific power are calculated on the basis of the total mass of the two electrodes, including the mass of substrates. No conventional current collectors (such as nickel foam, carbon cloth) are involved in our AEC device, which is very favorable to achieving high energy and power in device level. For example, the recently reported Ni(OH)2/MWNT//FeOx/graphene device can deliver a specific specific energy of 120 W h kg−1 and a specific specific power of 15 kW kg−1 within an operating voltage of 1.6 V.32 However, when the nickel foam is included during calculation process, only 3.6 W h kg−1 and 0.9 kW kg−1 are achieved. In this case, our as-prepared AEC has unique advantages for practical applications. Considering that the whole AEC device mass (mdevice) (∼2 times that of the electrode mass), the Co(OH)2 NAs/GF//graphene/Fe3O4@C composite device still delivers very high specific energy (∼37 W h kg−1) and specific power (∼12 KW kg−1). Besides, the lightweight feature of the Co(OH)2 NAs/GF//graphene/Fe3O4@C composite AEC can be potentially used for portable electronics.

Several factors endow the Co(OH)2 NAs/GF//graphene/Fe3O4@C composite AEC with high energy and power densities as well as excellent cycling stability. Firstly, in the AEC full-cell system, the 3D interconnected graphene framework that serve as the supporting scaffold for anodes and cathodes can provide a highly conductive pathway for electron and ion transportation. The electronic conductivities for graphene/Fe3O4@C anodes and mesoporous Co(OH)2 NAs/GF cathodes were measured to be 62 and 10 S m−1, respectively. Secondly, in situ growth of active materials (Fe3O4, Co(OH)2) on the graphene substrates can avoid the “dead” volume incurred by the use of electro-inert additives (or binders). Thirdly, highly dispersed Fe3O4@C core–shell structure and mesoporous Co(OH)2 nanosheet arrays can provide higher electrochemically available active surface area to realize the full potential of the Fe3O4, Co(OH)2-based pseudocapacitance and graphene-based EDLC. Based on these preliminary results, we believe that the hybridization of 3D high-quality/conductivity graphene network with redox-active anode and cathode nanomaterials holds great potential to be widely used for energy storage applications.

4. Conclusions

In summary, 3D porous graphene/Fe3O4@C composites anodes and mesoporous Co(OH)2 NAs/GF cathodes have been successfully fabricated by hydrothermal and electrodeposition methods, respectively, to build a novel AEC for achieving high energy storage performance. Here, a maximum specific energy as high as 75 W h kg−1 can be achieved at a specific power of 400 W kg−1. Additionally, an specific energy of 33 W h kg−1 has been achieved by the as-assembled Co(OH)2 NAs/GF//graphene/Fe3O4@C composite AEC at a high specific power of 24 kW kg−1 with an operating voltage of 1.6 V. Moreover, excellent cycling stability (72% retention after 8000 cycles) has also been obtained for the AEC device. These results indicate that the as-prepared Co(OH)2 NAs/GF//graphene/Fe3O4@C composite AEC is a highly promising candidate for high-performance energy storage applications.

Acknowledgements

X Wang thanks the financial support offered by NSFC Grants (21173158, 21373152). The authors gratefully acknowledge Singapore MOE AcRF Tier 1 grants RG2/13, Singapore National Research Foundation under CREATE program: EMobility in Megacities and Mindef project (9014100570): 3D graphene-based supercapacitor.

References

  1. Y. Guo, J. Hu and L. Wan, Adv. Mater., 2008, 20, 2878–2887 CrossRef CAS PubMed.
  2. H. Wang, C. Guan, X. Wang and H. J. Fan, Small, 2015, 11, 1470–1477 CrossRef CAS PubMed.
  3. T. Zhai, X. Lu, H. Wang, G. Wang, T. Mathis, T. Liu, C. Li, Y. Tong and Y. Li, Nano Lett., 2015, 15, 3189–3194 CrossRef CAS PubMed.
  4. G. Wang, L. Zhang and J. Zhang, Chem. Soc. Rev., 2012, 41, 797–828 RSC.
  5. J. Ji, L. L. Zhang, H. Ji, Y. Li, X. Zhao, X. Bai, X. Fan, F. Zhang and R. S. Ruoff, ACS Nano, 2013, 7, 6237–6243 CrossRef CAS PubMed.
  6. X. Wang, B. Liu, R. Liu, Q. Wang, X. Hou, D. Chen, R. Wang and G. Shen, Angew. Chem., Int. Ed., 2014, 126, 1880–1884 CrossRef PubMed.
  7. H. Wang, Z. Xu, H. Yi, H. Wei, Z. Guo and X. Wang, Nano Energy, 2014, 7, 86–96 CrossRef CAS PubMed.
  8. C. Liu, Z. Yu, D. Neff, A. Zhamu and B. Z. Jang, Nano Lett., 2010, 10, 4863–4868 CrossRef CAS PubMed.
  9. X. Lu, M. Yu, T. Zhai, G. Wang, S. Xie, T. Liu, C. Liang, Y. Tong and Y. Li, Nano Lett., 2013, 13, 2628–2633 CrossRef CAS PubMed.
  10. H. Wang, H. Yi, X. Chen and X. Wang, J. Mater. Chem. A, 2014, 2, 3223–3230 CAS.
  11. X. Xia, D. Chao, Z. Fan, C. Guan, X. Cao, H. Zhang and H. J. Fan, Nano Lett., 2014, 14, 1651–1658 CrossRef CAS PubMed.
  12. H. Wang, H. Yi, C. Zhu, X. Wang and H. J. Fan, Nano Energy, 2015, 13, 658–669 CrossRef CAS PubMed.
  13. D. W. Wang, F. Li and H. M. Cheng, J. Power Sources, 2008, 185, 1563–1568 CrossRef CAS PubMed.
  14. L. J. Xie, J. F. Wu, C. M. Chen, C. M. Zhang, L. Wan, J. L. Wang, Q. Q. Kong, C. X. Lv, K. X. Li and G. H. Sun, J. Power Sources, 2013, 242, 148–156 CrossRef CAS PubMed.
  15. Z. S. Wu, W. Ren, D. W. Wang, F. Li, B. Liu and H. M. Cheng, ACS Nano, 2010, 4, 5835–5842 CrossRef CAS PubMed.
  16. X. Zhang, P. Yu, H. Zhang, D. Zhang, X. Sun and Y. Ma, Electrochim. Acta, 2013, 89, 523–529 CrossRef CAS PubMed.
  17. X. Zhang, X. Sun, H. Zhang, D. Zhang and Y. Ma, Mater. Chem. Phys., 2012, 137, 290–296 CrossRef CAS PubMed.
  18. S. Gao, Y. Sun, F. Lei, L. Liang, J. Liu, W. Bi, B. Pan and Y. Xie, Angew. Chem., Int. Ed., 2014, 53, 12789–12793 CrossRef CAS PubMed.
  19. L. Y. Chen, Y. Hou, J. L. Kang and M. W. Chen, J. Mater. Chem. A, 2014, 2, 8448–8455 CAS.
  20. H. Wang, Y. Liang, T. Mirfakhrai, Z. Chen, H. S. Casalongue and H. Dai, Nano Res., 2011, 4, 729–736 CrossRef CAS.
  21. Q. Lu, M. W. Lattanzi, Y. Chen, X. Kou, W. Li, X. Fan, K. M. Unruh, J. G. Chen and J. Q. Xiao, Angew. Chem., 2011, 123, 6979–6982 CrossRef PubMed.
  22. H. Wang and X. Wang, ACS Appl. Mater. Interfaces, 2013, 5, 6255–6260 CAS.
  23. Y. Hou, L. Chen, P. Liu, J. Kang, T. Fujita and M. Chen, J. Mater. Chem. A, 2014, 2, 10910–10916 CAS.
  24. Z. Yu, M. McInnis, J. Calderon, S. Seal, L. Zhai and J. Thomas, Nano Energy, 2015, 11, 611–620 CrossRef CAS PubMed.
  25. Y. Xu, K. Sheng, C. Li and G. Shi, ACS Nano, 2010, 4, 4324–4330 CrossRef CAS PubMed.
  26. W. S. Hummers and R. E. Offeman, J. Am. Chem. Soc., 1958, 80, 1339 CrossRef CAS.
  27. H. W. Wang, Z. A. Hu, Y. Q. Chang, Y. L. Chen, H. Y. Wu, Z. Y. Zhang and Y. Y. Yang, J. Mater. Chem., 2011, 21, 10504–10511 RSC.
  28. Z. Chen, W. Ren, L. Gao, B. Liu, S. Pei and H. M. Cheng, Nat. Mater., 2011, 10, 424–428 CrossRef CAS PubMed.
  29. H. Wang, H. Yi, X. Chen and X. Wang, J. Mater. Chem. A, 2014, 2, 1165–1173 CAS.
  30. H. Cohen, A. Gedanken and Z. Zhong, J. Phys. Chem. C, 2008, 112, 15429–15438 CAS.
  31. J. Z. Wang, C. Zhong, D. Wexler, N. H. Idris, Z. X. Wang, L. Q. Chen and H. K. Liu, Chem.–Eur. J., 2011, 17, 661–667 CrossRef CAS PubMed.
  32. H. Wang, Y. Liang, M. Gong, Y. Li, W. Chang, T. Mefford, J. Zhou, J. Wang, T. Regier, F. Wei and H. Dai, Nat. Commun., 2012, 3, 917–924 CrossRef PubMed.
  33. J. Liu, M. Chen, L. Zhang, J. Jiang, J. Yan, Y. Huang, J. Lin, H. J. Fan and Z. X. Shen, Nano Lett., 2014, 14, 7180–7187 CrossRef CAS PubMed.
  34. X. C. Dong, H. Xu, X. W. Wang, Y. X. Huang, M. B. Chan-Park, H. Zhang, L. H. Wang, W. Huang and P. Chen, ACS Nano, 2012, 6, 3206–3213 CrossRef CAS PubMed.
  35. W. J. Zhou, J. Zhang, T. Xue, D. D. Zhao and H. L. Li, J. Mater. Chem., 2008, 18, 905–910 RSC.
  36. J. Yang, H. Liu, W. N. Martens and R. L. Frost, J. Phys. Chem. C, 2010, 114, 111–119 CAS.
  37. C. Mockenhaupt, T. Zeiske and H. D. Lutz, J. Mol. Struct., 1998, 443, 191–196 CrossRef CAS.
  38. Z. A. Hu, Y. L. Xie, Y. X. Wang, L. J. Xie, G. R. Fu, X. Q. Jin, Z. Y. Zhang, Y. Y. Yang and H. Y. Wu, J. Phys. Chem. C, 2009, 113, 12502–12508 CAS.
  39. V. Gupta, S. Gupta and N. Miura, J. Power Sources, 2008, 175, 680–685 CrossRef CAS PubMed.
  40. G. Wang, X. Lu, Y. Ling, T. Zhai, H. Wang, Y. Tong and Y. Li, ACS Nano, 2012, 6, 10296–10302 CrossRef CAS PubMed.
  41. X. Lu, G. Wang, T. Zhai, M. Yu, S. Xie, Y. Ling, C. Liang, Y. Tong and Y. Li, Nano Lett., 2012, 12, 5376–5381 CrossRef CAS PubMed.
  42. L. Shen, L. Yu, H. B. Wu, X. Y. Yu, X. Zhang and X. W. Lou, Nat. Commun., 2015, 6, 6694 CrossRef CAS PubMed.
  43. Z. Tang, C. H. Tang and H. Gong, Adv. Funct. Mater., 2012, 22, 1272–1278 CrossRef CAS PubMed.
  44. J. Yan, Z. Fan, W. Sun, G. Ning, T. Wei, Q. Zhang, R. Zhang, L. Zhi and F. Wei, Adv. Funct. Mater., 2012, 22, 2632–2641 CrossRef CAS PubMed.
  45. C. Zhou, Y. Zhang, Y. Li and J. Liu, Nano Lett., 2013, 13, 2078–2085 CrossRef CAS PubMed.
  46. B. G. Choi, M. Yang, W. H. Hong, J. W. Choi and Y. S. Huh, ACS Nano, 2012, 6, 4020–4028 CrossRef CAS PubMed.
  47. J. Chang, M. Jin, F. Yao, T. H. Kim, V. T. Le, H. Yue, F. Gunes, B. Li, A. Ghosh, S. Xie and Y. H. Lee, Adv. Funct. Mater., 2013, 23, 5074–5083 CrossRef CAS PubMed.
  48. Y. C. Chen, Y. G. Lin, Y. K. Hsu, S. C. Yen, K. H. Chen and L. C. Chen, Small, 2014, 10, 3803–3810 CrossRef CAS PubMed.

Footnote

Electronic supplementary information (ESI) available. See DOI: 10.1039/c5ra19323k

This journal is © The Royal Society of Chemistry 2015
Click here to see how this site uses Cookies. View our privacy policy here.