Triethylenetetramine modified multiwalled carbon nanotubes for the efficient preconcentration of Pb(II), Cu(II), Ni(II) and Cd(II) before FAAS detection

Zeid A. ALOthmana, Erkan Yilmazb, Mohamed A. Habilaa, Ibrahim H. Alsohaimia, Abdullah M. Aldawsaria, Nasser M. AL-Harbic and Mustafa Soylak*b
aAdvanced Materials Research Chair, Chemistry Department, College of Science, King Saud University, Riyadh-11451, Kingdom of Saudi Arabia
bErciyes University, Faculty of Sciences, Department of Chemistry, 38039-Kayseri, Turkey. E-mail: soylak@erciyes.edu.tr; Fax: +90 3524374933
cRegional Analytical SABIC T&I, Saudi Basic Industries Corporation, P. O. Box 42503, Riyadh 11551, Kingdom of Saudi Arabia

Received 17th September 2015 , Accepted 24th November 2015

First published on 26th November 2015


Abstract

A novel, accurate and easy separation and preconcentration procedure has been established in the presented work. Triethylenetetramine modified multiwalled carbon nanotubes (TETA-MWCNTs) were prepared and used as an efficient adsorbent for the solid phase extraction of heavy metal ions. This modification of multiwalled carbon nanotubes results in the surfaces of MWCNTs being rich with amino groups, which have a strong interaction with heavy metal ions. The characterization and surface morphology of TETA-MWCNTs were evaluated using FT-IR and SEM. The parameters of the developed solid phase extraction procedure were investigated. The optimum results were obtained at pH 7, and with 8 mL of 3 M nitric acid as the eluent. The LOD values were 3.7 μg L−1, 0.5 μg L−1, 2.4 μg L−1 and 0.3 μg L−1 for Pb(II), Cu(II), Ni(II) and Cd(II), respectively. The relative standard deviations (RSDs) were found to be 1.4%, 4.7%, 2.9% and 4.2% for Pb(II), Cu(II), Ni(II) and Cd(II), respectively. This method was validated by using it for certified reference materials (TMDA-53.3 fortified water and TMDA-64.2 Lake Ontario water). The TETA-MWCNTs were applied for the preconcentration of Pb(II), Cu(II), Ni(II) and Cd(II) from water, cigarette and fertilizer samples.

1. Introduction

Nowadays, heavy metal pollution has become the most dangerous source of health hazards. In addition, heavy metals have been spread across all environments. Hence, to maintain human safety, it is important to monitor heavy metals in environmental samples.1–8 However, the use of high quality instruments, such as for atomic absorption spectroscopy and inductively coupled plasma mass spectroscopy, means that sample pretreatment is needed to purify the samples and to enrich the heavy metals to levels suitable for the instruments’ detection limits.9–14 Among various preconcentration procedures such as liquid–liquid extraction (LLE),15 dispersive liquid–liquid microextraction (DLLME)16 and cloud point extraction (CPE),17 solid phase extraction (SPE) is the most suitable procedure for heavy metal preconcentration. It showed high repeatability and selectivity, was economic and could be used with samples of large volume.18,19 The process depends on two important steps: adsorption of the analyte from a large volume of the sample, and then elution with a suitable solvent. To control these two steps, the selection of an adsorbent with suitable chemical and physical properties is the most important decision. The best adsorbent should be chemically stable under strong acidic conditions, porous, have a high surface area and include functional groups on its surfaces.1,18 MWCNTs have shown superior properties as an adsorbent for heavy metals. They have a high tensile strength and stability in acid and basic medium, as well as the ability to interact with various organic and inorganic analytes.20–26

Tuzen and Soylak used MWCNTs to adsorb chromium(III) and chromium(VI) and they reported a detection limit of 0.90 μg L−1.21 Stafiej and Pyrzynska evaluated carbon nanotubes (CNTs) for the solid phase extraction of some metals including Cu(II), Co(II), Ni(II), Zn(II), Pb(II), Mn(II) and Cd(II).22 Chen et al. investigated single-walled carbon nanotubes (SWCNTs) for the separation of Cu(II), Co(II) and Pb(II) before using inductively coupled plasma mass spectrometry (ICP-MS) and they reported a detection limit of 39, 1.2 and 5.4 μg L−1 for Cu(II), Co(II) and Pb(II), respectively.24 Duran et al. applied multiwalled carbon nanotubes (MWNTs) in the presence of o-cresolphthalein complexone for the preconcentration of some heavy metal ions including copper, cobalt, nickel and lead with a detection limit between 1.64–5.68 μg L−1.25 Tavallali and Fakhraee used l-(2-pyridylazo)-2-naphthol (PAN) with multiwalled carbon nanotubes (MWNTs) for the preconcentration of Cd2+ with a limit of detection of 0.43 μg L−1.26 Skorek et al. developed a dispersive micro-solid-phase extraction (DMSPE) method using multiwalled carbon nanotubes (MWCNTs), combined with energy-dispersive X-ray fluorescence (EDXRF) spectrometry, for the detection of nickel, cobalt, copper, and lead ions in the presence of ammonium pyrrolidine dithiocarbamate (APDC), achieving detection limits of 0.43, 0.11, 0.46 and 0.15 μg L−1 for Co(II), Ni(II), Cu(II), and Pb(II), respectively.27 ALqadami et al. applied MWCNTs for the preconcentration of As, Bi, Cd, Pb, Hg and Ti from cosmetic samples before determination using ICP-AES.28 Their results showed a limit of detection of 2.4, 4.08, 0.3, 2.1, 1.8, and 1.8 ng mL−1 for As, Bi, Cd, Pb, Hg and Ti, respectively. However, the chemical modification of MWCNTs still achieves the most significant improvement in their adsorption capacity.14

This work aimed to firstly use TETA-MWCNT as a novel adsorbent for the efficient solid phase extraction of Pb(II), Cu(II), Ni(II) and Cd(II) from water, cigarette and fertilizer samples. The most important factors have been evaluated, including the pH of the metal solution, eluent type and amount, coexisting ions, initial sample volume and adsorption/recovery.

2. Materials and methods

2.1. Reagents and solutions

Reverse osmosis purified water (18.2 MΩ cm, Millipore) was used for solution preparation. Heavy metal stock solutions with concentrations of 1000 mg L−1 (Sigma, St. Louis) were diluted daily to prepare solutions for all tests. Distilled water was used for the preparation of all solutions. All chemicals were analytical grade. Multiwalled carbon nanotubes and triethylenetetramine disulfate were purchased from Sigma, St. Louis. TMDA-53.3 fortified water and TMDA-64.2 Lake Ontario water (National Water Research Institute, Ontario, Canada) were used as water certified reference materials for trace analyte analysis.

2.2. Instruments

A Perkin-Elmer Model 3110 (Norwalk, CT, USA) flame atomic absorption spectrometer equipped with a hollow cathode lamp (HCL) and an air/acetylene flame as an atomizer was used for the measurements. The flame AAS operating parameters were as follows: wavelength (nm) = 283.3 (Pb), 324.8 (Cu), 232.0 (Ni) and 228.8 (Cd); lamp type = HCl; lamp current = 15 mA for Pb, 15 mA for Cu, 30 mA for Ni, and 12 mA for Cd; air/acetylene flow rate (l min−1) = 9.5/2.3; burner height = 65 mm; slit width = 0.7 nm. The absorbance measurements were performed with the continuous aspiration mode of FAAS.

The FT-IR spectra were recorded on a Perkin-Elmer Spectrum 400 FT-IR spectrometer (Waltham, MA, USA). Scanning electron microscope (SEM) images were obtained on a LEO 440 SEM with an accelerating voltage of 20 kV.

2.3. Preparation of triethylenetetramine modified MWCNTs

The synthesis of triethylenetetramine modified MWCNTs was done according to the steps described in literature studies with some modifications.30,31 In detail, 2 g of MWCNTs was oxidized with 200 mL conc. HNO3 for 18 h at 60 °C. Then the product was filtered, washed with distilled water until the pH of the filtrate became 7. The obtained oxidized MWCNTs were dried overnight in an oven at 60 °C. Thereafter, 1 g of the dry oxidized MWCNTs was reacted with 50 mL of 5% (v/v) thionyl chloride (SOCl2) in toluene, for 3 h at 70 °C, then SOCl2 was removed using a rotary evaporator, and the product washed 3 times with ethanol. Then, the produced MWCNT–CO–Cl was refluxed with 50 mL of (1%) triethylenetetramine disulfate. The product was filtered, washed with ethanol and deionized water and dried overnight in an oven at 60 °C.

2.4. SPE procedure using triethylenetetramine modified MWCNTs (TETA-MWCNTs)

The Pb(II), Cu(II), Ni(II) and Cd(II) solutions with concentrations from 0.01 to 0.05 mg L−1 were adjusted to pH 7 using phosphate buffer solution. Then, the mixture was allowed to pass through a glass column containing 0.2 g of the TETA-MWCNTs which was preconditioned with the same buffer. Then the system was washed with 10 mL of distilled water. After that, the adsorbed heavy metals were eluted with 8 mL of 3 M nitric acid. Then, the concentrations of the analytes in the eluent solution were analysed using a flame atomic absorption spectrometer.

2.5. Application to real samples

For real sample applications, cigarette and fertilizer samples were collected from Kayseri city, Turkey. The obtained samples were washed with distilled water, dried at 80 °C for 48 h, ground, and digested as described in the literature.18 1.0 g of each sample was taken in a Teflon beaker separately and then 20 mL of concentrated nitric acid (65% w/w) was added. The mixture was heated until dry. After cooling, a mixture of concentrated nitric acid (15 mL) and hydrogen peroxide (5 mL) was added; the mixtures were heated until dryness. The digested samples were dissolved in 10 mL of distilled water. Then, the described procedure for SPE given in Section 2.4 was applied for the digested samples.

Water samples including tap water, waste water, sea water, dam water and valley water were collected from Turkey. The water samples were filtered through 0.45 μm membrane filters. Then, the described procedure for SPE given in Section 2.4 was applied for these water samples.

3. Results and discussion

3.1. Characterization of the prepared adsorbent (TETA-MWCNTs)

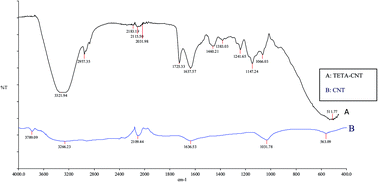
The FT-IR spectra of the multiwalled carbon nanotubes (MWCNTs) and triethylenetetramine modified MWCNTs (TETA-MWCNTs) are shown in Fig. 1. When MWCNTs were modified with triethylenetetramine, several new peaks appeared in the spectrum and they are assigned as follows: the typical bands at 3321 cm−1, 2957, 1725 cm−1, 1637 cm−1, 1460–1383 cm−1 and 1241–1066 cm−1 are due to the OH stretching vibration of COOH (carboxyl group), –CH2 stretching vibration, C[double bond, length as m-dash]O stretching vibration, –NH bending vibration of the NH groups on triethylenetetramine, C–N stretching vibrations and C–O stretching vibrations, respectively.
image file: c5ra19213g-f1.tif
Fig. 1 FT-IR spectra of triethylenetetramine modified carbon nanotubes (A) and multiwalled carbon nanotubes (B).

Information about the surface morphology of the MWCNTs and TETA-MWCNTs can be obtained by studying the scanning electron microscopy (SEM) micrographs that are presented in Fig. 2a and b. The morphology of the MWCNTs and TETA-MWCNTs shows important differences. Especially, the formation of a porous surface for the TETA-MWCNTs is seen. This porous surface morphology of the TETA-MWCNTs provides a large exposed surface area for the adsorption of analytes.


image file: c5ra19213g-f2.tif
Fig. 2 (a) and (b) SEM images of multiwalled carbon nanotubes and triethylenetetramine modified carbon nanotubes.

By the modification of MWCNTs with TETA in the presented work, the surfaces of the MWCNTs are rich with amino groups. These have a strong interaction with heavy metal ions for the adsorption of the analyte elements.

3.2. Development of the SPE using TETA-MWCNTs

Herein, the parameters for optimizing the solid phase extraction (SPE), including the pH of the metal solution, eluent type and amount, coexisting ions, initial sample volume and adsorption/recovery, were evaluated in order to identify the optimum conditions for real sample applications. The prepared TETA-MWCNTs are an amino rich adsorbent and their interaction with heavy metals is expected to be pH dependent. Therefore, the effect of changing the pH of the metal solution from 2 to 7.5 was investigated. Results indicated that at a lower pH, the recovery was low, while at a higher pH of 6 and 7, quantitative recoveries were obtained (Fig. 3). This may be attributed to the strong competition between H+ ions and metal ions in the strong acidic medium, while this effect is lower at a pH of 6 and 7. Based on these results, a pH of 7 was selected for subsequent work and real sample analysis.
image file: c5ra19213g-f3.tif
Fig. 3 Effect of the pH on the recovery of Pb(II), Cu(II), Ni(II) and Cd(II) (N = 3).

For optimization of the desorption conditions to elute the adsorbed metals from the TETA-MWCNT surfaces, different concentrations of hydrochloric acid and nitric acid were tested and the recoveries were investigated (Fig. 4). The results indicate that in the case of using hydrochloric acid, partial recoveries were achieved which is not suitable for preconcentration purposes. While in the case of using nitric acid, quantitative recoveries were achieved with 3 M nitric acid solution. For further optimization, the amount of 3 M nitric acid was investigated by testing with 3, 5 and 8 mL amounts. Quantitative recovery was achieved with 8 mL of 3 M nitric acid. Therefore, 8 mL of 3 M nitric acid was selected for further experiments. TETA-MWCNTs can be used for more than 100 experiments without any loss in their sorption behavior.


image file: c5ra19213g-f4.tif
Fig. 4 Effect of the eluent type and concentration on the recovery of Pb(II), Cu(II), Ni(II) and Cd(II) (N = 3).

When going from standard solutions of heavy metals to real sample applications, complicated matrices retard the extraction procedure. Therefore, a different matrix should be optimized.29,32–41 In order to evaluate the effect of the presence of coexisting ions on the recoveries of Pb(II), Cu(II), Ni(II) and Cd(II), matrix ions have been tested. The calculated recoveries in each case are presented in Table 1. It can be concluded from these results that the developed SPE procedure was generally applicable in the presence of the tested ions. This confirms that the developed SPE procedure is matrix-independent.

Table 1 Effect of matrix ions on the recovery of Pb(II), Cu(II), Ni(II) and Cd(II) (N = 3)
Coexisting ion Na(I) K(I) Fe(III) Cr(III) Ca(II) SO42− Cl CO32− Al(III) Hg(II) Mn(II) Zn(II) F
Added as NaNO3 KCl Fe(NO3)3·9H2O Cr(NO3)3·6H2O CaCl2 Na2SO4 KCl Na2CO3 Al(NO3)3·7H2O Hg(NO3)2·6H2O Mn(NO3)2·6H2O Zn(NO3)2·6H2O NaF
Concentration (mg L−1) 20[thin space (1/6-em)]000 1000 20 10 200 200 1000 800 10 10 10 10 500
Recovery % Pb(II) 92 ± 0 98 ± 6 97 ± 3 94 ± 3 96 ± 8 92 ± 6 98 ± 3 98 ± 7 97 ± 5 93 ± 7 103 ± 5 106 ± 8 98 ± 6
Cu(II) 96 ± 3 95 ± 3 100 ± 4 96 ± 0 98 ± 5 98 ± 2 94 ± 0 95 ± 5 86 ± 4 100 ± 6 98 ± 3 96 ± 4 95 ± 3
Ni(II) 99 ± 1 89 ± 2 91 ± 6 86 ± 4 95 ± 0 90 ± 1 95 ± 4 95 ± 5 80 ± 5 95 ± 6 66 ± 2 68 ± 3 89 ± 2
Cd(II) 96 ± 2 90 ± 4 94 ± 2 98 ± 2 98 ± 3 97 ± 0 94 ± 1 94 ± 2 79 ± 6 100 ± 6 73 ± 2 93 ± 3 90 ± 4


As the pre-concentration factor increases, the efficiency of the extraction procedure is improved. The preconcentration factor is calculated based on the initial sample volume and the final eluent volume. In the proposed work, the sample volume was evaluated at different intervals including 25, 50, 100, 250, 500, 750, 900 and 1000 mL. The results shown in Fig. 5 revealed that the developed SPE procedure is efficient and quantitative recovery can be obtained up to 900 mL. Therefore, the pre-concentration factors were calculated as 113 for Pb(II), Cu(II), Ni(II) and Cd(II), when using 8 mL of 3 M nitric acid as the eluent.


image file: c5ra19213g-f5.tif
Fig. 5 Effect of sample volume on the recovery of Pb(II), Cu(II), Ni(II) and Cd(II) (N = 3).

3.3. Analytical features

One of the most important features of SPE is the limit of detection (LOD). Therefore, the optimized conditions were applied, and the LOD (N = 7) was calculated based on eqn (1)
 
image file: c5ra19213g-t1.tif(1)
where STD is the standard deviation of seven blank readings, and PF is the pre-concentration factor. The analytical performances of the presented method are given in Table 2. With a 100 mL sample volume and with 3 parallel columns, at a sample flow rate of 5.0 mL min−1, a sampling frequency of 8 h−1 was obtained.
Table 2 Analytical performances of the methoda
  LOD (μg L−1) RSDs (%) Calibration curve Linear range (mg L−1)
a A = absorbance value obtained using FAAS, C = concentration of analyte, mg L−1.
Pb(II) 3.7 1.4 A = 0.0006 + 0.007C 1.0–20.0
Cu(II) 0.5 4.7 A = −0.0045 + 0.039C 0.5–10.0
Ni(II) 2.4 2.9 A = 0.0084 + 0.020C 0.5–10.0
Cd(II) 0.3 4.2 A = 0.018 + 0.094C 0.1–6.0


The determination of Pb(II), Cu(II), Ni(II) and Cd(II) in TMDA-53.3 fortified water and TMDA-64.2 Lake Ontario water certified reference materials was applied to evaluate the developed SPE procedure. The results shown in Table 3 indicate that the recovered concentrations were in agreement with the concentrations in the certified reference materials. Furthermore, the addition/recovery methods were performed under optimized conditions. The results in Table 4 show that the quantitative recovery was never less than 97%.

Table 3 Determination of Pb(II), Cu(II), Ni(II) and Cd(II) in TMDA-53.3 and TMDA-64.2 certified reference materials (N = 3)
  TMDA-53.3 fortified water TMDA-64.2 Lake Ontario water
Certified value, μg L−1 Found, μg L−1 Recovery, % Certified value, μg L−1 Found, μg L−1 Recovery, %
Pb(II) 349 340 ± 11 97 286 300 ± 9 105
Cu(II) 308 299 ± 1 97 270 263 ± 1 97
Ni(II) 311 329 ± 5 106 260 260 ± 5 100
Cd(II) 118 122 ± 2 103 264 262 ± 2 99


Table 4 Addition and recovery of analytes from tap water (N = 3)
Analyte Added, μg L−1 Found, μg L−1 Recovery, %
a BDL: below the detection limit.
Pb(II) 0.0 BDLa
1.0 1.00 ± 0.12 100
3.0 3.02 ± 0.12 101
Cu(II) 0.0 0.03 ± 0.005
0.1 0.09 ± 0.00 97
0.2 0.20 ± 0.01 100
Ni(II) 0.0 0.30 ± 0.06
2.8 2.80 ± 0.09 100
5.0 5.43 ± 0.09 100
Cd(II) 0.0 BDL  
1.3 1.29 ± 0.07 100
2.4 2.39 ± 0.10 100


As urgent research has been devoted to the monitoring of elements at trace levels in environmental samples in order to avoid human exposure,9,42–45 the proposed SPE procedure was applied for the preconcentration of Pb(II), Cu(II), Ni(II) and Cd(II), from water, cigarette and fertilizer samples. The concentrations of Pb(II), Cu(II), Ni(II) and Cd(II), are given in Table 5. The results reveal the suitability and applicability of the developed SPE procedure for real samples with different matrix mediums.

Table 5 Determination of analyte elements in water, cigarette and fertilizer samples (N = 3)
Analyte Water samples, μg L−1 Cigarette, mg kg−1 Fertilizer, mg kg−1
Waste water Sea water Dam water Valley water
a BDL: below the detection limit.
Pb(II) 110 ± 4 140 ± 3 80 ± 2 BDLa BDL BDL
Cu(II) 4.0 ± 0.0 7.0 ± 0.0 6.0 ± 0.0 2.0 ± 0.0 0.8 ± 0.0 BDL
Ni(II) 90 ± 3 8.0 ± 0.5 120 ± 1 6.0 ± 0.1 3.0 ± 0.1 4.0 ± 0.1
Cd(II) 150 ± 1 190 ± 2 150 ± 1 7.0 ± 0.0 3.0 ± 0.1 BDL


A comparison between preconcentration work in the literature and the presented work is given in Table 6. The procedure presented is simple and accurate for the preconcentration and flame atomic absorption spectrometric determination of lead, copper, nickel and cadmium at trace levels. The obtained LODs and preconcentration factors are generally better than those obtained using some presented methods given in Table 6.

Table 6 Comparison between the developed SPE procedure and other methods from the literature
Technique Instrument Preconcentration factor LOD (μg L−1) Ref.
SPE/L-cysteine functionalized multi-walled carbon nanotubes (MWCNTs-cysteine) FAAS 33 Cd: 0.28 11
SPE/multiwalled carbon nanotubes impregnated with 4-(2-thiazolylazo)resorcinol FAAS 15 Pb: 7.2, Ni: 4.3, Zn: 1.1, Cd: 2.8 18
Coprecipitation/-(2-hydroxybenzylideneamino)-1,2-dihydro-2,3-dimethyl-1-phenylpyrazol-5-one FAAS 100 Pb: 1.2, Cu: 0.5, Cr: 0.2, Zn: 0.7 33
Dispersive liquid–liquid microextraction with sodium diethyldithiocarbamate FAAS Cd: 20 ng g−1, Pb: 140 ng g−1 46
SPE/triethylenetetramine modified multiwalled carbon nanotubes (TETA-MWCNTs) FAAS 113 Pb: 3.7, Cu: 0.5, Ni: 2.4, Cd: 0.3 This work


4. Conclusion

The modification of multiwalled carbon nanotubes with triethylenetetramine has led to an improvement in their application as a solid phase extraction (SPE) sorbent. This can be attributed to the presence of amino groups which have strong interactions with heavy metals such as Pb(II), Cu(II), Ni(II) and Cd(II). The optimum conditions for the application of this adsorbent (TETA-MWCNTs) for SPE were found to be pH 7, and with 8 mL of 3 M nitric acid used as the eluent. Quantitative recoveries were achieved up to a sample volume of 900 mL. The preconcentration factor was 113. The developed SPE was applied for the determination of Pb(II), Cu(II), Ni(II) and Cd(II) in water, cigarette and fertilizer samples.

Acknowledgements

The authors extend their sincere appreciation to the Deanship of Scientific Research at King Saud University for funding this Prolific Research Group (PRG-1436-04).

References

  1. M. Yabanli and Y. Alparslan, Bull. Environ. Contam. Toxicol., 2015, 95, 494–498 CrossRef CAS PubMed.
  2. M. Soylak and Y. E. Unsal, J. AOAC Int., 2009, 92, 1219–1224 CAS.
  3. X. Zhao, N. Song, Q. Jia and W. Zhou, Microchim. Acta, 2009, 166, 329–335 CrossRef CAS.
  4. S. Sungur and F. Gulmez, J. Spectrosc., 2015, 640271 Search PubMed.
  5. M. Ghaedi, K. Niknam, K. Taheri, H. Hossainian and M. Soylak, Food Chem. Toxicol., 2010, 48(3), 891–897 CrossRef CAS PubMed.
  6. M. Soylak and L. Elci, Int. J. Environ. Anal. Chem., 1997, 66, 51–59 CrossRef CAS.
  7. M. Soylak, I. Narin and M. Dogan, Anal. Lett., 1997, 30, 2801–2810 CrossRef CAS.
  8. M. Soylak and L. Elci, J. Trace Microprobe Tech., 2000, 18, 397–403 CAS.
  9. M. Soylak, S. Saracoglu, L. Elci and M. Dogan, Int. J. Environ. Anal. Chem., 2002, 82, 225–231 CrossRef CAS.
  10. M. D. Farahani, F. Shemirani, N. F. Ramandi and M. Gharehbaghi, Food Analytical Methods, 2015, 8, 1979–1989 CrossRef.
  11. Y. Liu, Y. Li and X.-P. Yan, Adv. Funct. Mater., 2008, 18, 1536–1543 CrossRef CAS.
  12. Y. Liu, J. Hu, Y. Li, H.-P. Wei, X.-S. Li, X.-H. Zhang, S.-M. Chen and X.-Q. Chen, Talanta, 2015, 134, 16–23 CrossRef CAS PubMed.
  13. Y. Liu, Y. Li and L. Yang, Microchem. J., 2012, 104, 56–61 CrossRef CAS.
  14. H. A. El-Sheikh and J. A. Sweileh, Jordan J. Chem., 2011, 6, 1–16 Search PubMed.
  15. M. Tuzen, K. O. Saygi and M. Soylak, J. Hazard. Mater., 2008, 156, 591–595 CrossRef CAS.
  16. Z. A. ALOthman, M. Habila, E. Yilmaz and M. Soylak, Desalin. Water Treat., 2013, 51, 6770–6776 CrossRef CAS.
  17. J. R. Chen, S. M. Xiao, X. H. Wu, K. M. Fang and W. H. Liu, Talanta, 2005, 67, 992–996 CrossRef CAS PubMed.
  18. Z. A. ALOthman, M. Habila, E. Yilmaz and M. Soylak, Microchim. Acta, 2012, 177, 397–403 CrossRef CAS.
  19. K. Pyrzynska, Sep. Purif. Rev., 2008, 37, 372–389 CrossRef CAS.
  20. M. Valcarcel, S. Cardenas, B. M. Simonet, Y. Moliner-Martinez and R. Lucena, Trends Anal. Chem., 2008, 27, 34–43 CrossRef CAS.
  21. M. Tuzen and M. Soylak, J. Hazard. Mater., 2007, 147, 219–225 CrossRef CAS PubMed.
  22. A. Stafiej and K. Pyrzynska, Microchem. J., 2008, 89, 29–33 CrossRef CAS.
  23. M. Soylak and Y. E. Unsal, Int. J. Environ. Anal. Chem., 2011, 91, 440–447 CrossRef CAS.
  24. S. Chen, C. Liu, M. Yang, D. Lu, L. Zhu and Z. Wang, J. Hazard. Mater., 2009, 170, 247–251 CrossRef CAS PubMed.
  25. A. Duran, M. Tuzen and M. Soylak, J. Hazard. Mater., 2009, 169, 466–471 CrossRef CAS PubMed.
  26. H. Tavallali and V. Fakhraee, Int. J. ChemTech Res., 2011, 3, 1628–1634 CAS.
  27. R. Skorek, B. Zawisza, E. Marguı, I. Queralt and R. Sitko, Appl. Spectrosc., 2013, 67, 204–209 CrossRef CAS PubMed.
  28. A. A. ALqadami, M. A. Abdalla, Z. A. ALOthman and K. Omer, Int. J. Environ. Res. Public Health, 2013, 10, 361–374 CrossRef CAS PubMed.
  29. Z. A. AlOthman, Y. E. Unsal, M. Habila, M. Tuzen and M. Soylak, Desalin. Water Treat., 2015, 53, 3457–3465 CrossRef CAS.
  30. P. Santhosh, K. M. Manesh, A. Gopalan and K. P. Lee, Sens. Actuators, B, 2007, 125, 92–99 CrossRef CAS.
  31. Z. Jianzhong, J. Yang and B. Deng, Environ. Chem. Lett., 2010, 8, 277–282 CrossRef.
  32. M. Soylak, S. Saracoglu and L. Elci, Trace Elem. Electrolytes, 2003, 20, 160–165 CrossRef CAS.
  33. A. A. Gouda, Talanta, 2016, 146, 435–441 CrossRef CAS PubMed.
  34. M. Soylak and O. Ercan, J. Hazard. Mater., 2009, 168, 1527–1531 CrossRef CAS PubMed.
  35. A. Bazmandegan-Shamili, A. M. Haji Shabani, S. Dadfarnia, M. Saeidi and M. R. Moghadam, Turk. J. Chem., 2015, 39, 1059–1068 CrossRef.
  36. A. Duran, M. Soylak and S. A. Tuncel, J. Hazard. Mater., 2008, 155, 114–120 CrossRef CAS PubMed.
  37. V. M. P. Barbosa, A. F. Barbosa, J. Bettini, P. O. Luccas and E. C. Figueiredo, Talanta, 2016, 147, 478–484 CrossRef CAS PubMed.
  38. B. Barfi, M. Rajabi and A. Asghari, Biol. Trace Elem. Res., 2016 DOI:10.1007/s12011-015-0489-y.
  39. M. Manoochehri, A. A. Asgharinezhad and M. Safaei, J. Chromatogr. Sci., 2015, 53, 1000–1006 Search PubMed.
  40. H. B. Senturk, A. Gundogdu, V. N. Bulut, C. Duran, M. Soylak, L. Elci and M. Tufekci, J. Hazard. Mater., 2007, 149, 317–323 CrossRef CAS PubMed.
  41. M. Amoli-Diva, K. Pourghazi and S. Hajjaran, Mater. Sci. Eng., C, 2016, 60, 30–36 CrossRef CAS PubMed.
  42. Z. A. AlOthman, A. Hashem and M. A. Habila, Molecules, 2011, 16, 10443–10456 CrossRef PubMed.
  43. Z. A. AlOthman, Y. E. Unsal, M. Habila, A. Shabaka, M. Tuzen and M. Soylak, Anal. Lett., 2015, 48, 1738–1750 CrossRef CAS.
  44. M. Ghaedi, F. Ahmadi, Z. Tavakoli, M. Montazerozohori, A. Khanmohammadi and M. Soylak, J. Hazard. Mater., 2008, 152, 1248–1255 CrossRef CAS PubMed.
  45. A. Tunceli, G. Ocak, O. Acar and A. R. Turker, Int. J. Environ. Anal. Chem., 2015, 95, 1395–1411 CrossRef CAS.
  46. F. C. Rosa, F. A. Duarte, J. N. G. Paniz, G. M. Heidrich, M. A. G. Nunes, E. M. M. Flores and V. L. Dressler, Microchem. J., 2015, 123, 211–217 CrossRef CAS.

This journal is © The Royal Society of Chemistry 2015