
Solar photocatalytic ozonation of emerging contaminants detected in municipal wastewater treatment plant effluents by magnetic MWCNTs/TiO2 nanocomposites†
Lian Yu*a,
Dongsheng Wangb and
Daiqi Yea
aCollege of Environment and Energy, South China University of Technology, Guangzhou 510006, China. E-mail: yulian1987@126.com; Fax: +86 02039380519; Tel: +86 02039380519
bState Key Laboratory of Environmental Aquatic Chemistry, Research Center for Eco-Environmental Sciences, Chinese Academy of Sciences, P. O. Box 2871, Beijing 100085, China
First published on 6th November 2015
Abstract
Magnetically separable catalysts with high solar photocatalytic ozonation activity were successfully synthesized. First maghemite and then titania (anatase) nanoparticles were deposited onto the multiwalled carbon nanotubes (MWCNTs) by co-precipitation and sol–gel methods. The synthesized catalysts were characterized by XRD, N2 adsorption/desorption, TEM, XPS and VSM, and were applied for the removal of emerging contaminants (ECs) existing in urban wastewater through photocatalytic ozonation. Ozone alone can completely remove a mixture of the four ECs in water, but the mineralization degree was very low (44.9%). Photocatalytic oxidation led to a higher level of mineralization (48.3% TOC removal) in the experimental conditions, but some intermediate products such as phenolic compounds and carboxylates which are toxic and difficult to degrade were generated during the photocatalytic oxidation process. Photocatalytic ozonation led to the highest removal efficiency for TOC (65.7%), which suggested a lower concentration of intermediate products accumulated during photocatalytic ozonation, the integration of ozonation and solar photocatalytic oxidation improved the mineralization efficiency.
1. Introduction
Emerging contaminants (ECs) are a group of synthetic compounds that have been recently detected in environmental waters. Although some inorganics, such as nanomaterials, can be considered as ECs, in most cases, ECs are organics, such as pharmaceuticals, perfluorinated compounds, hormones, endocrine disruptors, drinking water disinfection byproducts, sunscreens, algal toxins, pesticides and their degradation byproducts.1–3 In recent years, the concentration of ECs that are detected in environmental waters was tens of μg L−1.4–6 ECs can lead to a lot of risks, such as sterility, feminization of aquatic organisms and bacterial resistance, so ECs must be removed from environmental waters.Recently, a lot of technologies are designed to remove ECs from water. They include advanced oxidation processes (AOPs) (combining strong oxidants, e.g. H2O2, with high energy sources, e.g. ultrasound (US) or ultraviolet (UV), and catalysts, e.g. photocatalysts (e.g. TiO2) or Fe2+, to produce hydroxyl radicals), membrane based technologies (nanofiltration, microfiltration, ultrafiltration and reverse osmosis), adsorption (e.g. active carbon) and ion exchange processes (e.g. resins).7 Special attention has been paid to AOPs, in which the generated hydroxyl radicals (˙OH) can oxidate almost any organic molecules.7 Among AOPs, heterogeneous photocatalysis (UV/TiO2) has attracted extensive attention for wastewater treatment.8 The main drawback of heterogeneous photocatalysis is the highly operating costs resulting from electricity for the UV lamps used in photocatalysis. Therefore, more and more researches focused on photocatalysis that can be driven by sunlight.9 Despite the great potential of solar photocatalytic oxidation, some drawbacks (such as long hydraulic detention time) have limited its practical use. A novel process, which combines solar photocatalysis and ozone, can overcome these drawbacks, as it can significantly increase the degradation rate of ECs.10 The reason for this is likely due to the adsorption of ozone onto the TiO2 surface where it can trap electrons generated from the conduction band of TiO2, thus avoiding ineffective electron–hole recombination, and at the same time generating ozonide radicals (˙O3−), which can be further transformed into hydroxyl radicals.11–13
Carbon nanotubes (CNTs), due to their specific physical, chemical and electronic properties, have been used for advanced applications, such as catalysts or reinforcements in composite materials,14–17 CNTs are also excellent supports for photocatalysts.18,19 Taking advantage of the unique properties of MWCNTs, it has been indicated that MWCNTs can promote the charge separation by trapping the electrons that transferred from TiO2, thus hindering charge recombination.20 The application of carbon materials for TiO2 photodegradation of pollutants has been reported, the enhanced performance of carbon/TiO2 composites can be attributed to several factors, such as the improvement of visible light absorption, the interfacial electronic effects, the porosity of the carbon supports and the intrinsic photocatalytic activity of certain carbons.19,21–24 Another drawback of heterogeneous photocatalysis is that it is difficult to remove the photocatalysts from water after the treatment. Compared with centrifugation and filtration, magnetic separation is considered as a rapid and effective method to separate nanomaterials from aqueous solution. The decoration of MWCNTs with magnetic nanoparticles (such as magnetite and maghemite) may be a promising method to separate MWCNTs from aqueous solution.
In this study, we report the preparation of a magnetic photocatalyst (MWCNTs/TiO2) which incorporates anatase TiO2 nanoparticles onto magnetic MWCNTs. The nanocomposites were characterized and used to degrade four pharmaceutical compounds (selected as model ECs), i.e., atenolol (ATL), hydrochlorothiazide (HCT), ofloxacin (OFX) and trimethoprim (TMP), which are frequently detected in WWTPs' effluents and surface waters. Simulated solar-light was used as radiation source and the removal efficiency of photocatalytic ozonation was investigated and compared with those obtained from other AOPs, such as photolysis (solar radiation), conventional ozonation (O3) and solar photocatalytic oxidation (catalyst/solar radiation). After the treatment, the magnetic MWCNTs/TiO2 could be separated from the aqueous solution by an external magnetic field due to the superparamagnetic behavior.
2. Experimental
2.1. Photocatalyst synthesis
The MWCNTs used in this study were purchased from Chengdu Institute of Organic Chemicals, Chinese Academy of Science. MWCNTs were of the following specifications: purity, >95%; outer diameter, 30–50 nm; inside diameter, 5–10 nm; length, 10–20 μm. The purification process was performed to remove impurities and modify the surface of MWCNTs with carbonyl and hydroxyl groups. The purification process was accomplished by refluxing with concentrated nitric acid at 70 °C for 12 h under stirring conditions. The product was filtered and washed with distilled water, and then dried overnight at 60 °C under vacuum conditions.Magnetic MWCNTs/TiO2 (MCT) photocatalyst was prepared following the method described previously, which comprises mainly two steps.25 The first step was the synthesis of magnetic γ-Fe2O3/MWCNTs using the co-precipitation and subsequent oxidation method reported by Gupta et al.26 A mixed solution of ferric chloride hexahydrate (0.10 M) and ferrous chloride tetrahydrate (0.05 M) was prepared. Subsequently, a specific amount of purified MWCNTs was added in the mixed solution and stirred for 2 h. Then, at the temperature of 70 °C, NH4OH (5.00 M) solution was added drop wise to precipitate iron oxides. The pH of the mixture was adjusted to 10.0 and then aged for 1 h under stirring. The product was separated by a magnet, and then washed with distilled water and ethanol for several times, respectively. The obtained composite was dried overnight at 60 °C under vacuum conditions and then calcined in a muffle furnace at 250 °C for 2 h. The second stage was the synthesis of magnetic MWCNTs/TiO2 nanocomposites through a sol–gel method.27 A specific amount of γ-Fe2O3/MWCNTs was added into a mixture of Ti(OBu)4 (10.0 mL), anhydrous ethanol (30.0 mL) and anhydrous acetic acid (3.0 mL). The mixture was sonicated for 30 min to prepare the titanium precursor (labeled as solution A). 6.0 mL anhydrous ethanol and 5.0 mL acetic acid were diluted with 5.0 mL distilled water to get a mixed solution (labeled as solution B). Solution A was stirred vigorously for 30 min at 25 °C followed by dropwise addition of solution B to initiate the hydrolysis reaction. The pH value of the mixed solution was controlled by acetic acid. The obtained colloidal solution was stirred for 2 h to form sol, and then aged for 12 h to produce the corresponding gelatin. The gelatin was dried at 90 °C for 12 h in an oven, then the grayest crystals were obtained. After calcined at 400 °C in a flow of nitrogen for 2 h, the obtained powder was magnetic MWCNTs/TiO2 photocatalyst.
2.2. Characterization of the catalysts
Transmission electron microscope (TEM, JEOL-2010) was used to characterize the morphology of the catalysts and the distribution of γ-Fe2O3 and TiO2 nanoparticles on MWCNTs. The crystalline phase of the synthesized samples was determined by X-ray diffraction (XRD, Phillips PW 1050-3710 Diffractometer) with Cu Kα radiation (λ = 1.5406 Å). The magnetization curves of the catalysts were determined by a vibrating sample magnetometer (VSM, Quantum Design MPMS-5S). The surface properties of the catalysts were tested using N2 adsorption–desorption experiments at 77 K. The surface area was calculated by the standard Brunauer–Emmett–Teller (BET) equation. All of the calculations were performed using a surface area and porosimeter system (ASAP 2010, Micromeritics). X-ray photo-electron spectroscopy (XPS, Thermo Fisher Scientific) with monochromatic Al Kα X-ray radiation (at 1486.71 eV) was used to identify the oxidation states of the elements in catalysts.2.3. Photocatalytic ozonation experiments
Fig. 1 depicts the schematic of the experimental setup used to carry out ozonation, photocatalytic oxidation and photocatalytic ozonation experiments. Photocatalytic ozonation experiments were conducted in a semi-batch mode, the laboratory-scale system consisted of a 1.0 L glass-made cylindrical reactor, a gas inlet, a gas outlet, and a liquid sampling port. The reactor was placed in a chamber with a commercial solar simulator (Suntest CPS, Atlas), which is a 1500 W air-cooled Xe lamp with emission wavelengths over 300 nm because of the application of quartz and glass cut-off filters. The irradiation intensity was kept at 550 W m−2, and the temperature of the reaction system was maintained between 25 and 40 °C throughout the experiments. If required, an ozone generator (Anseros Ozomat ComAD-02) was used to generate ozone which was supplied to the reactor, the concentration of ozone was recorded with a gas analyzer (Anseros Ozomat GM-6000Pro). | ||
| Fig. 1 Experimental setup for solar photocatalytic ozonation experiments. | ||
In a typical photocatalytic ozonation experiment, the reactor was first loaded with 800 mL of aqueous solution containing a certain concentration of the mixture of ATL, HCT, OFX, TMP. Then, 0.2 g of the catalyst was added, and the suspension was stirred in the darkness for 120 min while bubbling air to the system. After this dark stage, the Xe lamp was switched on, and simultaneously, a mixture of ozone-oxygen (6.0 mg L−1 ozone concentration) was fed to the reactor at a flow rate of 20 L h−1. Samples were taken from the reactor at specified intervals and filtered through 0.45 μm PET membrane to remove the catalyst. Adsorption (i.e. absence of radiation and ozone), single ozonation (i.e. absence of radiation and catalyst), and photolytic oxidation (i.e. absence of radiation, catalyst and ozone) experiments were also carried out for comparative analysis.
Concentration of ATL, HCT, OFX and TMP was determined by HPLC with a Waters 2487 UV Detector and Phenomenex Gemini C18 column (5 μm, 150 mm × 3.0 mm). Elution of pharmaceuticals was in gradient form at 0.5 mL min−1 with two solvents: acidified water (0.1% phosphoric acid) (A) and acetonitrile (B). ATL, TMP, HCT and OFX were detected at 225, 286, 271 and 290 nm with retention times 4.2, 9.8, 11.5 and 18.7 min, respectively. The concentration of total phenol was determined by Folin–Ciocalteau method and was expressed as equivalent OFX.28 TOC was measured by direct injection of filtered samples (Millipore-PVDF 0.45 mm filters) into a TOC analyser (Shimadzu-5050A). Ammonium concentration was determined with a Dionex DX-120 ion chromatograph equipped with a Dionex Ionpac CS12A 4 × 250 mm column. The concentrations of some inorganic anions (F−, Cl−, NO3−, NO2−, and SO42−) and some carboxylates (acetate, oxalate, propionate, formate, maleate and pyruvate) were measured with a Dionex DX-600 ion chromatograph using a Dionex Ionpac AS11-HC 4 × 250 mm column. The concentration of dissolved ozone was measured by the indigo colorimetric method.28
3. Results and discussion
3.1. Characterization of the catalysts
Fig. 2 shows the XRD patterns of MWCNTs, γ-Fe2O3, TiO2 and MCT. The strong graphite peak of plane (002) at 2θ = 25.8° can be seen in the XRD patterns of the treated MWCNTs. The other diffraction peaks related to MWCNTs at the angle 2θ of 42.7°, 43.9°, 53.5° and 77.5° can be indexed to the (100), (101), (004) and (110) planes of MWCNTs, suggesting that the structure of MWCNTs was not destroyed after being treated by HNO3. XRD pattern of MCT shows diffraction peaks at 25.4°, 37.9°, 47.9°, 54.4° and 62.8°, which confirms the presence of anatase in the catalyst. γ-Fe2O3 or Fe3O4 species could also be identified (these two can't be distinguished by XRD) in the XRD patterns of MCT with main diffraction peaks at 30.2°, 35.6°, 43.1° and 57.0°.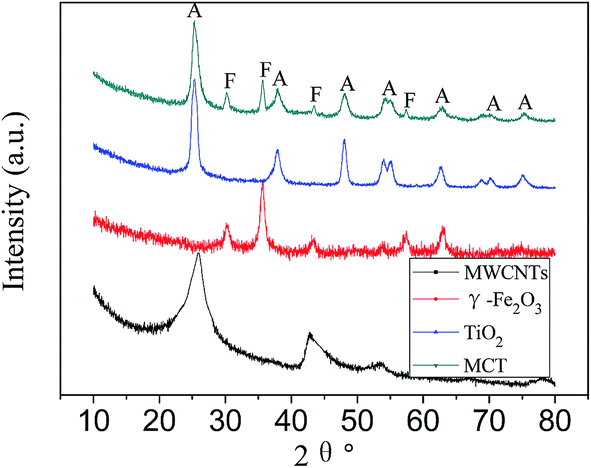 | ||
| Fig. 2 XRD patterns of MWCNTs, γ-Fe2O3, TiO2 and magnetic MWCNTs/TiO2 (MCT). Crystalline phase detected: anatase (A), magnetite/maghemite (F). | ||
Fig. 3 shows N2 adsorption/desorption isotherms where it can be noticed that all the three samples displayed type II isotherms. A wide hysteresis area of the isotherms can be seen in the case of the three samples, suggesting the wide distributions of pore sizes in both cases, this can be due to the agglomeration of MWCNTs, or agglomeration of γ-Fe2O3 and TiO2 on the surface of MWCNTs. The pore volume of MCT was lower than that of MWCNTs, which suggests that iron oxides and TiO2 nanoparticles might block some pore channels of MWCNTs. The specific surface area of MWCNTs, magnetic MWCNTs and MCT were calculated to be 207.35, 122.27 and 115.81 m2 g−1, respectively.
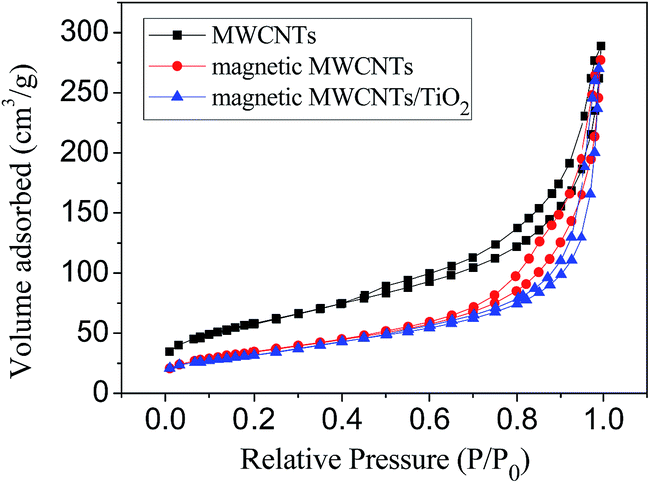 | ||
| Fig. 3 Nitrogen adsorption/desorption isotherms of MWCNTs, magnetic MWCNTs and MCT. | ||
Some short MWCNTs can be seen in Fig. 4a, indicating that, in some situations, the damage extended beyond the outermost graphene sheet and into the underlying sidewalls. As can be seen from Fig. 4b, γ-Fe2O3 nanoparticles grow around the MWCNTs surface. As shown in Fig. 4c, TiO2 nanoparticles were loaded homogeneously on the surface of magnetic MWCNTs with the diameter of 50–80 nm, most γ-Fe2O3 nanoparticles were covered by TiO2 nanoparticles. These results indicated the successful co-incorporation of the two types of nanoparticles on the MWCNTs surface.
 | ||
| Fig. 4 TEM images of the treated MWCNTs (a), γ-Fe2O3/MWCNTs (b) and MCT (c). | ||
Surface chemical composition of the catalyst was analyzed by XPS and the results are presented in Fig. 5. XPS full spectrum of MCT confirmed the presence of C, Ti, O and Fe on the surface of the catalyst (see Fig. 5a). Fig. 5b displays the high-resolution Ti 2p XPS spectrum of the catalyst. The binding energy peaks at 459.2 and 464.9 eV can be attributed to the spin–orbit splitting of the Ti 2p components (Ti 2p3/2 and Ti 2p1/2), which confirms the presence of Ti as Ti4+ (TiO2).29 Fig. 5c shows the high resolution Fe 2p XPS spectrum of the catalyst. The peaks at 710.9 and 724.7 eV can be attributed to Fe 2p3/2 and Fe 2p1/2, respectively, indicating the existence of Fe3+. In addition, the presence of satellite peak at ca. 718.8 eV further confirmed the existence of Fe3+ iron species.18
 | ||
| Fig. 5 XPS full spectrum of magnetic MWCNTs/TiO2 (a), high-resolution XPS spectra of Ti 2p (b) and Fe 2p (c) spectral regions. | ||
Fig. 6 illustrates the magnetization hysteresis loop of MCT, the measured saturation magnetization value was 4.63 emu g−1, which was weaker than that of γ-Fe2O3 (58.83 emu g−1). The decrease of the saturation magnetization could be ascribed to the existence of nonmagnetic TiO2 and MWCNTs in MCT. But the saturation magnetization (4.63 emu g−1) was still sufficient to achieve fast solid–liquid separation under an external magnetic field. It can also be seen that the catalyst showed zero remanent magnetization and coercitivity, indicating superparamagnetic behavior of the catalyst, so the catalyst could be re-dispersed well in water for reuse after being separated by the external magnetic field.
 | ||
| Fig. 6 Magnetization vs. applied magnetic field at 25 °C of MCT. | ||
3.2. Ozonation
The ozonation experiments were carried out in the pH range of 3.0–9.0. It can be seen from Fig. 7 that pH has an important effect on the ozonation which is due to two contributions: (1) the higher direct ozone reactivity of ionized forms of pharmaceuticals studied (ATL, pKa = 9.6; HCT, pKa = 7.9; OFX, pKa = 6.1, 8.2; TMP, pKa = 3.2, 7.1); (2) the possible contribution of hydroxyl radical at elevated pH. In aqueous solution, ATL, HCT, OFX and TMP were completely degraded in 60 min ozonation, as can be observed in Fig. 7a–d. ATL, HCT and OFX showed a high degradation rate in alkaline conditions, while TMP showed a high degradation rate in acidic conditions. The difference observed can be explained by the different oxidation mechanisms of ozone. Generally, when the solution pH is below 4.0, the generation of ˙OH is limited and the direct ozonation of organics plays an important role, whereas, both direct ozonation and ˙OH mechanism occur in pH range of 4.0–9.0. When the solution pH is above 9.0, ˙OH generation is predominant.30,31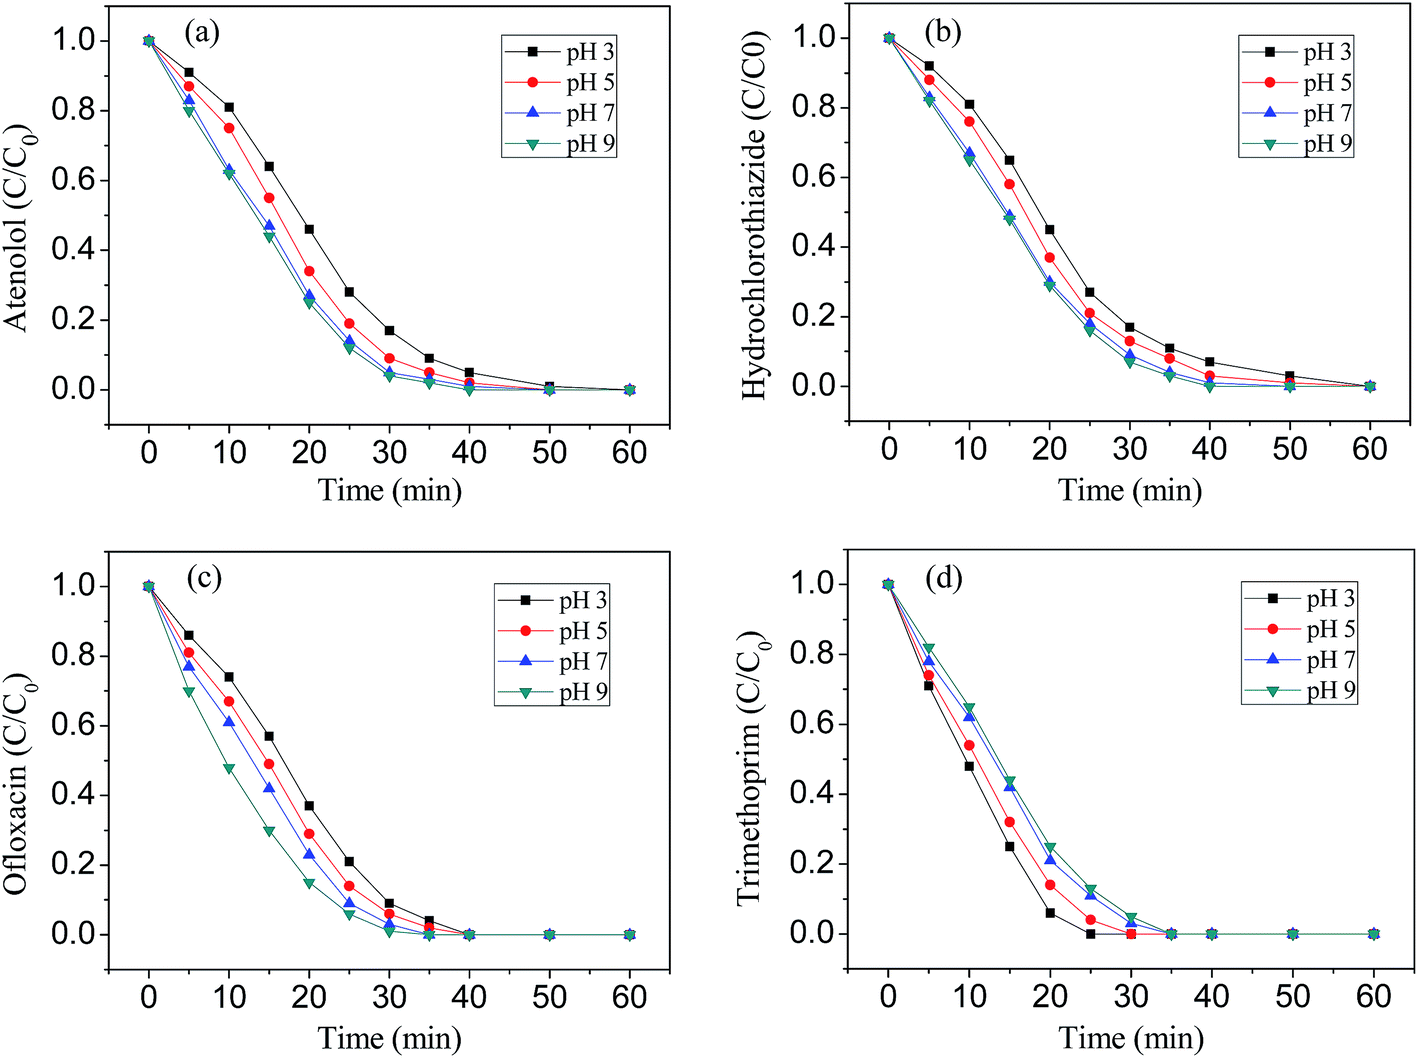 | ||
| Fig. 7 Degradation of atenolol (a), hydrochlorothiazide (b), ofloxacin (c), trimethoprim (d) by ozonation at pH 3.0–9.0 in aqueous solution. Initial conditions: 800 mL, [∑EC]0 = 40 mg L−1 (10 mg L−1 for each EC), applied ozone mass flow rate, 20.0 L h−1, temperature 25 ± 2 °C. | ||
Ozone is a selective electrophile and the investigated pharmaceuticals have two reactive sites: aromatic rings and a second amine moiety.32 As is well known, the reactions between aromatic groups and ozone are independent of the pH.32 However, the reactions between secondary amine moieties and ozone, or even hydroxyl radicals are pH-dependent (i.e. pKa-dependent), since they are proved to be non-reactive when protonated.33 The degradation of TMP was unfavorable in alkaline pH. A possible explanation is related to the production of the degradation products, such as organic acids which may compete ozone with TMP, or even the formation of free-radical scavengers which can quench the ˙OH, and these all can reduce the degradation rate of TMP. A similar result was also discovered by Li et al.34 and Tay et al.35
3.3. Photocatalytic oxidation
As can be seen in Fig. 8a and b, 6.0%, 5.4% and 12.7% of ATL can be removed by the adsorption of P25, TiO2 and MCT during the darkness stage. It is known that MWCNTs is a well adsorbent for organic reactants, the higher adsorption capacity of MCT is due to the MWCNTs in the nanocomposites. The enhanced adsorption capacity of the catalysts can lead to an increase in the local concentration of organic matter in the vicinity of their surface,36 thus promoting surface reactions between adsorbed organic compounds and ˙OH. MCT shows higher photocatalytic activity for the removal of ATL and TOC than P25 and TiO2, direct photolysis causes only 6.6% and 3.5% removal efficiencies for ATL and TOC, respectively. ATL was almost completely removed by photocatalytic oxidation with MCT in 120 min, while TOC removal efficiency was just 54.5%, indicating that some intermediates derived from ECs decomposition still remained in solution. | ||
| Fig. 8 Time evolution of the concentration of ATL (a) and TOC (b) during photocatalytic oxidation of a mixture of the four ECs with different catalysts under simulated solar-light radiation (λ = 300–800 nm); time evolution of the concentration of ATL, HCT, OFX, TMP, TOC (c) and phenolic compounds (CTP), carboxylates (CCarbx) and some inorganic ions (d) during photocatalytic oxidation of a mixture of the ECs in aqueous solution with MCT under simulated solar-light radiation. Conditions: pH = 7.0; ∑CEC0 = 40 mg L−1 (10 mg L−1 for each EC); catalyst dosage = 200 mg L−1; average irradiation intensity, 550 W m−2. | ||
As can be seen from Fig. 8c, the photocatalytic oxidation rate followed the order: OFX > TMP > ATL > HCT, and they can be almost completely removed in 120 min by photocatalytic oxidation under simulated solar-light radiation. As can be seen from Fig. 8d, the concentration of phenolic compounds increased up to 15.32 mg L−1 and then decreased. A similar trend was observed for carboxylates, at the beginning of the process, the concentration of carboxylates increased up to 7.48 mg L−1 and then decreased. It can be seen that inorganic ions, such as sulphur, chlorine and fluorine can be transformed into sulphate, chloride and fluoride under the experiment conditions.
3.4. Photocatalytic ozonation
Photocatalytic ozonation experiments were studied and the results were compared with those obtained from ozonation and photocatalytic oxidation. As can be seen from Fig. 9, there was not remarkable difference in the removal of all the pharmaceuticals by ozonation or photocatalytic ozonation, and they led to faster degradation rates of ATL, HCT, TMP than photocatalytic oxidation, which means that direct ozonation was the main reaction pathway in both cases. Similar results have also been observed for ozonation and photocatalytic ozonation of diclofenac and sulfamethoxazole.19 Although, photocatalytic oxidation was efficient for the removal of OFX, it was not so efficient for the removal of ATL, HCT, TMP and TOC, etc. As can be seen from Fig. 9e, after 60 min of reaction no changes at all was observed in TOC removal in the process of photolysis, while ozonation, photocatalytic oxidation and photocatalytic ozonation allowed 44.9%, 48.3% and 65.7% TOC removal efficiency, respectively (the photocatalytic ozonation data for 120 min can be seen in ESI Fig. 2†). The photocatalytic ozonation of ECs obeys pseudo-first-order kinetics, the reaction rate constant (kapp) can be deduced using the following equation:28
 | (1) |
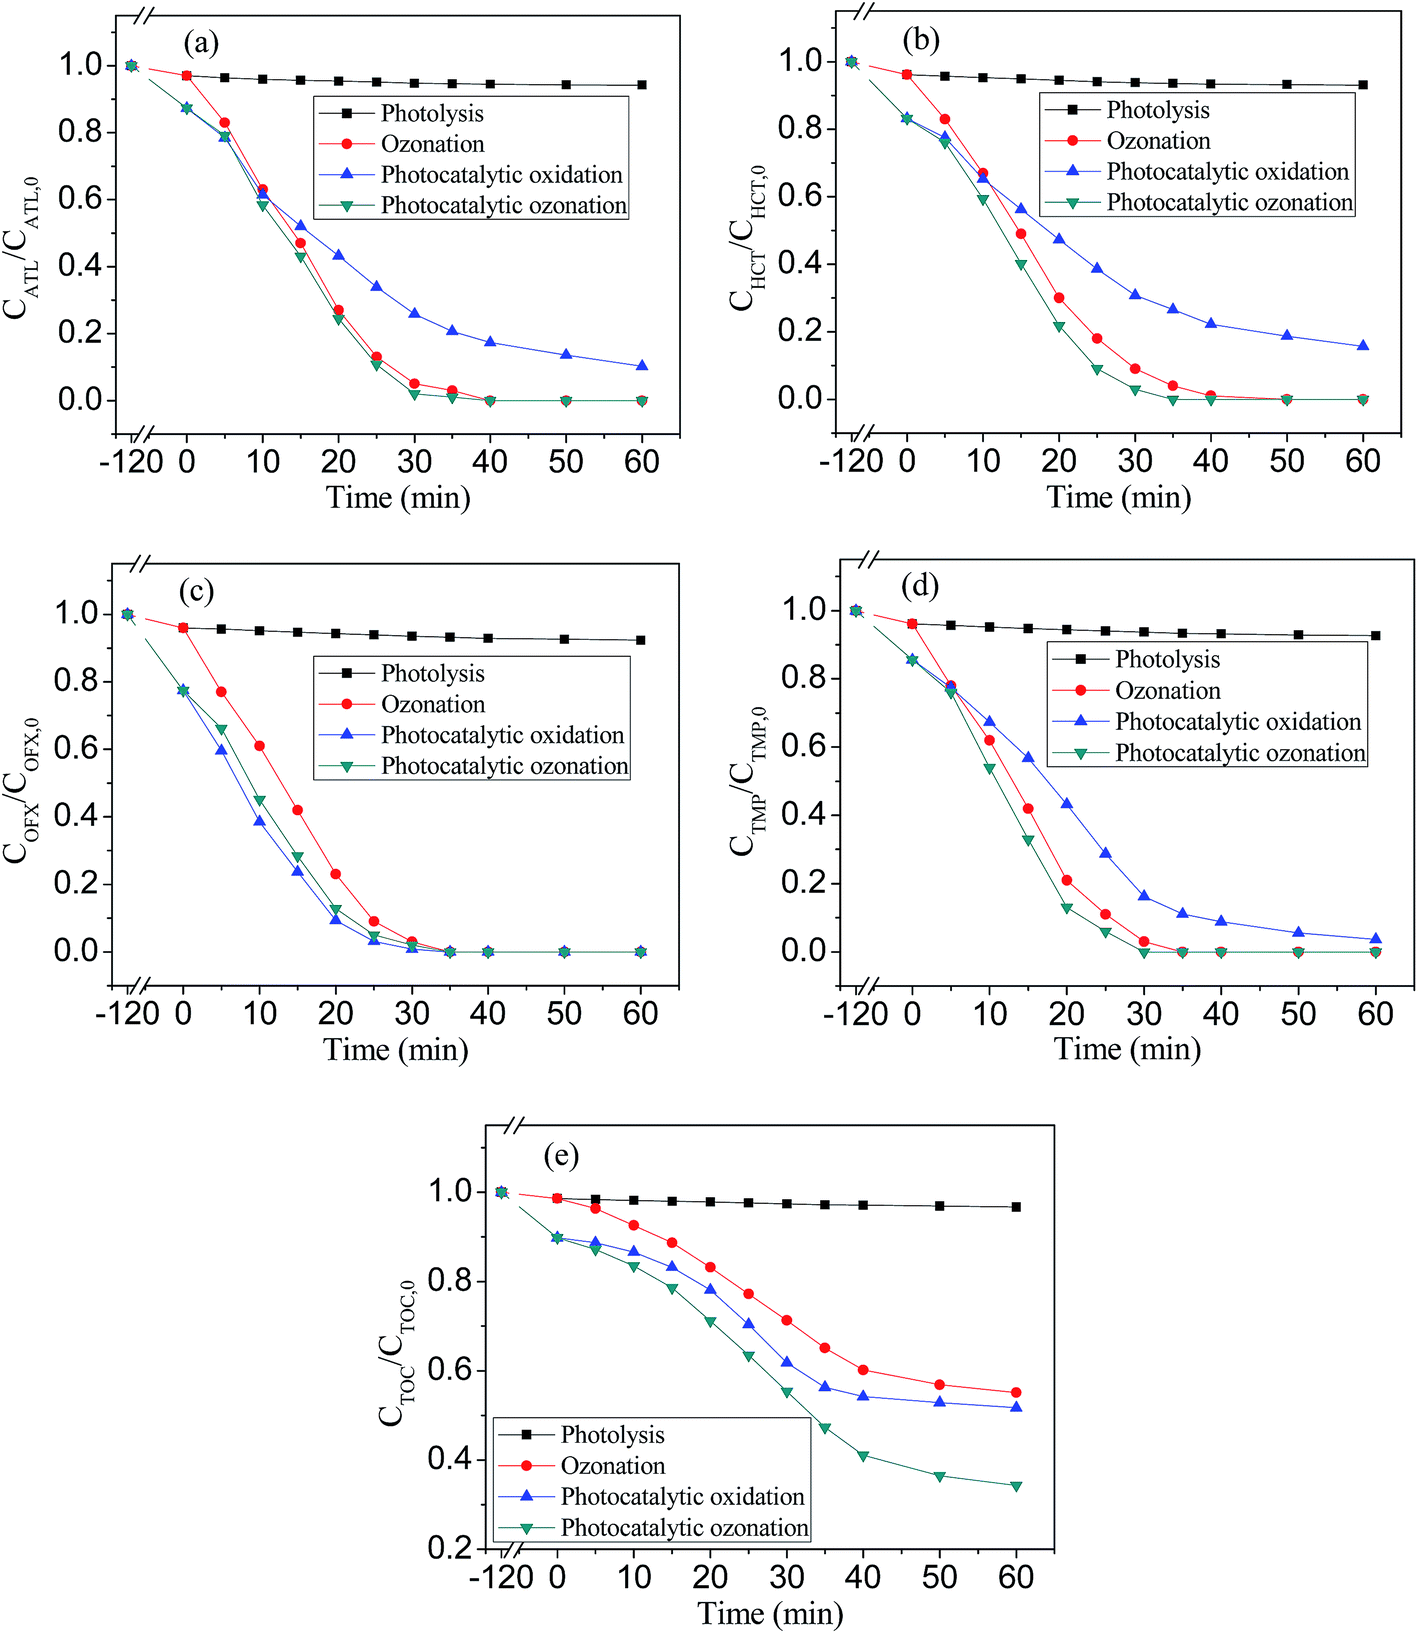 | ||
| Fig. 9 Time evolution of the concentration of ATL (a), HCT (b), OFX (c), TMP (d) and TOC (e) during four treatments. | ||
Ozone, despite being a strong oxidizing agent, reacts selectively with aromatic and unsaturated compounds. As a result of direct ozonation of the pharmaceuticals, non-aromatic and non-unsaturated intermediates compounds are formed (e.g. shortchain carboxylic acids), which react slowly with ozone, they are accumulated in water.23,24 Photocatalytic ozonation greatly improved the mineralization rate compared to ozonation or photocatalytic oxidation alone, which suggests the existence of some kind of synergism between photocatalytic oxidation and ozonation. First, in the photocatalytic ozonation process, part of ozone can be transformed into hydroxyl radicals (˙OH) by the action of MWCNTs,25,26,29,36 TiO2 (ref. 36 and 37) and iron oxides.36,38 Second, ozone can absorb UV-photons to form excited atomic oxygen species which further generate hydroxyl radicals.30,31 Third, the photocatalytic effect of anatase (reaction (2)) must be considered. This effect can be enhanced by the presence of ozone due to its electrophilic nature, which is prone to trap the electrons generating from the conduction band of TiO2 and then generating ozonide radicals, the generated ozonide radicals can be further transformed into ˙OH:5,6
| TiO2 + hυ → TiO2(e−, h+) | (2) |
| O3 + e− → O3˙− | (3) |
The rate constant of reaction (3) is very high39 and lead to the formation of ˙OH through reaction (4):
| O3˙− + H+ → HO3˙ → ˙OH + O2 | (4) |
3.5. Catalyst reusability
The stability and reusability of MCT were tested by consecutive photocatalytic ozonation experiment. In each run, the catalyst was kept 120 min in the darkness to reach adsorption equilibrium. As can be seen in Fig. 10, there was no evident decrease in catalytic activity for MCT after 5 cycles (65.7–58.3% TOC removal efficiency), indicating its high durability and stability. After each run, MCT was easily separated from liquid by a magnet. | ||
| Fig. 10 TOC conversion for consecutive photocatalytic ozonation runs with MCT. | ||
4. Conclusions
Magnetic MWCNTs/TiO2 synthesized in this work showed well photocatalytic and photocatalytic ozonation activity under simulated solar-light radiation, and the catalyst was successfully applied for the removal of the four ECs existing in urban wastewater through photocatalytic ozonation. The results show that the degradation behaviors of the selected ECs (ATL, HCT, OFX and TMP) when treated with photocatalysis, ozonation and photocatalytic ozonation are very different. Ozone alone is able to almost completely remove the ECs in aqueous solution but the mineralization degree reached is very low (44.7%). As compared to P25 and bare TiO2, MCT showed the best performance in the photocatalytic oxidation process for the removal of ECs. Photocatalytic oxidation led to a TOC removal efficiency of 48.3% in the experimental conditions, but some intermediate products which are difficult to degrade generated during photocatalytic oxidation process. Photocatalytic ozonation was the most efficient for TOC removal (65.7%) and low concentration of intermediates was accumulated during the photocatalytic ozonation process. Synergism between ozonation and photocatalysis was clearly observed in the experiment. From the results of the study, it can be concluded that solar photocatalytic ozonation might be a promising method to remove ECs from water.Acknowledgements
This work has been supported by National Nature Science Foundation of China (Grant No. 51338010, 21107125 and 51221892), National Basic Research Program of China (973 Program, Grant No. 2011CB933704), and the National Natural Science Funds for Distinguished Yong Scholar (Grant No. 51025830).References
- J. Zhang, B. Sun, X. M. Xiong, N. Y. Gao, W. H. Song, E. Du, X. H. Guan and G. M. Zhou, Water Res., 2014, 63, 262 CrossRef CAS PubMed.
- A. Bernabeu, R. F. Vercher, L. Santos-Juanes, P. J. Simón, C. Lardín, M. A. Martínez, J. A. Vicente, R. González, C. Llosá, A. Arques and A. M. Amat, Catal. Today, 2011, 161, 235 CrossRef CAS.
- F. Mazille, T. Schoettl, N. Klamerth, S. Malato and C. Pulgarin, Water Res., 2010, 44, 3029 CrossRef CAS PubMed.
- D. Fatta-Kassinos, S. Meric and A. Nikolaou, Anal. Bioanal. Chem., 2011, 399, 251 CrossRef CAS PubMed.
- N. Le-Minh, S. J. Khan, J. E. Drewes and R. M. Stuetz, Water Res., 2010, 44, 4295 CrossRef CAS PubMed.
- L. Prieto-Rodriguez, S. Miralles-Cuevas, I. Ollera, P. Fernández-Ibáñez, A. Agüerab, J. Blancoa and S. Malato, Appl. Catal., B, 2012, 128, 119 CrossRef CAS.
- M. A. Sousa, C. Gonçalves, J. P. Vilar, A. R. Boaventura and M. F. Alpendurada, Chem. Eng. J., 2012, 198–199, 301 CrossRef CAS.
- S. Malato, P. Fernández-Ibanez, M. I. Maldonado, J. Blanco and W. Gernjak, Catal. Today, 2009, 147, 1 CrossRef CAS.
- L. Prieto-Rodríguez, I. Oller, N. Klamerth, A. Agüera, E. M. Rodríguez and S. Malato, Water Res., 2013, 47, 1521 CrossRef PubMed.
- G. Márquez, E. M. Rodríguez, F. J. Beltrán and P. M. Álvarez, Chemosphere, 2014, 113, 71 CrossRef PubMed.
- R. Alimoradzadeh, A. Assadi, S. Nasseri and M. R. Mehrasbi, Iran. J. Environ. Health Sci. Eng., 2012, 9, 1 CrossRef PubMed.
- T. E. Agustina, H. M. Ang and V. K. Vareek, J. Photochem. Photobiol., C, 2005, 6, 264 CrossRef CAS.
- E. M. Rodríguez, G. Fernández, P. M. Alvarez and F. J. Beltrán, Water Res., 2012, 46, 152 CrossRef PubMed.
- A. Bianco, K. Kostarelos and M. Prato, Chem. Commun., 2011, 47, 10182 RSC.
- J. T. Sun, C. Y. Hong and C. Y. Pan, Polym. Chem., 2011, 2, 998 RSC.
- S. H. Lee, D. H. Lee, W. J. Lee and S. O. Kim, Adv. Funct. Mater., 2011, 21, 1338 CrossRef CAS.
- X. L. Pan and X. H. Bao, Acc. Chem. Res., 2011, 44, 553 CrossRef CAS PubMed.
- K. Woan, G. Pyrgiotakis and W. Sigmund, Adv. Mater., 2009, 21, 2233 CrossRef CAS.
- R. Leary and A. Westwood, Carbon, 2011, 49, 741 CrossRef CAS.
- Y. Yao, G. H. Li, S. Ciston, R. M. Lueptow and K. A. Gray, Environ. Sci. Technol., 2008, 42, 4952 CrossRef CAS PubMed.
- X. Xia, Z. Jia, Y. Yu, Y. Liang, Z. Wang and L. L. Ma, Carbon, 2007, 45, 717 CrossRef CAS.
- T. J. Bandosz, J. Matos, M. Seredych, M. S. Z. Islam and R. Alfano, Appl. Catal., A, 2012, 445, 159 CrossRef.
- L. F. Velasco, I. M. Fonseca, J. B. Parra, J. C. Lima and C. O. Ania, Carbon, 2012, 50, 249 CrossRef CAS.
- M. A. Andrade, R. J. Carmona, A. S. Mestre, J. Matos, A. P. Carvalho and C. O. Ania, Carbon, 2014, 76, 183 CrossRef CAS.
- Y. H. Ao, J. J. Xu, D. G. Fu and C. W. Yuan, Carbon, 2008, 46, 596 CrossRef CAS.
- V. K. Gupta, S. Agarwal and T. A. Saleh, Water Res., 2011, 45, 2207 CrossRef CAS PubMed.
- H. Wang, H. L. Wang, W. F. Jiang and Z. Q. Li, Water Res., 2009, 43, 204 CrossRef CAS PubMed.
- G. Márquez, E. M. Rodríguez, M. I. Maldonado and P. M. Álvarez, Sep. Purif. Technol., 2014, 136, 18 CrossRef.
- D. H. Quinones, A. Rey, P. M. Álvarez, F. J. Beltrán and P. K. Plucinski, Appl. Catal., B, 2014, 144, 96 CrossRef CAS.
- R. Andreozzi, V. Caprio, A. Insola and R. Marotta, Catal. Today, 1999, 53, 51 CrossRef CAS.
- V. U. Gunten, Water Res., 2003, 37, 1443 CrossRef.
- J. Benner, E. Salhi, T. A. Ternes and V. U. Gunten, Water Res., 2008, 42, 3003 CrossRef CAS PubMed.
- M. L. Wilde, S. Montipo and A. F. Martins, Water Res., 2014, 48, 280 CrossRef CAS PubMed.
- K. Li, A. Yediler, M. Yang, S. Schulte-Hostede and M. H. Wong, Chemosphere, 2008, 72, 473 CrossRef CAS PubMed.
- K. S. Tay, N. A. Rahman and M. R. B. Abas, Chemosphere, 2009, 76, 1296 CrossRef CAS PubMed.
- A. Rey, P. García-Munoz, M. D. Hernández-Alonso, E. Mena, S. García-Rodríguez and F. J. Beltrán, Appl. Catal., B, 2014, 154–155, 274 CrossRef CAS.
- H. U. Lee, G. Lee, J. C. Park, Y. C. Lee, S. M. Lee, B. Son, S. Y. Park, C. Kim, S. G. Lee, S. C. Lee, B. Nam, J. W. Lee, D. R. Bae, J. S. Yoon and J. Lee, Chem. Eng. J., 2014, 240, 91 CrossRef CAS.
- A. Rey, D. H. Quinones, P. M. Álvarez, F. J. Beltrán and P. K. Plucinski, Appl. Catal., B, 2012, 111–112, 246 CrossRef CAS.
- E. M. Rodríguez, G. Márquez, E. A. León, P. M. Álvarez and F. J. Beltrán, J. Environ. Manage., 2013, 127, 114 CrossRef PubMed.
Footnote |
| † Electronic supplementary information (ESI) available. See DOI: 10.1039/c5ra18752d |
| This journal is © The Royal Society of Chemistry 2015 |