DOI:
10.1039/C5RA18526B
(Paper)
RSC Adv., 2015,
5, 100159-100168
PEDOT:PSS assisted preparation of a graphene/nickel cobalt oxide hybrid counter electrode to serve in efficient dye-sensitized solar cells
Received
10th September 2015
, Accepted 10th November 2015
First published on 12th November 2015
Abstract
Graphene/nickel cobalt oxide (Gr/NiCo2O4) hybrids with a nanostructure were prepared by the use of an in situ hydrothermal route, and applied as a counter electrode (CE) with poly(3,4-ethylenedioxythiophene):poly(styrenesulfonate) assisted preparation (here abbreviated as P-A) in dye-sensitized solar cells (DSSCs) for the first time. The surface morphology of the bilayer TiO2 photoanode was confirmed using scanning electron microscopy. The superior structural characteristics of the photoanode were advantageous to fast mass transport for the electrolyte, increasing the contact area between the electrolyte and active materials, and enabling the (P-A) Gr/NiCo2O4 CE to speed up the reduction of triiodide to iodide. Also, the CE with a superior nanostructure was evaluated by electrochemical characterization, which indicated that the (P-A) Gr/NiCo2O4 CE possessed excellent electrocatalytic activity in the iodide/triiodide electrolyte and a lower charge transfer resistance of 3.04 ± 0.02 Ω cm2 compared to that of the Pt electrode (3.63 ± 0.02 Ω cm2). Under optimum conditions, the DSSC based on the (P-A) Gr/NiCo2O4 CE achieved a remarkable power conversion efficiency of 8.10%, which is about 8.7% higher than that of the Pt-based DSSC (7.45%). The (P-A) Gr/NiCo2O4 CE can be considered as a promising alternative CE for Pt-free DSSCs.
1. Introduction
Dye-sensitized solar cells (DSSCs), electrochemical devices converting solar energy to electricity characterized by high conversion efficiency, are honoured as a promising solution to energy depletion, environmental pollution and ecological destruction due to them being low cost and environmentally friendly, and having good durability.1–3 Typically, the device consists of dye-adsorbed TiO2 nanoparticles, filled with an electrolyte containing iodide/triiodide (I−/I3−) redox couples, and a counter electrode (CE) with excellent catalytic ability. Conventionally, the CE, as the most important component in a DSSC, collects the electrons from the external circuit and catalyzes the reduction of I3− to I− between the CE and electrolyte interface.4,5
Graphene and its hybrids have been believed to be an efficient approach for enhancing the photoelectric and electrochemical performance of DSSCs.6–11 The large surface area, unique features of strong mechanical strength, and high electrical and thermal conductivity associated with graphene usually translate into high efficiency for photoelectric chemical devices,12,13 so it is highly desirable for applications in DSSCs.14 Moreover, as one of the transition metal oxides, NiCo2O4 with a very remarkable electrical conductivity has attracted considerable attention as a low overpotential catalyst for oxygen reduction reactions and a high-performance electrode material in Li-ion batteries, supercapacitors and fuel cells due to its low cost and environmental friendliness.15–21 It is therefore expected to offer richer redox reactions, including contributions from both nickel and cobalt ions, than those of the monometallic nickel oxide or cobalt oxide. Simultaneously, the electrochemical performance is also affected by the morphology of the NiCo2O4 catalyst, e.g., 1D nanomaterials have demonstrated better performance for Li–O2 batteries than microparticles.22,23
Therefore, taking into account all of these factors, in the search for more robust Pt-free CEs, here we reported graphene/nickel cobalt oxide (Gr/NiCo2O4) hybrids with a nanostructure through an in situ hydrothermal route and prepared an efficient Gr/NiCo2O4 CE with poly(3,4-ethylenedioxythiophene):poly(styrenesulfonate) (PEDOT:PSS) assisted (here abbreviated as P-A) preparation by means of a slurry-coating technique. This type of electrode was generally anticipated to have many advantages, such as good electrical conductivity, easy electrolyte penetration, and high electrochemical activity. The electrocatalytic ability and photoelectric properties of the (P-A) Gr/NiCo2O4-based DSSC was systematically investigated. The DSSC assembled with the (P-A) Gr/NiCo2O4 CE exhibited a considerably improved performance with a photoelectric conversion efficiency of 8.10% under irradiation of 100 mW cm−2 (AM 1.5 G).
2. Experimental
2.1 Materials
Nickel(II) nitrate hexahydrate (Ni(NO3)2·6H2O, 98%), cobalt(II) nitrate hexahydrate (Co(NO3)2·6H2O, 98.5%), poly(styrenesulfonate) (PSS), 3,4-ethylenedioxythiophene (EDOT), N-methyl-2-pyrrolidinone (NMP), polyvinyl-difluoride (PVDF), potassium persulfate (K2S2O8) and titanium tetrachloride (TiCl4) were purchased from Shanghai Chemical Agent Ltd, China. All reagents are of analytical reagent grade. The dye N719 cis-di(isothiocyanato)-bis-(2,2′-bipyridyl-4,4′-dicarboxylate)ruthenium(II)bis-tetrabutylammonium was obtained from Solaronix SA (Switzerland).
2.2 Preparation of the (P-A) Gr/NiCo2O4 hybrid counter electrode
A typical synthesis procedure of PEDOT:PSS is outlined below. 6.95 g PSS (18 wt%) aqueous solution was mixed with 75 mL deionized water at room temperature and treated with nitrogen bubbling for 0.5 h. Then 0.5 g EDOT and 0.0077 g Fe2(SO4)3·9H2O were added to initiate the polymerization. The mixture was stirred at room temperature for 2 h, after which a further 0.1673 g K2S2O8 was added. After additional reaction for 12 h, the mixture was put into a dialytic bag for 48 h to remove the excess reactants. Then a blue solution of PEDOT:PSS was obtained.
Briefly, the preparation of the (P-A) Gr/NiCo2O4 counter electrode is outlined as follows. Firstly, 1.0 mmol Ni(NO3)2·6H2O, 2.0 mmol Co(NO3)2·6H2O, 6.0 mmol NH4F and 15 mmol CO(NH2)2 were dissolved in 38 mL deionized water. After ultrasonication and stirring for 30 min a homogeneous solution was achieved. After that, 1.5 wt% of graphene was added into the reaction solution. This was further sonicated for another 30 min before being transferred into a Teflon-lined autoclave, and then heated in an oven at 100 °C for 10 h without intentional control of the ramping or cooling rate. The Gr/NiCo2O4 hybrids with a black color were collected by filtering and washed with ethanol and distilled water 5 times, followed by annealing at 200 °C for 4 h. Then, Gr/NiCo2O4 as the active material was mixed with acetylene black and PVDF in a weight ratio of 8![[thin space (1/6-em)]](https://www.rsc.org/images/entities/char_2009.gif) :
:![[thin space (1/6-em)]](https://www.rsc.org/images/entities/char_2009.gif) 1
1![[thin space (1/6-em)]](https://www.rsc.org/images/entities/char_2009.gif) :
:![[thin space (1/6-em)]](https://www.rsc.org/images/entities/char_2009.gif) 1. The paste of the above mentioned mixtures was prepared by the use of deionized water, ethanol, NMP and PEDOT:PSS as the solvent, respectively, and kept stirring for 12 h. Subsequently, the as-prepared paste was coated on an FTO substrate (8 Ω cm−2, 350 nm thickness, Hartford Glass Co., USA) using a doctor blade method with an area of 0.64 cm2 to form a film with a thickness of ∼6 μm. The obtained electrodes were dried at 100 °C for 12 h in a vacuum oven and marked as (W-A) Gr/NiCo2O4, (E-A) Gr/NiCo2O4, (N-A) Gr/NiCo2O4 and (P-A) Gr/NiCo2O4 CEs, respectively. For comparison, the Gr and NiCo2O4 electrodes mentioned in the manuscript were also prepared by the use of PEDOT:PSS as the solvent and marked as Gr* and NiCo2O4* CEs with a similar method. The Pt electrode was prepared using a three-electrode system.
1. The paste of the above mentioned mixtures was prepared by the use of deionized water, ethanol, NMP and PEDOT:PSS as the solvent, respectively, and kept stirring for 12 h. Subsequently, the as-prepared paste was coated on an FTO substrate (8 Ω cm−2, 350 nm thickness, Hartford Glass Co., USA) using a doctor blade method with an area of 0.64 cm2 to form a film with a thickness of ∼6 μm. The obtained electrodes were dried at 100 °C for 12 h in a vacuum oven and marked as (W-A) Gr/NiCo2O4, (E-A) Gr/NiCo2O4, (N-A) Gr/NiCo2O4 and (P-A) Gr/NiCo2O4 CEs, respectively. For comparison, the Gr and NiCo2O4 electrodes mentioned in the manuscript were also prepared by the use of PEDOT:PSS as the solvent and marked as Gr* and NiCo2O4* CEs with a similar method. The Pt electrode was prepared using a three-electrode system.
2.3 Fabrication of the DSSC
The bilayer TiO2 photoanode is prepared as described previously.24,25 Firstly, a thin TiO2 dense layer with a particle size of 36 nm and a thickness of 0.5 μm was prepared by spin-coating the solution (4 mL tetrabutyltitanate, 5 mL isopropanol and 1 mL acetylacetone in 25 mL n-butanol) on an FTO substrate at 1500 rpm for 30 s, followed by sintering at 450 °C for 30 min in air. Secondly, the TiO2 nanorods with a diameter of about 300 nm grew on the dense layer as follows. Two pieces of FTO with a TiO2 dense layer were placed into 60 mL of tetrabutyltitanate solution containing 1 mL of tetrabutyltitanate, 30 mL of deionized water and 30 mL of hydrochloric acid (36.5–38% by weight) at an angle against the wall of the Teflon-liner with the conducting side facing down. The hydrothermal synthesis was conducted at 160 °C for 6 h in an electric oven. The dye was loaded by immersing the bilayer TiO2 photoanode in 0.3 mM of N719 ethanol solution for 12 h. Thus the dye-sensitized TiO2 photoanode with a thickness of 4–5 μm was obtained. The DSSC was fabricated by injecting the liquid electrolyte (0.05 M of I2, 0.1 M of LiI, 0.6 M of tetrabutylammonium iodide and 0.5 M of 4-tert-butylpyridine in acetonitrile) into the aperture between the dye-sensitized TiO2 electrode and the CE. The two electrodes were clipped together and wrapped with thermoplastic hot-melt Surlyn (the schematic of the DSSC is shown in Fig. 1).
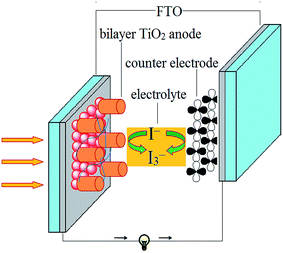 |
| | Fig. 1 Schematic of the DSSC with the bilayer TiO2 photoanode and the (P-A) Gr/NiCo2O4 counter electrode. | |
2.4 Characterization
The surface morphology of the samples was observed using JSM-7001F field emission scanning electron microscopy (SEM). Cyclic voltammetry (CV) and electrochemical impedance spectroscopy (EIS) were conducted with the use of a computer-controlled electrochemical analyzer (CHI 660D, Shanghai Chenhua Device Company, China). The electrolyte used in the DSSC test was also injected into the dummy cells for the EIS measurements. EIS was carried out under simulated open-circuit conditions at ambient atmosphere, sealing with thermoplastic hot-melt Surlyn and leaving an exposed area of 0.64 cm2. The frequency of the applied sinusoidal AC voltage signal was varied from 0.1 Hz to 105 Hz and the corresponding amplitude was kept at 5 mV in all cases.
The photovoltaic test of the DSSC with an exposed area of 0.4 × 0.7 cm2 was carried out by measuring the photocurrent–photovoltage (J–V) character curve under white light irradiation of 100 mW cm−2 (AM 1.5 G) from the solar simulator (XQ-500W, Shanghai Photoelectricity Device Company, China) in ambient atmosphere. The fill factor (FF) and the photoelectric conversion efficiency (PCE) of the DSSC were calculated according to the following equations:
| |
 | (1) |
| |
 | (2) |
where
Jsc is the short-circuit current density (mA cm
−2),
Voc is the open-circuit voltage (V),
Pin is the incident light power (mW cm
−2), and
Jmax (mA cm
−2) and
Vmax (V) are the current density and voltage at the point of maximum power output in the
J–
V curve, respectively.
The diffusion coefficient (Dn) of the CE in the electrolyte is estimated in light of the Randles–Sevcik equation as illustrated in eqn (3):
| | |
Ipc = Kn1.5AC(Dn)0.5v0.5
| (3) |
where
Ipc is the cathodic current density,
K is the constant of 2.69 × 10
5,
n means the number of electrodes contributing to the charge transfer,
A is the area of the CE, and
C and
v represent the concentration of I
3− species and the scan rate, respectively.
The exchange current density (J0) for the Tafel curves can be estimated according to eqn (4):
| |
 | (4) |
where
R is the gas constant,
T is the temperature,
F is Faraday’s constant, and
Rct is the charge transfer resistance.
3. Results and discussion
3.1 Surface morphology and composition of TiO2
Fig. 2a presents the image of the TiO2 dense layer, which shows that the TiO2 dense layer with a size of about 36 nm was prepared using a spin-coating method to reduce the charge recombination and improve the fill factor of the DSSC. Top and side views in Fig. 2b and c show that the top surface of the TiO2 nanorods is nearly perpendicular to the FTO substrate and hexagonal in shape with square top facets. After 6 h of growth, the average diameter and length for the nanorods, as determined from the SEM images, are about 300–340 nm and 3.5 μm, respectively. This distance favors the photoproduction electronic transmission. Moreover, the TiO2 nanorods that grew on the TiO2 dense layer by the use of an in situ hydrothermal route are of the anatase phase as referred to in the XRD patterns in Fig. 2d.
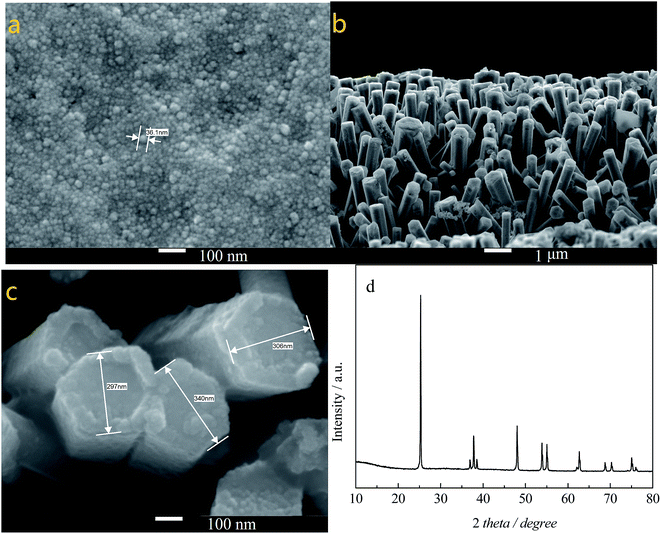 |
| | Fig. 2 SEM images of the TiO2 dense layer (a), and TiO2 nanorods (b and c), and XRD patterns of the TiO2 nanorods (d). | |
3.2 UV-vis absorption spectra
The UV-vis absorption spectra of TiO2 with nanorod and nanoparticle structures were measured and are displayed in Fig. 3a. As expected, TiO2 nanorods show a more obvious absorption enhancement for the characteristic spectrum with its fundamental absorption of the Ti–O bond in the ultraviolet light range from 300 to 400 nm, mainly because of the more convenient channel for charge transport provided by the TiO2 nanorods. Fig. 3b shows the specific surface areas (Brunauer–Emmett–Teller, BET) for the different morphologies of TiO2 by nitrogen adsorption–desorption. It is clear that the BET surface area of the TiO2 nanorods (105.4 m2 g−1) is a much larger specific surface area than that of the TiO2 nanoparticles (71.3 m2 g−1), indicating that the TiO2 nanorods have very uniform mesopores. Such a high BET surface area could facilitate the dye-loading capacity and probably endow the TiO2 nanorod-based DSSCs with a higher current density.26 Simultaneously, the absorption spectra of dye desorbed from the photoanodes with different structures are exhibited in Fig. 3c. It is clear that a stronger absorption of the dye for the TiO2 photoanode with a nanorod structure can be obtained than that of the nanoparticle structure, which well proves the enhanced specific surface area for the TiO2 nanorods as shown in Fig. 3b. Furthermore, the estimated adsorbed amount of dye N719 in the photoanode with the nanoparticle structure is about 0.52 × 10⁻⁷ mol cm−2, while it can reach 0.86 × 10⁻⁷ mol cm−2 for the TiO2 nanorod photoanode.
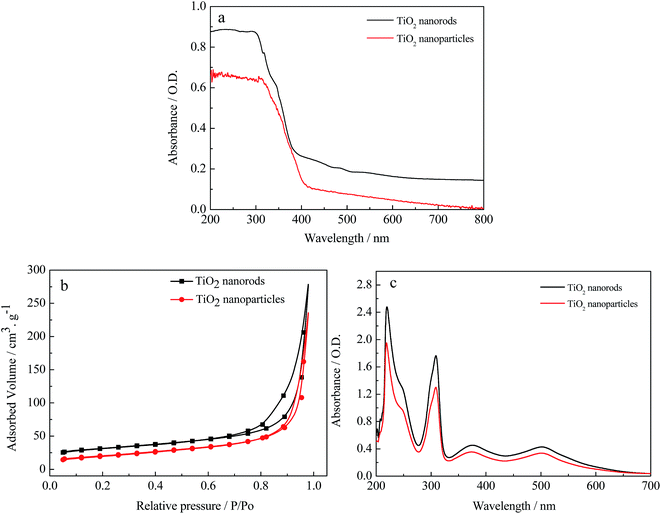 |
| | Fig. 3 UV–vis absorption spectra (a and c) and the specific surface areas (b) of the TiO2 nanorods and TiO2 nanoparticles. | |
3.3 Surface morphology and composition of the samples
Fig. 4a and b show the SEM images of the NiCo2O4 nanorods and Gr/NiCo2O4 nanoparticles. As seen in Fig. 4a, the NiCo2O4 particles can exhibit a beautiful rod-like nanostructure. It is notable that when graphene was added into the hydrothermal reaction solution, the morphology of the Gr/NiCo2O4 nanoparticles interestingly changed to shorter nanorods and blended uniformly with the graphene flakes as shown in Fig. 4b. The unique nanostructure guarantees the full contact area and fast mass transport for the electrolyte, and enables highly enhanced catalytic activity toward the reduction of I3−, which logically results in a considerably improved photovoltaic performance.27 The EDS analysis of the sample indicates the presence of C, O, Co, and Ni elements with strong signals as shown as in Fig. 4c, which are responsible for the formation of the Gr/NiCo2O4 nanoparticles.
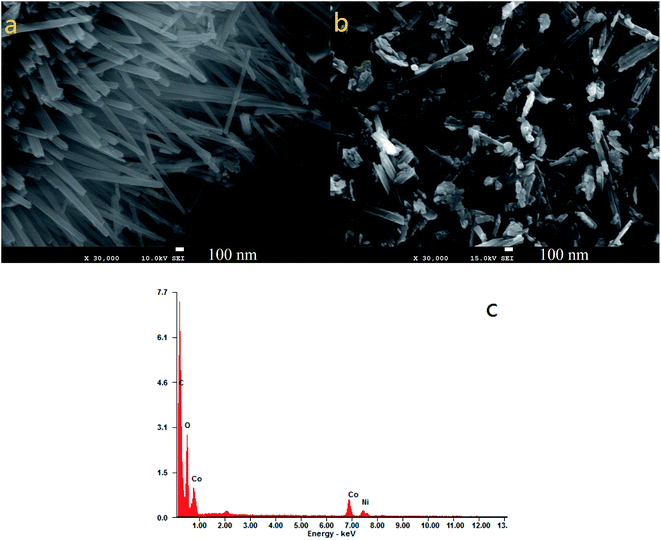 |
| | Fig. 4 SEM images of the NiCo2O4 nanorods (a), and the Gr/NiCo2O4 nanoparticles (b), and EDS of the Gr/NiCo2O4 nanoparticles (c). | |
3.4 Electrochemical properties of the counter electrode
As depicted in Fig. 5, two pairs of redox peaks are observed in the CV curves for the different CEs at a scan rate of 50 mV s−1. The left and right redox pair peaks are associated with I3− + 2e− ↔ 3I− and 3I2 + 2e− ↔ 2I3−, respectively. The main function of the CE is to be responsible for speeding up the reduction of I3− to I−, which is highly related to the left redox pair peaks. The cathodic current density (Ipc) and the peak to peak separation (Epp) are two crucial parameters for comparing the electrocatalytic ability of various CEs.28,29 Fig. 5a exhibits the CV curves of the Pt, Gr*, NiCo2O4* and (P-A) Gr/NiCo2O4 CEs at a scan rate of 50 mV s−1. To our knowledge, the |Ipc| is positively correlated with the catalytic ability of the electrodes, and |Epp| is inversely correlated with the electrocatalytic activity of the CEs. It was noticed that the (P-A) Gr/NiCo2O4 CE shows a higher Ipc than that of the Pt, Gr* and NiCo2O4* electrodes in Fig. 5a, indicating that the (P-A) Gr/NiCo2O4 CE effectively acted as a catalyst in the reaction of the I−/I3− electrolyte. The |Epp| of the above-mentioned CEs increases in the order of (P-A) Gr/NiCo2O4 (0.23 ± 0.01 V) < Pt (0.28 ± 0.01 V) < NiCo2O4* (0.32 ± 0.01 V) < Gr* (0.51 ± 0.01 V), which is immediately responsible for the lower overpotential loss in the (P-A) Gr/NiCo2O4 CE than the others since the highly conductive PEDOT:PSS was incorporated into the Gr/NiCo2O4 nanoparticles. In the case of the (P-A) Gr/NiCo2O4 CE, NiCo2O4 evenly coated on the graphene surface and still basically kept the morphology of the graphene network, which would effectively facilitate the electron transport and the diffusion of the redox electrolyte within the CE. In addition, the synergistic effect of PEDOT:PSS also provides an efficient electron transport network and enhances the conductivity of the counter electrode. Furthermore, the reduction reaction of the I−/I3− redox couples is due to a diffusion-controlled transport process, and the diffusion coefficient (Dn) is positively correlated with Ipc from the Randles–Sevcik equation as illustrated in eqn (3).30 Though the NiCo2O4* CE has a larger |Epp| than the Gr* CE, it possesses the lowest |Ipc| among all the CEs. Thus, from this, the Dn of I3− for the samples follows the order of (P-A) Gr/NiCo2O4 > Pt > Gr* > NiCo2O4*. The larger Dn for the (P-A) Gr/NiCo2O4 CE than that of the other CEs presumably originates from its well-controlled surface structure and the improvement of the conductivity of the CE.
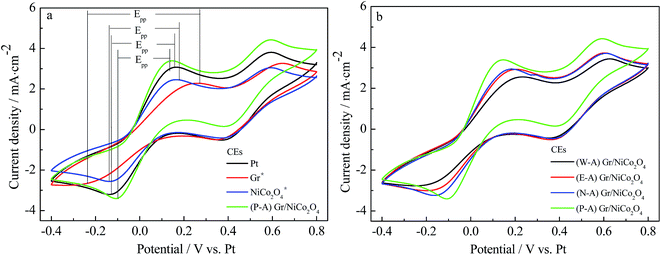 |
| | Fig. 5 CV for the Pt, Gr*, NiCo2O4* and (P-A) Gr/NiCo2O4 CEs (a), and the Gr/NiCo2O4 CE with different solvents (b) at a scan rate of 50 mV s−1. | |
Fig. 5b presents CV of the Gr/NiCo2O4 CEs depending on deionized water, ethanol, NMP and PEDOT:PSS as the solvent, respectively. It is clear that the influence of the solvent on the electrochemical ability is great and the relationships between the solvent and the |Ipc| and |Epp| values for the CEs are summarized in Table 1. Among them, |Ipc| of the above-mentioned CEs increases in the order of (W-A) Gr/NiCo2O4 < (E-A) Gr/NiCo2O4 < (N-A) Gr/NiCo2O4 < (P-A) Gr/NiCo2O4, while |Epp| increases in the opposite order. The difference of electrochemical ability for the CEs prepared with various solvents mainly comes from the following several aspects. PVDF, as the binder of the conductive paste, dissolves easily in NMP and ethanol, but can not dissolve in deionized water very well. However, ethanol volatilizes quickly and causes its conductive paste to be unstable in air. Compared to NMP and ethanol, PEDOT:PSS with an excellent conductivity and catalytic ability could better dissolve PVDF and provide a good network for the charge transport.31
Table 1 The electrochemical performance of the samples based on the different CEs with various solvents
| Solvents |
|Ipc| (mA cm−2) |
|Epp| (V) |
J0 (mA cm−2) |
Rs (Ω cm−2) |
Rct (Ω cm−2) |
| Deionized water |
2.69 |
0.42 |
1.08 |
8.46 ± 0.02 |
4.37 ± 0.02 |
| Ethanol |
2.97 |
0.39 |
1.16 |
8.13 ± 0.02 |
4.02 ± 0.02 |
| NMP |
3.24 |
0.34 |
1.20 |
7.69 ± 0.02 |
3.84 ± 0.02 |
| PEDOT:PSS |
3.41 |
0.23 |
1.32 |
6.82 ± 0.02 |
3.04 ± 0.02 |
The electrochemical stability of a CE is very important to the long-term performance of the DSSC. A 40-cycle consecutive cycle scan test has been performed for the (P-A) Gr/NiCo2O4 CE at a scan rate of 50 mV s−1 using the same electrolyte mentioned in the experimental section. After 40 cycles, the normalized cathodic and anodic peak current densities remain scarcely changed and maximum redox peak current densities show a good linear relationship as presented in Fig. 6, suggesting that the (P-A) Gr/NiCo2O4 CE is stable and not corroded in the I−/I3− redox electrolyte.32,33
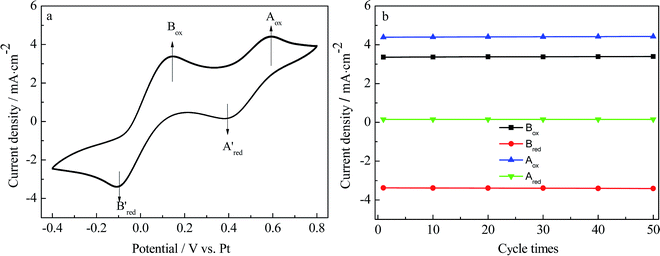 |
| | Fig. 6 40-cycle CV (a), and the relationship between the cycles and the maximum redox peak currents for the (P-A) Gr/NiCo2O4 electrode (b). | |
CV of the (P-A) Gr/NiCo2O4 electrode at various scan rates from 30 to 90 mV s−1 and the relationship between the redox peak current versus the square root of the scan rates are shown in Fig. 7. It can be obviously observed that both the oxidation and reduction peaks for the Ipc and potential gradually and regularly changed with the increasing scan rates, and the Ipc versus (scan rate)1/2 plots have a good linear relationship. This phenomenon indicates that the adsorption of iodide species is almost not affected by the redox reaction on the (P-A) Gr/NiCo2O4 electrode surface.34,35
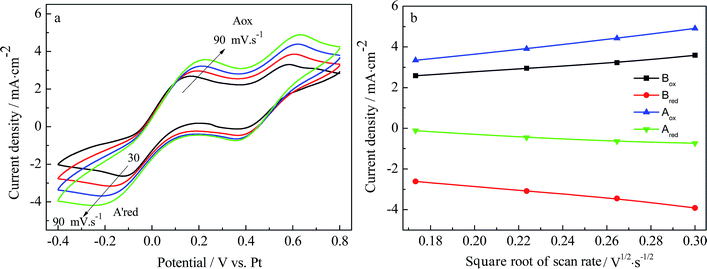 |
| | Fig. 7 CV for the (P-A) Gr/NiCo2O4 electrode with different scan rates (from inner to outer: 30, 50, 70, and 90 mV s−1) (a). The redox peak current versus the square root of the scan rates (b). | |
The electrochemical impedance properties of different CEs are measured using their symmetric cells. Fig. 8 exhibits the Nyquist plots of the symmetrical Pt, Gr*, NiCo2O4* and (P-A) Gr/NiCo2O4 CEs for the I−/I3− electrolyte and the corresponding EIS parameters are also listed in Table 2. The inset in Fig. 8 shows the equivalent circuit, in which Rs is the resistance value at the onset point of the first semicircle, Rct is the radius of the first semicircle, and the semicircle at a low frequency represents the Nernst diffusion impedance (Zw) corresponding to the diffusion resistance of the I−/I3− redox species.36 As far as we know, Rs and Rct, two crucial parameters for comparing the electrocatalytic ability of different CEs, are inversely correlated with the catalytic ability of the electrodes. It can be seen from Table 2 that the Rs values associated with the Pt, Gr*, NiCo2O4* and (P-A) Gr/NiCo2O4 CEs are 7.55 ± 0.02, 8.76 ± 0.02, 9.98 ± 0.02, and 6.82 ± 0.02 Ω cm2, respectively. It is noted that the Rs of the Pt CE is comparable to that of the Gr* and NiCo2O4* CEs, but higher than that of the (P-A) Gr/NiCo2O4 CE. The lower Rs for the (P-A) Gr/NiCo2O4 CE means a better electrical conductivity and more contact surface area than the other CEs. On the other hand, the CE with the smaller Rct means a lower overpotential for an electron transferring from the CE to the electrolyte, a facile electron transfer, and great electrochemical ability. From Table 2, the Rct values for the Pt, Gr*, NiCo2O4* and (P-A) Gr/NiCo2O4 CEs are 3.63 ± 0.02, 4.61 ± 0.02, 6.78 ± 0.02, and 3.04 ± 0.02 Ω cm2, respectively. The Pt CE has a better electrochemical ability than the Gr* and NiCo2O4* CEs, however, with the graphene and PEDOT:PSS introduction, a smaller Rct is seen than that of the Pt CE produced from the (P-A) Gr/NiCo2O4 CE. Therefore, the graphene and PEDOT:PSS combinations are able to compete with the Pt CE for the DSSC. Additionally, it should be noted that Zw for the (P-A) Gr/NiCo2O4 CE (1.41 ± 0.02 Ω cm2) is a little larger than that of the Pt electrode (1.39 ± 0.02 Ω cm2). This can be attributed to the conductive polymer’s relatively low electrical conductivity compared with that of the Pt catalyst.
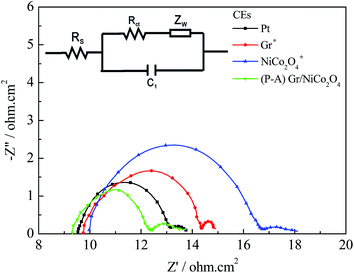 |
| | Fig. 8 Nyquist plots of the symmetrical Pt, Gr*, NiCo2O4* and (P-A) Gr/NiCo2O4 CEs for the I−/I3− redox couple. | |
Table 2 EIS parameters of various CEs made from the impedance spectra
| Electrodes |
Rs (Ω cm−2) |
Rct (Ω cm−2) |
Zw (Ω cm−2) |
J0 (mA cm−2) |
|Ipc| (mA cm−2) |
| Pt |
7.55 ± 0.02 |
3.63 ± 0.02 |
0.63 ± 0.02 |
1.24 |
3.16 |
| Gr* |
8.76 ± 0.02 |
4.61 ± 0.02 |
0.51 ± 0.02 |
1.07 |
2.58 |
| NiCo2O4* |
9.98 ± 0.02 |
6.78 ± 0.02 |
1.39 ± 0.02 |
0.91 |
2.52 |
| (P-A) Gr/NiCo2O4 |
6.82 ± 0.02 |
3.04 ± 0.02 |
1.41 ± 0.02 |
1.32 |
3.41 |
In addition to the EIS of the different materials, the influence of the solvent on the electrochemical performance was also studied, and the key parameters of the EIS are given in Table 1. As seen in Table 1, the values of Rs and Rct for the CEs both follow the order of (W-A) Gr/NiCo2O4 > (E-A) Gr/NiCo2O4 > (N-A) Gr/NiCo2O4 > (P-A) Gr/NiCo2O4. These results are in good agreement with the CV, and ascribed to the same reasons.
To further investigate the catalytic activities of the samples, Tafel polarization curves were obtained for the electrodes with Pt, Gr*, NiCo2O4* and (P-A) Gr/NiCo2O4 in a dummy cell similar to the ones used in the EIS measurement as displayed in Fig. 9. Theoretically, the curve at low potentials (|U| < 0.12 V) represents the polarization zone, the one at the middle potentials (with a sharp slope) represents the Tafel zone, and the other at the high potentials (horizontal part) represents the diffusion zone. In a Tafel polarization curve, usually the logarithmic current density as a function of potential is presented, and thus the corresponding exchange current density (J0) for each CE can be evaluated from the extrapolated intercepts of the anodic and cathodic branches of the corresponding Tafel curves at the exchange current density axes, as summarized in Table 2. J0 for the (P-A) Gr/NiCo2O4 electrode is higher compared to that of the Pt, Gr* and NiCo2O4* CEs; this means that the (P-A) Gr/NiCo2O4 electrode can trigger the reduction of I3− to I− more effectively than the electrodes mentioned above. Rct can also be calculated by eqn (4) according to the relationship between J0 and Rct for the reduction of I3− ions to I− ions.37 According to the J0 values and eqn (4), it can be deduced that the order of the Rct is NiCo2O4* > Gr* > Pt > (P-A) Gr/NiCo2O4, which is greatly consistent with the CV and EIS results. This indicates that the (P-A) Gr/NiCo2O4 CE can be further explored to replace the expensive Pt as the catalyst for the Pt-free CE in DSSCs, in view of the fact that it is much cheaper than Pt-based DSSCs and exhibits just as high a power conversion efficiency. Furthermore, the influence of solvents on the performance of the Tafel polarization curve was also investigated and J0 for the above-mentioned CEs follows the same order as |Ipc| (see Table 1).
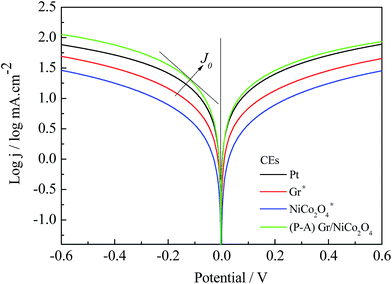 |
| | Fig. 9 Tafel curves of the symmetrical Pt, Gr*, NiCo2O4* and (P-A) Gr/NiCo2O4 CEs. | |
3.5 Photovoltaic performance of DSSCs with different counter electrodes
The J–V characteristics of the DSSCs with different CEs were measured under the optimum conditions at 100 mW cm−2 (AM 1.5 G) irradiation and are presented in Fig. 10a. The corresponding parameters are listed in Table 3. The DSSC with a Pt CE shows a Jsc of 15.23 mA cm−2, a Voc of 0.73 V, a FF of 0.67 and a PCE of 7.43%. The DSSCs based on the Gr* and NiCo2O4* CEs exhibit the poor PCEs of 5.75% and 5.73% due to their poor electrocatalytic activity, and the detailed photovoltaic performance parameters are described in Table 3. When PEDOT:PSS was added to graphene to assist with the conductivity of the catalyst, the DSSC with the (P-A) Gr/NiCo2O4 CE shows a better Jsc value of 16.12 mA cm−2, a Voc of 0.75 V, a FF of 0.67 and a PCE of 8.10%. Comparing the SEM image of the NiCo2O4 particles, it may be said that the unique nanostructure of the Gr/NiCo2O4 nanoparticles has a larger effective surface area, which could lead to the higher Jsc in favor of the (P-A) Gr/NiCo2O4-based DSSC. With the assisting PEDOT:PSS, the electrocatalytic activity is further enhanced, thus the device logically shows a better photovoltaic performance for the synergistic effect of graphene and PEDOT:PSS. Besides, the optimized (P-A) Gr/NiCo2O4-based DSSC shows a higher Voc than that of the other DSSCs, which can be evidenced by the dark current characterization in Fig. 10a. The (P-A) Gr/NiCo2O4-based DSSC possesses a smaller dark current at the same potential, suggesting a lower electron recombination rate for the optimized (P-A) Gr/NiCo2O4-based DSSC than for the other DSSCs. Fig. 10b shows the EIS of the DSSCs based on the Pt, Gr*, NiCo2O4* and (P-A) Gr/NiCo2O4 CEs and the corresponding parameters are listed in Table 3, in which Rct1 means the interfacial charge transfer resistance at the CE and electrolyte, and Rct2 represents the interfacial charge transfer resistance at the dye-sensitized photoanode and the electrolyte. From Fig. 10b and Table 3, the (P-A) Gr/NiCo2O4-based DSSC exhibits a smaller Rct1 and Rct2 than the DSSCs with the Pt, Gr*, and NiCo2O4* CEs. This indicates that the (P-A) Gr/NiCo2O4 CE facilitates fast electron transport at the interface between the I−/I3− electrolyte and the electrodes, and it also can be deduced that the (P-A) Gr/NiCo2O4-based DSSC can indeed improve the charge recombination and has a more outstanding effect than the other DSSCs.
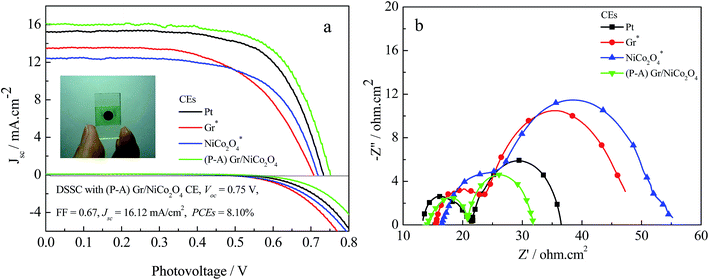 |
| | Fig. 10 J–V characteristics (a), and EIS spectra (b), of the DSSCs fabricated with the Pt, Gr*, NiCo2O4*and (P-A) Gr/NiCo2O4 CEs under the standard illumination. Inset in (a) is the DSSC assembled with (P-A) Gr/NiCo2O4 CE. | |
Table 3 The influence of different CEs on the electrochemical performance and photoelectric properties of the DSSCs
| Electrodes |
Voc (V) |
Jsc (mA cm−2) |
FF |
PCE (%) |
Rct1 (Ω cm−2) |
Rct2 (Ω cm−2) |
| Pt |
0.73 |
15.23 |
0.67 |
7.45 |
8.37 ± 0.02 |
13.78 ± 0.02 |
| Gr* |
0.71 |
13.49 |
0.60 |
5.75 |
9.91 ± 0.02 |
22.77 ± 0.02 |
| NiCo2O4* |
0.72 |
12.44 |
0.64 |
5.73 |
16.08 ± 0.02 |
20.36 ± 0.02 |
| (P-A) Gr/NiCo2O4 |
0.75 |
16.12 |
0.67 |
8.10 |
6.83 ± 0.02 |
10.94 ± 0.02 |
4. Conclusions
An efficient Gr/NiCo2O4 counter electrode with PEDOT:PSS assisted preparation as a Pt-free CE was used in a DSSC. An extensive electrochemical property study indicates that the (P-A) Gr/NiCo2O4 CE exhibits an amazing electrocatalytic ability and low charge transfer resistance for the reduction of I3−, which can compare with that of a Pt CE. Comparative studies found that the dye-sensitized TiO2 nanorods show a stronger absorbing capacity for UV-visible light and a greater loading capability to the dye. The (P-A) Gr/NiCo2O4-based DSSC produces a remarkable improvement in the short-circuit photocurrent, open-circuit voltage and power conversion efficiency. Under the optimum conditions, the DSSC based on the (P-A) Gr/NiCo2O4 CE achieved an enhanced power conversion efficiency of 8.10% under irradiation of 100 mW cm−2, which is comparable to that of the Pt-based DSSC (7.76%). The research presented here is far from being optimized but these profound advantages along with the low-cost synthesis and scalable materials promise the new CE to have great potential and to be a strong candidate in robust DSSCs.
Acknowledgements
The authors are very grateful to the joint support by the National Natural Science Foundation of China (No. U1504624). This work is also supported by China Postdoctoral Science Foundation Funded Project (No. 2015M572102) and the Scientific Research Found of Henan Provincial Department of Science and Technology (No. 122300410107).
References
- B. O’Regan and M. Grätzel, Nature, 1991, 353, 737–740 CrossRef.
- A. Yella, H. W. Lee, H. N. Tsao, C. Yi, A. K. Chandiran, M. K. Nazeeruddin, E. W. Diau, C. Y. Yeh, S. M. Zakeeruddin and M. Grätzel, Science, 2011, 334, 629–634 CrossRef CAS PubMed.
- S. Mathew, A. Yella, P. Gao, R. Humphry-Baker, B. F. E. Curchod, N. Ashari-Astani, I. Tavernelli, U. Rothlisberger, M. K. Nazeeruddin and M. Grätzel, Nat. Chem., 2014, 6, 242–247 CrossRef CAS PubMed.
- M. Grätzel, Nature, 2001, 414, 338–344 CrossRef PubMed.
- F. Bella, C. Gerbaldi, C. Barolo and M. Grätzel, Chem. Soc. Rev., 2015, 44, 3431–3473 RSC.
- H. Choi, H. Kim, S. Hwang, Y. Han and M. Jeon, J. Mater. Chem., 2011, 21, 7548–7551 RSC.
- L. Kavan, J.-H. Yum and M. Grätzel, Nano Lett., 2011, 11, 5501–5506 CrossRef CAS PubMed.
- H. Sun, Y. Luo, Y. Zhang, D. Li, Z. Yu, K. Li and Q. B. Meng, J. Phys. Chem. C, 2010, 114, 11673–11679 CAS.
- M. K. Wang, A. M. Anghel, B. Marsan, N. C. Ha, N. Pootrakulchote, S. M. Zakeeruddin and M. Grätzel, J. Am. Chem. Soc., 2009, 131, 15976–15977 CrossRef CAS PubMed.
- M. X. Wu, Y. D. Wang, X. Lin, N. Yu, L. Wang, L. Wang, A. Hagfeldt and T. L. Ma, Phys. Chem. Chem. Phys., 2011, 13, 19298–19301 RSC.
- L. Kavan, J. H. Yum and M. Grätzel, ACS Nano, 2010, 5, 165–172 CrossRef PubMed.
- G. T. Yue, J. H. Wu, Y. M. Xiao, M. L. Huang, J. M. Lin, L. Q. Fan and Z. Lan, Electrochim. Acta, 2013, 92, 64–70 CrossRef CAS.
- J.-Y. Lin, C.-Y. Chan and S.-W. Chou, Chem. Commun., 2013, 49, 1440–1442 RSC.
- G. Veerappan, K. Bojan and S.-W. Rhee, ACS Appl. Mater. Interfaces, 2011, 3, 857–862 CAS.
- C. Yuan, J. Li, L. Hou, X. Zhang, L. Shen and X. W. Lou, Adv. Funct. Mater., 2012, 22, 4592–4597 CrossRef CAS.
- X. Y. Liu, Y. Q. Zhang, X. H. Xia, S. J. Shi, Y. Lu, X. L. Wang, C. D. Gu and J. P. Tu, J. Power Sources, 2013, 239, 157–163 CrossRef CAS.
- B. Hua, W. Zhang, J. Wu, J. Pu, B. Chi and L. Jian, J. Power Sources, 2010, 195, 7375–7379 CrossRef CAS.
- J. Li, S. Xiong, Y. Liu, Z. Ju and Y. Qian, ACS Appl. Mater. Interfaces, 2013, 5, 981–988 CAS.
- Y. Q. Wu, X. Y. Chen, P. T. Ji and Q. Q. Zhou, Electrochim. Acta, 2011, 56, 7517–7522 CrossRef CAS.
- B. Sun, J. Zhang, P. Munroe, H.-J. Ahn and G. Wang, Electrochem. Commun., 2013, 31, 88–91 CrossRef CAS.
- J. R. Mayhew, D. J. Bozym, C. Punckt and I. A. Aksay, ACS Nano, 2010, 4, 6203–6211 CrossRef PubMed.
- A. Debart, A. J. Paterson, J. Bao and P. G. Bruce, Angew. Chem., Int. Ed., 2008, 47, 4521–4524 CrossRef CAS PubMed.
- L. L. Zhang, X. B. Zhang, Z. L. Wang, J. J. Xu, D. Xu and L. M. Wang, Chem. Commun., 2012, 48, 7598–7600 RSC.
- W. Q. Wu, B. X. Lei, H. S. Rao, Y. F. Xu, Y.-F. Wang, C. Y. Su and D. B. Kuang, Sci. Rep., 2013, 3, 1–7 Search PubMed.
- G. T. Yue, J. H. Wu, Y. M. Xiao, J. M. Lin, M. L. Huang, Z. Lan and L. Q. Fan, Electrochim. Acta, 2012, 85, 182–186 CrossRef CAS.
- Z. Lan, J. H. Wu, J. M. Lin and M. L. Huang, J. Mater. Chem., 2011, 21, 15552–15557 RSC.
- G. T. Yue, F. R. Tan, F. M. Li, C. Chen, W. F. Zhang, J. H. Wu and Q. H. Li, Electrochim. Acta, 2014, 149, 117–125 CrossRef CAS.
- G. T. Yue, J. H. Wu, Y. M. Xiao, M. L. Huang, J. M. Lin and J.-Y. Lin, J. Mater. Chem. A, 2013, 1, 1495–1501 CAS.
- J. Y. Lin, W. Y. Wang and S. W. Chou, J. Power Sources, 2015, 282, 348–357 CrossRef CAS.
- A. Hauch and A. Georg, Electrochim. Acta, 2001, 46, 3457–3466 CrossRef CAS.
- Z.-Q. Li, Y.-P. Que, L.-E. Mo, W.-C. Chen, Y. Ding, Y.-M. Ma, L. Jiang, L.-H. Hu and S.-Y. Dai, ACS Appl. Mater. Interfaces, 2015, 7, 10928–10934 CAS.
- G. T. Yue, W. F. Zhang, J. H. Wu and Q. W. Jiang, Electrochim. Acta, 2013, 112, 655–662 CrossRef CAS.
- W. J. Ke, G. J. Fang, H. Tao, P. L. Qin, J. Wang, H. W. Lei, Q. Liu and X. Z. Zhao, ACS Appl. Mater. Interfaces, 2014, 6, 5525–5530 CAS.
- S. Biallozor and A. Kupniewska, Electrochem. Commun., 2000, 2, 480–486 CrossRef CAS.
- Y. Saito, W. Kubo, T. Kitamura, Y. Wada and S. Yanagida, J. Photochem. Photobiol., A, 2004, 164, 153–157 CrossRef CAS.
- H.-M. Chuang, C.-T. Li, M.-H. Yeh, C.-P. Lee, R. Vittal and K.-C. Ho, J. Mater. Chem. A, 2014, 2, 5816–5824 CAS.
- G. T. Yue, J. H. Wu, J.-Y. Lin, Y. M. Xiao, J. M. Lin, M. L. Huang and Z. Lan, Carbon, 2013, 55, 1–9 CrossRef CAS.
|
| This journal is © The Royal Society of Chemistry 2015 |
Click here to see how this site uses Cookies. View our privacy policy here. ![[thin space (1/6-em)]](https://www.rsc.org/images/entities/char_2009.gif) :
:![[thin space (1/6-em)]](https://www.rsc.org/images/entities/char_2009.gif) 1
1![[thin space (1/6-em)]](https://www.rsc.org/images/entities/char_2009.gif) :
:![[thin space (1/6-em)]](https://www.rsc.org/images/entities/char_2009.gif) 1. The paste of the above mentioned mixtures was prepared by the use of deionized water, ethanol, NMP and PEDOT:PSS as the solvent, respectively, and kept stirring for 12 h. Subsequently, the as-prepared paste was coated on an FTO substrate (8 Ω cm−2, 350 nm thickness, Hartford Glass Co., USA) using a doctor blade method with an area of 0.64 cm2 to form a film with a thickness of ∼6 μm. The obtained electrodes were dried at 100 °C for 12 h in a vacuum oven and marked as (W-A) Gr/NiCo2O4, (E-A) Gr/NiCo2O4, (N-A) Gr/NiCo2O4 and (P-A) Gr/NiCo2O4 CEs, respectively. For comparison, the Gr and NiCo2O4 electrodes mentioned in the manuscript were also prepared by the use of PEDOT:PSS as the solvent and marked as Gr* and NiCo2O4* CEs with a similar method. The Pt electrode was prepared using a three-electrode system.
1. The paste of the above mentioned mixtures was prepared by the use of deionized water, ethanol, NMP and PEDOT:PSS as the solvent, respectively, and kept stirring for 12 h. Subsequently, the as-prepared paste was coated on an FTO substrate (8 Ω cm−2, 350 nm thickness, Hartford Glass Co., USA) using a doctor blade method with an area of 0.64 cm2 to form a film with a thickness of ∼6 μm. The obtained electrodes were dried at 100 °C for 12 h in a vacuum oven and marked as (W-A) Gr/NiCo2O4, (E-A) Gr/NiCo2O4, (N-A) Gr/NiCo2O4 and (P-A) Gr/NiCo2O4 CEs, respectively. For comparison, the Gr and NiCo2O4 electrodes mentioned in the manuscript were also prepared by the use of PEDOT:PSS as the solvent and marked as Gr* and NiCo2O4* CEs with a similar method. The Pt electrode was prepared using a three-electrode system.


