Fabrication of a dendrimer-modified boronate affinity material for online selective enrichment of cis-diol-containing compounds and its application in determination of nucleosides in urine†
Li Gao,
Jin Du,
Chaozhan Wang and
Yinmao Wei*
Key Laboratory of Synthetic and Natural Function Molecule Chemistry of Ministry of Education, College of Chemistry and Materials Science, Northwest University, Xi'an 710069, China. E-mail: ymwei@nwu.edu.cn; Fax: +86-29-88302604; Tel: +86-29-88302604
First published on 3rd December 2015
Abstract
Boronate adsorbents have been widely used in the extraction of cis-diol-containing molecules, but most do not have efficient capacity due to limited binding sites on their surface. In this work, a high binding capacity dendrimer-modified boronate affinity material (SiO2@dBA) was synthesized via introducing tris(2-aminoethyl)amine as branching points and using poly(amidoamine) as the main dendrimeric scaffold before modification by boronate groups. The high density of amino groups on the dendrimer supplied a large number of binding sites for modifying boronate groups. Thus the adsorption capacity (676.8 μmol g−1 for catechol, 771.3 μmol g−1 for dopamine, 770.0 μmol g−1 for adrenaline) of SiO2@dBA was greatly improved. Moreover, when coupled with large-volume injection and online column-switching solid phase extraction, SiO2@dBA was able to capture cis-diols from 10![[thin space (1/6-em)]](https://www.rsc.org/images/entities/char_2009.gif) 000-fold interference and enrichment factors reached up to 497–514, which was 26- to 51-fold higher than those of analogous non-dendrimer materials. Especially, the proposed method exhibited a striking low limit of detection, 0.24 ng mL−1 for cytidine, 0.52 ng mL−1 for uridine, 0.37 ng mL−1 for guanosine, 0.67 ng mL−1 for adenosine. Finally, the method was successfully applied to online determination of trace nucleosides in healthy human urine. In conclusion, the prepared adsorbent has potential to effectively enrich a large range of trace cis-diol substances in real samples.
000-fold interference and enrichment factors reached up to 497–514, which was 26- to 51-fold higher than those of analogous non-dendrimer materials. Especially, the proposed method exhibited a striking low limit of detection, 0.24 ng mL−1 for cytidine, 0.52 ng mL−1 for uridine, 0.37 ng mL−1 for guanosine, 0.67 ng mL−1 for adenosine. Finally, the method was successfully applied to online determination of trace nucleosides in healthy human urine. In conclusion, the prepared adsorbent has potential to effectively enrich a large range of trace cis-diol substances in real samples.
1. Introduction
Cis-diol-containing biomolecules such as glycoproteins, glycopeptides, carbohydrates, catechols and nucleosides play essential roles in many biological processes and are significant in disease diagnosis.1–5 A common feature of most cis-diol-containing biomolecules is that in real samples they usually exist in very low abundance along with abundant interfering components,6 especially in the early phase of cancer and other degenerative diseases, causing considerable difficulty in analysis. Therefore, sample pretreatment including specific capture and effective enrichment processes is necessary prior to instrumental analysis.The applied techniques for isolation and enrichment of cis-diol-containing compounds mainly include lectins,7 hydrazide,8 antibodies,9 hydrophilic interaction liquid chromatography10–12 and boronate affinity chromatography.13–21 Unfortunately, lectins and antibodies are not only difficult to prepare but also are unstable. Although hydrazide chemistry is an efficient method, the reaction step is time-consuming and is easy to cause the change in the structure of the target molecules. As for hydrophilic interaction liquid chromatography, the selectivity is poor. Compared with the above approaches, boronate affinity chromatography gains increasing attention in recent years due to its significant advantages such as high specificity, easy-to-manipulate through pH switch, low cost and compatibility with mass spectrometry (MS).13,22–24
Boronate affinity material is well known as a powerful sorbent for the selective isolation and enrichment of cis-diol-containing compounds. The principle relies on reversible covalent complex formation/dissociation between boronic acids and cis-diols in an alkaline/acidic aqueous solution. Generally, in the evaluation of boronate affinity materials, selectivity and binding capacity are two main characteristics.25 That is to say, materials with strong boronate affinity ability at lower pH condition and high-density boronate affinity groups are essential. To improve selectivity, several strategies have been investigated for synthesizing various aromatic boronic acids or their derivatives with a lower pKa value.26–28 On the other hand, to improve binding capacity, the density of functional groups on the surface of boronate affinity material is required to increase. Based on the styles of material surface modification, boronate affinity materials can be classified into three types, including small molecule-modification, polymer-modification and dendrimer-modification. However, conventional boronate affinity materials with small molecule-modification are not satisfactory due to the limited binding sites on the material surface, which affect the enrichment efficiency of cis-diol molecules.29,30
Recently, the polymer-modification of boronate affinity materials has been developed to improve binding capacity. Li et al. grafted polyethyleneimine onto the surface of Fe3O4@SiO2 before modification by boronate groups. Due to a high density of amino groups, polyethyleneimine polymer can supply a large number of active binding sites, which produced an adsorbent that exhibited a much higher adsorption capacity for cis-diol-containing compounds compared with the analogous materials.31 Ye et al. grafted a fluorescent boronic acid polymer onto a silica surface via surface-initiated atom transfer radical polymerization (SI-ATRP). The obtained composite material contains repeating boronic acid units (polymer brushes) on surface and shows favorable binding capability.32 And recently, our group synthesized an adsorbent with high binding capacity of 513.6 μmol g−1 for catechol and 736.8 μmol g−1 for fructose via the combination SI-ATRP and end-capped technology. Because of high binding capacity, only 2.0 mg of adsorbent could still eliminate interferences and yielded a recovery range of 85.6–101.1% in the enrichment of three cis-diol drugs from plasma.33
The common feature of these polymer-modified boronate materials is that they contain a large number of active binding sites for grafting abundant functional ligands, and the obtained binding densities of functional ligands are much larger than those of small molecule-modification. Unfortunately, these polymer-modified materials still have their own limitations. Xue et al. demonstrated that because of steric hindrance, a large amount of unreacted amino groups on polyethyleneimine may generate strong electrostatic interaction with the analytes, thus affect the boronate affinity adsorption.34 As for SI-ATRP reaction, it must be carried out under strictly anaerobic conditions and heavy metal catalysis, giving rise to pollution.
In contrast, dendrimers display obviously many excellent advantages, such as good solubility and extremely high density of functional groups, and are good candidates for single site catalyst, efficient adsorbents and sensors.35 Wang et al. prepared magnetic molecularly imprinted adsorbent by using the dendronized SiO2-coated magnetic nanoparticles as the supporter, aiming to avoid residual template leakage and to increase the imprinting efficiency. The resulting magnetic molecularly imprinted adsorbent showed high adsorption capacity, fast binding kinetics and good selectivity for trace estrogens.36 Yoo et al. fabricated a functionalized membrane via grafting hyperbranched poly(amidoamine) (PAMAM) onto the surface of poly(tetrafluoroethylene). The grafted membranes successfully adsorbed Cu2+ ions from aqueous solution with an adsorption capacity of 1.42 g m−2 and demonstrated a highly efficient and reusable material for the removal of heavy metal ions.37 Liu et al. synthesized the dendrimer-modified boronic acid-functionalized magnetic nanoparticles, which exhibited high binding capacity and fast binding/desorption speed towards cis-diol-containing compounds.38 Although the advantages of dendrimer-modified materials have been demonstrated, it is still necessary to explore new applications of this type of modification in boronate affinity chromatography.
In this work, a dendrimer-modified boronate affinity material (SiO2@dBA) with high capacity was prepared via introducing tris(2-aminoethyl)amine as branching points and anchoring PAMAM as the main dendrimeric scaffold, followed by reacting SiO2@PAMAM with 4-formylphenylboronic acid (4-foPBA). Considering that online solid phase extraction (SPE) can enhance the analytical efficiency and automation, we employed the SiO2@dBA for column-switching SPE coupled with high performance liquid chromatography (HPLC) with large-volume injection to facilitate the determination process of cis-diol-containing compounds. The selectivity and binding capacity were evaluated. Finally, SiO2@dBA was applied to selectively enrich and analyze four nucleosides (uridine, adenosine, cytidine, guanosine) in healthy human urine.
2. Experimental section
2.1. Chemicals and materials
Spherical silica (5 μm particle size; 70 Å pore size; 440 m2 g−1 surface area) was purchased from LanZhou Insititute of Chemical Physics, Chinese Academy of Sciences (Lanzhou, China); tris(2-aminoethyl)amine was purchased from Ourchem biological technology Co. Ltd (Shanghai, China); 4-(chloromethyl) phenyltrimethoxysilane (4-CPTS) was purchased from Alfa Aesar Chemical Reagent Co. Ltd (Qingdao, China); dopamine hydrochloride, sodium cyanoborohydride, guanosine, adenosine were purchased from Aladdin Chemical Reagent Co. Ltd (Shanghai, China). 4-foPBA, cytidine, uridine were purchased from J&K Chemical Reagent Co. Ltd (Beijing, China); adrenaline was purchased from Sigma-Aldrich Fluka biochemical reagent Co. Ltd (America). Other regents were all of analytical grade.2.2. Synthesis of SiO2@dBA stationary phase
2.3. Characterization of the SiO2@ dBA
Transmission electron microscopy (TEM) was performed on a FEI, Tecnai G2F20 S-TWIN microscope. Specific surface area and pore size analyzer (Tristar II 3020, Micromeritics Instrument Corporation, USA) was used to measure the BET surface area, the cumulative pore volume and the average pore diameter of the adsorbent. The X-ray photoelectron spectroscopy (XPS) analysis (K-Alpha, the rmo Fisher Scientific) was carried out to determine the chemical states. Fourier transform spectrometer (TENSOR 27, Bruker, Germany) was used to determine the surface composition of the adsorbent. Thermal gravimetric analyses (TGA) were performed in an air stream using a Perkin-Elmer STA 6000 thermal analyzer at a heating rate of 10 °C min−1.2.4. Online extraction procedures
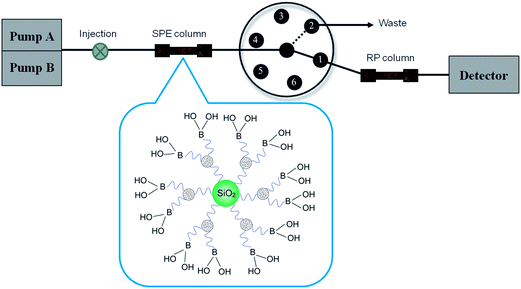
1.0 g of the obtained SiO2@dBA was dispersed into pure methanol and packed into a 50 mm × 4.6 mm I.D. stainless column by multipacking (GY-50B, made in China) at 35 MPa.A column-switching SPE/HPLC system was illustrated in Fig. 2. Briefly, the online extraction includes several steps. (a) Precondition. The 6-port switching valve was set to position 1. The boronate affinity SPE column and the C18 column (5 μm, 4.6 mm × 150 mm) were equilibrated with mobile phase A (5 mM ammonium formate/acetonitrile, pH = 2.5, v/v = 98![[thin space (1/6-em)]](https://www.rsc.org/images/entities/char_2009.gif) :
:![[thin space (1/6-em)]](https://www.rsc.org/images/entities/char_2009.gif) 2) at a flow rate of 1.0 mL min−1. Then the 6-port switching valve was switched to position 2, only the boronate affinity SPE column was equilibrated with mobile phase B (50 mM ammonium chloride, pH = 8.5). (b) Extraction. The 6-port switching valve was kept in position 2. After 10 mL sample solution was injected, mobile phase B was pumped to flow through the boronate affinity column at a flow rate of 1.0 mL min−1 for 5 min. (c) Desorption. After extraction, the 6-port switching valve was switched to position 1 again, and at the same time 100% mobile B was switched to 100% mobile A for desorption and analysis.
2) at a flow rate of 1.0 mL min−1. Then the 6-port switching valve was switched to position 2, only the boronate affinity SPE column was equilibrated with mobile phase B (50 mM ammonium chloride, pH = 8.5). (b) Extraction. The 6-port switching valve was kept in position 2. After 10 mL sample solution was injected, mobile phase B was pumped to flow through the boronate affinity column at a flow rate of 1.0 mL min−1 for 5 min. (c) Desorption. After extraction, the 6-port switching valve was switched to position 1 again, and at the same time 100% mobile B was switched to 100% mobile A for desorption and analysis.
Without column-switching system, the 6-port switching valve was maintained at position 1, 20 μL of the sample was directly injected with mobile phase A (5 mM ammonium formate/acetonitrile, pH = 2.5, v/v = 98![[thin space (1/6-em)]](https://www.rsc.org/images/entities/char_2009.gif) :
:![[thin space (1/6-em)]](https://www.rsc.org/images/entities/char_2009.gif) 2) at a flow rate of 1.0 mL min−1.
2) at a flow rate of 1.0 mL min−1.
2.5. Chromatographic conditions
All chromatographic experiments were performed on a Shimadzu HPLC system (Kyoto, Japan), consisting of two LC-10ATvp pumps, a SCL-10A system controller, a UV-vis detector and a CLASS VP 5.03 chromatography workstation. The chromatographic separation was performed on a VP-ODS column (4.6 mm × 150 mm) at room temperature. The mobile phase was filtered through a 0.45 μm Nylon membrane and degassed ultrasonically prior to use.For the detection of nucleosides, the UV wavelength was set at 260 nm. While for catechol, quinol, salbutamol, dopamine, adrenaline and isoprenaline, the wavelength was set at 280 nm.
2.6. Sample pretreatment
Urine samples were collected from one healthy volunteer from our laboratory, added with sodium metabisulfite (1 mg mL−1) and stored in refrigerator. Then the urine sample was diluted with pure water (1![[thin space (1/6-em)]](https://www.rsc.org/images/entities/char_2009.gif) :
:![[thin space (1/6-em)]](https://www.rsc.org/images/entities/char_2009.gif) 4) and filtered through a 0.45 μm membrane prior to online analysis.
4) and filtered through a 0.45 μm membrane prior to online analysis.
3. Results and discussion
3.1. Preparation of the SiO2@dBA column
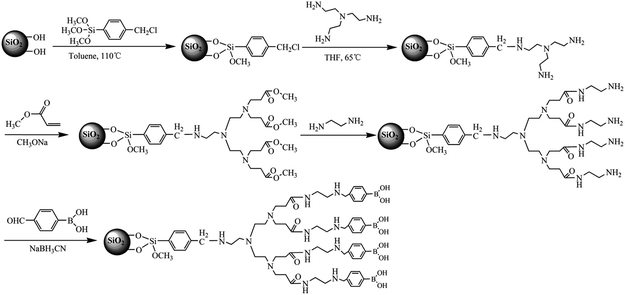
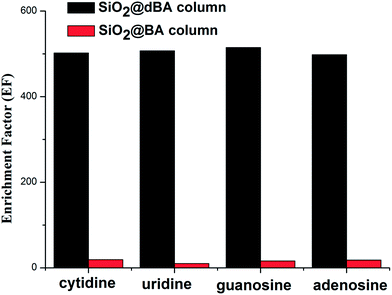
As for traditional PAMAM, G1 generation is often fabricated through two-step reactions: half generation dendrimers terminate with carboxylate ester group, then full generation dendrimers terminate with amino groups.40 In this work, G1 generation was directly synthesized by one-step reaction via introducing tris(2-aminoethyl)amine as branching points, as shown in Fig. 1. Compared with the reported method,40 the present method simplified the process of dendrimer-modification. In addition, abundant functional sites of the boronic acid groups provided the possibility to enhance the binding strength and binding capacity significantly.For comparison, a non-dendrimer-modified boronate affinity column was also prepared using EDA as a substitute of tris(2-aminoethyl)amine and followed by directly grafting 4-foPBA on SiO2@EDA, and the as-prepared adsorbent was marked as SiO2@BA. In this part, the enrichment factor (EF) was determined via online column-switching SPE-HPLC for the determination of nucleosides on both columns. EF is known as the ratio of the analyte concentration in the eluent (Celu) to the initial concentration of the analyte (C0) within the sample.
 | (1) |
As shown in Fig. 3, the EFs of SiO2@dBA column toward four nucleosides exhibited 26–51 folds higher than that of non-dendrimer-modified column. The impressive better extraction ability should be attributed to the highly branched PAMAM dendrimers, which increased the density of boronic acid ligand on the surface of the adsorbent. Furthermore, different EFs between the SiO2@dBA column and SiO2@BA column can prove the successful dendrimer-modification.
3.2. Characterization of SiO2@dBA
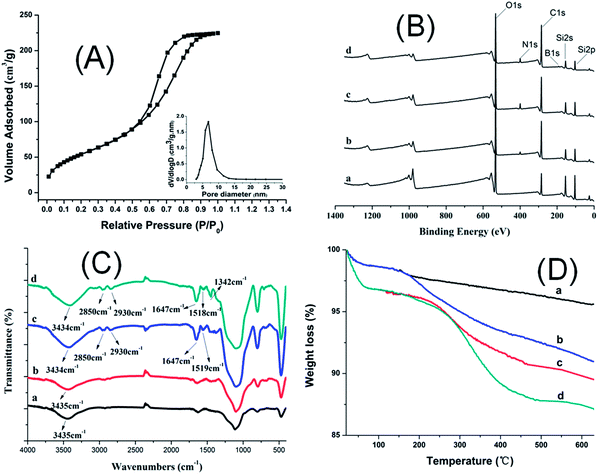
Representative TEM images of bare silica and SiO2@dBA were provided in Fig. S1.† There was no obvious difference between the TEM images of bare silica and SiO2@dBA, suggesting that dendrimer do not appear to block the mesopore.In addition, characterization of the pore structure of SiO2@dBA was also performed by nitrogen adsorption–desorption measurement (Fig. 4A). According to the N2 sorption analysis, the BET surface area of SiO2@dBA was 194 m2 g−1, BJH desorption cumulative volume of pores was 0.34 m3 g−1 and the pore size was 6.8 nm. Compared to that of the bare silica (Table S1†), the SBET and pore volume of SiO2@dBA decreased by about 50%, whereas the pore size decreased by 3%. The behavior of the structural properties demonstrated that the dendrimer grew inside the pore channels, which was consistent with the reported research.41
XPS (Fig. 4B) indicated the strength of N 1s peak at 399.8 eV for SiO2@PAMAM was stronger than that for SiO2@NH2, and the calculated N content increased from 2.27% for SiO2@NH2 to 4.30% for SiO2@PAMAM (Table 1), indicating that the density of amino groups was increased via dendrimer-modification. Higher content of N provided a larger number of active binding sites, and also improved the hydrophilicity of the material. The appearance of a B 1s peak at 191.4 eV on SiO2@dBA exhibited the successful attachment of boronic acid groups onto the SiO2@PAMAM.
| Sample/element | Si 2s/2p (%) | C 1s (%) | O 1s (%) | N 1s (%) | B 1s (%) |
|---|---|---|---|---|---|
| Bare silica | 27.78 | 23.51 | 48.71 | — | — |
| SiO2@NH2 | 16.10 | 48.14 | 33.48 | 2.27 | — |
| SiO2@PAMAM | 17.39 | 44.95 | 33.36 | 4.30 | — |
| SiO2@dBA | 12.43 | 57.19 | 26.03 | 3.69 | 0.66 |
According to the boron content, the density of the grafted 4-foPBA on the silica (μmol m−2) was calculated by the following equation:42
 | (2) |
By combination of the B content and the specific surface area, the surface coverage of 4-foPBA on the silica was calculated to be 3.6 μmol m−2. And according to the coverage, the N content of the obtained SiO2@dBA was calculated to be 3.57%, which was close to the value of 3.69% determined by XPS. So there were few residual amine groups on the surface of SiO2@dBA.
The Fourier transform infrared (FT-IR) spectrum shown in Fig. 4C also indicated the successful modification in different stages. The broad absorption band at 3434 cm−1 corresponded to the stretching vibration of N–H/O–H bonds. For c and d, the band observed at 1647 cm−1 was indicative of C![[double bond, length as m-dash]](https://www.rsc.org/images/entities/char_e001.gif) O stretching while that at 1518 cm−1 could be attributed to the coupling of C–N stretching vibration and N–H bending vibration, which indicated the successful attachment of PAMAM onto the SiO2@NH2. The peaks at 2850 cm−1 and 2930 cm−1 were characteristic of the C–H/CH2 stretching vibration bands. Generally, the SiO2@dBA had similar absorption peaks with the SiO2@PAMAM expect for the typical absorption peak of B–O at 1342 cm−1. The results verified the presence of boric acid groups on the surface of SiO2@dBA.
O stretching while that at 1518 cm−1 could be attributed to the coupling of C–N stretching vibration and N–H bending vibration, which indicated the successful attachment of PAMAM onto the SiO2@NH2. The peaks at 2850 cm−1 and 2930 cm−1 were characteristic of the C–H/CH2 stretching vibration bands. Generally, the SiO2@dBA had similar absorption peaks with the SiO2@PAMAM expect for the typical absorption peak of B–O at 1342 cm−1. The results verified the presence of boric acid groups on the surface of SiO2@dBA.
Furthermore, the indication of the coating formation on the silica surface can be obtained from TGA measurement. As shown in Fig. 4D, the weight loss profile for bare silica, SiO2@NH2, SiO2@PAMAM and SiO2@dBA exhibited two different stages within the range of 25 °C to 500 °C. Below 200 °C, all of them presented a weight loss profile for the release of water or physically adsorbed solvent. And there was an obvious weight loss of 3.8% from 200 °C to 400 °C for SiO2@NH2, and 5.6% and 8.1% for SiO2@PAMAM and SiO2@dBA from 200 °C to 500 °C, respectively. The increased weight loss suggested that tris(2-aminoethyl)amine, the PAMAM dendrimer and 4-foPBA were successfully grafted on the silica.
3.3. Selectivity
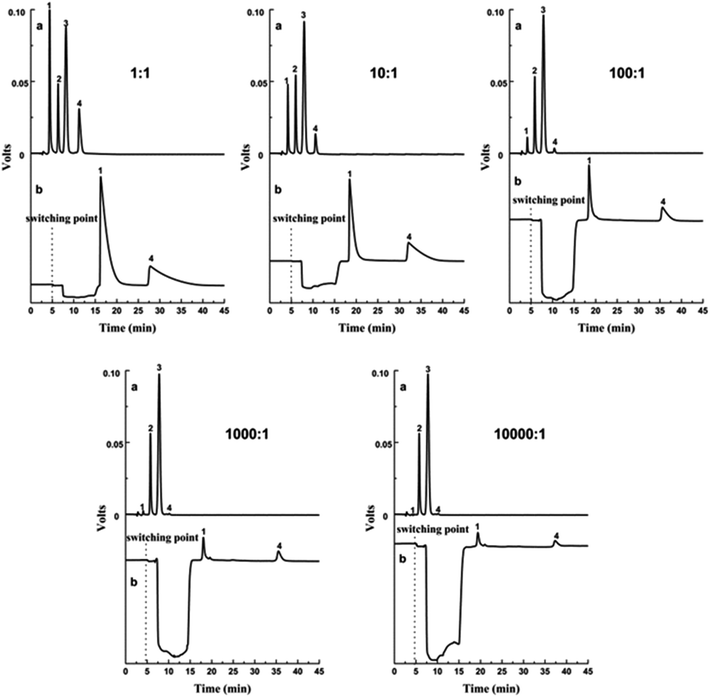
The selectivity of the SiO2@dBA was evaluated by extracting cis-diols isoprenaline and salbutamol from a mixed solution containing non-cis-diols quinol and 2′-deoxyadenosine as interferences. The mixture was extracted and analyzed by online column-switching SPE-HPLC system. The total amount of the cis-diols did not exceed the maximum binding capacity of SiO2@dBA. The molar ratio of interferences to targets was increased from 1![[thin space (1/6-em)]](https://www.rsc.org/images/entities/char_2009.gif) :
:![[thin space (1/6-em)]](https://www.rsc.org/images/entities/char_2009.gif) 1 to 10
1 to 10![[thin space (1/6-em)]](https://www.rsc.org/images/entities/char_2009.gif) 000
000![[thin space (1/6-em)]](https://www.rsc.org/images/entities/char_2009.gif) :
:![[thin space (1/6-em)]](https://www.rsc.org/images/entities/char_2009.gif) 1. Such an experiment design was able to vary the competition adsorption between cis-diols and non-cis-diols, favoring the reflection of the specific binding.
1. Such an experiment design was able to vary the competition adsorption between cis-diols and non-cis-diols, favoring the reflection of the specific binding.
It can be seen from Fig. 5 that isoprenaline and salbutamol could be captured as the molar ratio of interferences and targets increased from 1![[thin space (1/6-em)]](https://www.rsc.org/images/entities/char_2009.gif) :
:![[thin space (1/6-em)]](https://www.rsc.org/images/entities/char_2009.gif) 1 to 100
1 to 100![[thin space (1/6-em)]](https://www.rsc.org/images/entities/char_2009.gif) :
:![[thin space (1/6-em)]](https://www.rsc.org/images/entities/char_2009.gif) 1. Even if the molar ratios went up to 10
1. Even if the molar ratios went up to 10![[thin space (1/6-em)]](https://www.rsc.org/images/entities/char_2009.gif) 000
000![[thin space (1/6-em)]](https://www.rsc.org/images/entities/char_2009.gif) :
:![[thin space (1/6-em)]](https://www.rsc.org/images/entities/char_2009.gif) 1, they were all distinguished from the background after the online SPE procedure. Therefore, the prepared SiO2@dBA exhibited specific selectivity towards cis-diols over non-cis-diol analogs. Moreover, the molar ratio was performed as the concentrations of interferences remained unchanged and the concentrations of the targets reduced gradually. When the concentration of isoprenaline and salbutamol was low to 10 ng mL−1 along with 10
1, they were all distinguished from the background after the online SPE procedure. Therefore, the prepared SiO2@dBA exhibited specific selectivity towards cis-diols over non-cis-diol analogs. Moreover, the molar ratio was performed as the concentrations of interferences remained unchanged and the concentrations of the targets reduced gradually. When the concentration of isoprenaline and salbutamol was low to 10 ng mL−1 along with 10![[thin space (1/6-em)]](https://www.rsc.org/images/entities/char_2009.gif) 000 fold non-cis-diol interferences, their signals after online enrichment could still be detected with UV detection. The high sensitivity was ascribed to the high density of boronate affinity binding sites, which provided the possibility to achieve a low detection limit.
000 fold non-cis-diol interferences, their signals after online enrichment could still be detected with UV detection. The high sensitivity was ascribed to the high density of boronate affinity binding sites, which provided the possibility to achieve a low detection limit.
3.4. Binding/loading capacity
Binding capacity is a crucial factor in affinity chromatography that determines the maximum amount of targets that an affinity column can capture. With offline SPE/HPLC system, the binding capacity of SiO2@dBA was evaluated using static adsorption test with three small cis-diol compounds, catechol, dopamine and adrenaline. The binding isotherms of three cis-diol compounds were examined using different concentrations in the range of 0–1500 μg mL−1. As shown in Fig. S2,† the amounts of three cis-diol compounds bound to SiO2@dBA increased with increasing concentrations until the binding saturation reached. The plateau of the curve corresponds to a maximum binding capacity of 676.8 μmol g−1 for catechol, 771.3 μmol g−1 for dopamine and 770.0 μmol g−1 for adrenaline, respectively. In contrast, the SiO2@PAMAM did not show obvious binding. Clearly, the binding to SiO2@dBA was contributed by the specific interaction between the cis-diols and the surface-modified boronic acid groups. And due to the higher active site density, the binding capacity of SiO2@dBA is much higher than those of the reported extractive materials for cis-diol compounds capture.31,32,43–45 While the binding capacity is similar with that of the polymer-modified material via ATRP and end-capped technology reported by our group.33The sample loading capacity is a measure of the maximum amount of sample that can be injected into the column.46 The “universal” overload curve provides a convenient approach to determine loading capacity. In this work, the overload curves were obtained on the HPLC system only using the SPE column with the same mobile phase as in the online SPE/HPLC system, and the injection volumes from low to high are blank, 5, 10, 20, 50, 100, 150, 200, 250 μL catechol solution (0.25 g mL−1).
As shown in Fig. 6, with larger injection volume, the peak height showed an increasing trend, which was accompanied with the peak broadening at the same time. When the injection volume was less than 100 μL, the retention time of analyte basically remained unchanged. While the injection volume continued to increase, the retention time was shortened obviously and the peak shape was gradually changed to be asymmetrical. When the injection volume was more than 200 μL, the column loading capacity had exceeded the maximum value. In this case, the sample peak was significantly ahead of time, outflowed with the solvent, even overlapped completely. Because once the column was overloaded, a part of the sample could not be reserved, which made the separation process much faster. Thus, it was concluded that the maximum injection volume of catechol was 150 μL, which corresponded to column loading capacity of 170 μmol g−1.
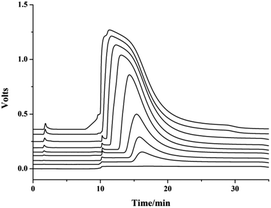 | ||
| Fig. 6 Effect of loading amount of catechol on peak shape. Injection volume from bottom to top: blank, 5, 10, 20, 50, 100, 150, 200, 250 μL. | ||
3.5. Online column-switching SPE-HPLC for the determination of nucleosides
| Analyte | tR (min) | Linear range (ng mL−1) | R2 | LOD (ng mL−1) | LOQ (ng mL−1) | RSD (%, n = 5) | |
|---|---|---|---|---|---|---|---|
| Intra-day | Inter-day | ||||||
| Cytidine | 14.8 | 1.0–50 | 0.9987 | 0.24 | 0.80 | 2.7 | 4.1 |
| Uridine | 16.8 | 2.0–50 | 0.9997 | 0.52 | 1.73 | 7.8 | 8.9 |
| Guanosine | 21.2 | 1.0–50 | 0.9996 | 0.37 | 1.23 | 5.4 | 6.6 |
| Adenosine | 28.6 | 2.0–50 | 0.9998 | 0.67 | 2.23 | 7.9 | 9.9 |
There are two main aspects contributing to such low LODs. On the one hand, the packing material was synthesized by dendrimer-modification, which improved the density of functional groups greatly. On the other hand, the high enrichment performance should be attributed to the online column-switching SPE/HPLC with large-volume injection. To identify this idea, 20 μL of the sample was used under the same condition and no signal can be detected. However, when the injection volume increased to 10 mL, the signal of 1 ng mL−1 sample solution can still be detected with the online enrichment system.
Table 3 showed the comparison of the LODs of the proposed method with some other reported methods in the literature. Results demonstrated that the proposed method for the determination of four nucleosides in the present work showed a lower LODs than that of any other methods expect for the derivatization method. The LODs of the derivatization method was one order of magnitude lower than that of the proposed method, which was due to the introduction of the derivatization and high sensitive MS/MS as detector instead of UV detector.
| Sample treatment | Analytical technique | LOD (ng mL−1) | Reference | |||
|---|---|---|---|---|---|---|
| Cytidine | Uridine | Guanosine | Adenosine | |||
| Online SPE | LC-MS/MS | — | 1.3 | 0.2 | 0.2 | 47 |
| Online SPME | Capillary LC-UV | 48 | 44 | 52 | 40 | 48 |
| Derivatization | LC-MS/MS | 0.037 | 0.16 | 0.026 | 0.034 | 49 |
| PBA column | LC-MS/MS | 80 | 180 | — | 80 | 50 |
| SPE with Oasis MCX | LC-MS/MS | 30 | 75 | — | 30 | 51 |
| Affi-Gel 601 | MEKC-UV | 405 | 259 | 217 | 291 | 52 |
| Affi-Gel 601 | MEKC-UV | 120 | 40 | 160 | 210 | 53 |
| Affi-Gel 601 | CE-MS | 5.03 | 498 | 28.2 | 5.18 | 54 |
| Online SPE-HPLC | LC-UV | 0.24 | 0.52 | 0.37 | 0.67 | This work |
| Analyte | Conc. (ng mL−1) | 1 ng mL−1 | 5 ng mL−1 | 10 ng mL−1 | ||||||
|---|---|---|---|---|---|---|---|---|---|---|
| Recovery (%) | RSD (%) | Recovery (%) | RSD (%) | Recovery (%) | RSD (%) | |||||
| Intra-day | Inter-day | Intra-day | Inter-day | Intra-day | Inter-day | |||||
| Cytidine | 9 | 95 | 4.6 | 4.2 | 99 | 3.5 | 5 | 109 | 1.8 | 2.2 |
| Uridine | 10.2 | 101 | 3.6 | 6.2 | 98 | 2.6 | 5.8 | 100 | 2.5 | 3.2 |
| Guanosine | 13.5 | 103 | 5.3 | 7.3 | 104 | 1.6 | 3.2 | 98 | 3.0 | 3.9 |
| Adenosine | 16.8 | 89 | 4.2 | 9.6 | 90 | 2.7 | 5 | 95 | 2.8 | 4.5 |
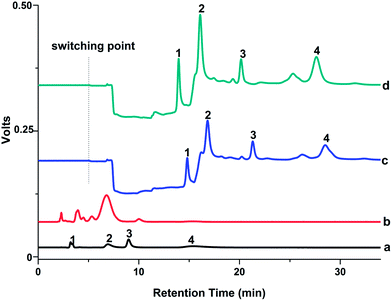
Fig. 7 shows the chromatograms of 2 μg mL−1 nucleoside standard solution, urine sample, online enrichment urine sample without and with spiked with 5 ng mL−1 nucleosides. None of the nucleosides was detected in the blank urine sample without enrichment due to a multitude of interferences originating from urine samples. By contrast, when the urine sample and the spiked urine sample were treated with online enrichment (Fig. 7c and d), only peaks of analytes were presented without interfering peaks. These results demonstrate the applicability of the proposed method for preconcentration and determination of nucleosides in real samples.
4. Conclusion
In this work, an effective adsorbent SiO2@dBA was synthesized to capture cis-diol-containing compounds with online column-switching SPE-HPLC system. Several advantages were shown as follows: (1) by introducing tris(2-aminoethyl)amine, the reaction process of dendrimer-modification was simplified in the preparation of SiO2@dBA. (2) Via dendrimer-modification, the density of amino groups was increased, which provided more binding sites and improved the hydrophilicity of the material. As a result, the prepared adsorbent showed excellent selectivity and remarkable binding capacity toward cis-diols compared with the reported adsorbents. (3) Owing to large-volume injection and online column-switching SPE-HPLC, predominant LODs and EFs made the prepared adsorbent serve as a promising alternative for the pretreatment of large scale biological samples. It is expected that this method can be exploited to widen its application for analysis of other cis-diol-containing biomarkers.Acknowledgements
This work was supported by the National Natural Science Foundation of China (No. 21275115, 21475104 and 21575114).References
- Z. Yang and W. S. Hancock, J. Chromatogr. A, 2004, 1053, 79–88 CrossRef CAS.
- Y. L. Wang, M. B. Liu, L. Q. Xie, C. Y. Fang, H. M. Xiong and H. J. Lu, Anal. Chem., 2014, 86, 2057–2064 CrossRef CAS.
- X. H. Pan, Y. Chen, P. X. Zhao, D. J. Li and Z. Liu, Angew. Chem., Int. Ed. Engl., 2015, 54, 6173–6176 CrossRef CAS.
- M. M. Vivas, E. R. Gonzalo, D. G. Gómez and R. C. Martínez, J. Chromatogr. A, 2015, 1414, 129–137 CrossRef PubMed.
- Y. B. Wu, J. H. Wu, Z. G. Shi and Y. Q. Feng, J. Chromatogr. B: Anal. Technol. Biomed. Life Sci., 2009, 877, 1847–1855 CrossRef CAS PubMed.
- B. Kammerer, A. Frickenschmidt, C. H. Gleiter, S. Laufer and H. Liebich, J. Am. Soc. Mass Spectrom., 2005, 16, 940–947 CrossRef CAS.
- B. F. Mann, A. K. P. Mann, S. E. Skrabalak and M. V. Novotny, Anal. Chem., 2013, 85, 1905–1912 CrossRef CAS PubMed.
- E. W. Song, R. Zhu, Z. T. Hammoud and Y. H. Mechref, J. Proteome Res., 2014, 13, 4808–4820 CrossRef CAS PubMed.
- B. C. Kim, M. K. Ju, A. D. C. Yu and P. Sommer, Anal. Chem., 2009, 81, 2388–2393 CrossRef CAS.
- O. H. Hernandez, R. L. Aguilar, J. E. Q. Lopez, M. L. Sanz and F. J. Moreno, J. Proteomics, 2010, 10, 3699–3711 CrossRef.
- M. P. Y. Lam, S. O. Siu, E. Lau, X. L. Mao, H. Z. Sun, P. C. N. Chiu, W. S. B. Yeung, D. M. Cox and I. K. Chu, Anal. Bioanal. Chem., 2010, 398, 791–804 CrossRef CAS PubMed.
- S. Mysling, G. Palmisano, P. Højrup and M. T. Andersen, Anal. Chem., 2010, 82, 5598–5609 CrossRef CAS.
- H. Y. Li and Z. Liu, TrAC, Trends Anal. Chem., 2012, 37, 148–161 CrossRef CAS.
- J. Tang, Y. Liu, P. Yin, G. P. Yao, G. Q. Yan, C. H. Deng and X. M. Zhang, J. Proteomics, 2010, 10, 2000–2014 CrossRef CAS PubMed.
- Z. J. Liu, K. Ullah, L. P. Su, F. Lv, Y. L. Deng, R. J. Dai, Y. J. Li and Y. K. Zhang, J. Mater. Chem., 2012, 22, 18753 RSC.
- Y. C. Liu, Y. Lu and Z. Liu, Chem. Sci., 2012, 3, 1467 RSC.
- H. Y. Li, H. Y. Wang, Y. C. Liu and Z. Liu, Chem. Commun., 2012, 48, 4115–4117 RSC.
- L. T. Liu, Y. Zhang, L. Zhang, G. Q. Yan, J. Yao, P. Y. Yang and H. J. Lu, Anal. Chim. Acta, 2012, 753, 64–72 CrossRef CAS PubMed.
- S. T. Wang, D. Chen, J. Ding, B. F. Yuan and Y. Q. Feng, Chem.–Eur. J., 2013, 19, 606–612 CrossRef CAS.
- Z. J. Bie, Y. Chen, H. Y. Li, R. H. Wu and Z. Liu, Anal. Chim. Acta, 2014, 834, 1–8 CrossRef CAS PubMed.
- L. Liang and Z. Liu, Chem. Commun., 2011, 47, 2255–2257 RSC.
- R. Tuytten, F. Lemière, W. V. Dongen, E. Witters, E. L. Esmans, R. P. Newton and E. Dudley, Anal. Chem., 2008, 80, 1263–1271 CrossRef CAS.
- J. G. He, Z. Liu, L. B. Ren, Y. C. Liu, P. Dou, K. Qian and H. Y. Chen, Talanta, 2010, 82, 270–276 CrossRef CAS PubMed.
- Q. B. Zhang, N. Tang, J. W. C. Brock, H. M. Mottaz, J. M. Ames, J. W. Baynes, R. D. Smith and T. O. Metz, J. Proteome Res., 2007, 6, 2323–2330 CrossRef CAS PubMed.
- Q. J. Li, C. C. Lü, H. Y. Li, Y. C. Liu, H. Y. Wang, X. Wang and Z. Liu, J. Chromatogr. A, 2012, 1256, 114–120 CrossRef CAS PubMed.
- L. B. Ren, Z. Liu, Y. C. Liu, P. Dou and H. Y. Chen, Angew. Chem., 2009, 121, 6832–6835 CrossRef.
- F. L. Li, X. J. Zhao, W. Z. Wang and G. W. Xu, Anal. Chim. Acta, 2006, 580, 181–187 CrossRef CAS PubMed.
- J. G. He, Z. Liu, P. Dou, J. Liu, L. B. Ren and H. Y. Chen, Talanta, 2009, 79, 746–751 CrossRef CAS PubMed.
- O. Çetinkaya, M. E. Duru and H. Çiçek, J. Chromatogr. B: Anal. Technol. Biomed. Life Sci., 2012, 909, 51–60 CrossRef PubMed.
- P. Dou, L. Liang, J. G. He, Z. Liu and H. Y. Chen, J. Chromatogr. A, 2009, 1216, 7558–7563 CrossRef CAS PubMed.
- H. Li, Y. H. Shan, L. Z. Qiao, A. Dou, X. Z. Shi and G. W. Xu, Anal. Chem., 2013, 85, 11585–11592 CrossRef CAS PubMed.
- Z. F. Xu, K. M. A. Uddin, T. Kamra, J. Schnadt and L. Ye, ACS Appl. Mater. Interfaces, 2014, 6, 1406–1414 CAS.
- W. Wang, M. F. He, C. Z. Wang and Y. M. Wei, Anal. Chim. Acta, 2015, 886, 66–74 CrossRef CAS PubMed.
- Y. Xue, W. J. Shi, B. J. Zhu, X. Gu, Y. Wang and C. Yan, Talanta, 2015, 140, 1–9 CrossRef CAS PubMed.
- A. E. Kadib, N. Katir, M. Bousmina and J. P. Majoral, New J. Chem., 2012, 36, 241–255 RSC.
- S. Wang, R. Y. Wang, X. L. Wu, Y. Wang, C. Xue, J. H. Wu, J. L. Hong, J. Liu and X. M. Zhou, J. Chromatogr. B: Anal. Technol. Biomed. Life Sci., 2012, 905, 105–112 CrossRef CAS.
- H. Yoo and S. Y. Kwak, J. Membr. Sci., 2013, 448, 125–134 CrossRef CAS.
- H. Y. Wang, Z. J. Bie, C. C. Lü and Z. Liu, Chem. Sci., 2013, 4, 4298–4303 RSC.
- B. F. Pan, F. Gao and H. C. Gu, J. Colloid Interface Sci., 2005, 284, 1–6 CrossRef CAS PubMed.
- E. Soršak, J. V. Valh, Š. K. Urekb and A. Lobnik, Analyst, 2014, 140, 976–989 RSC.
- J. P. K. Reynhardt, Y. Yang, A. Sayari and H. Alper, Adv. Funct. Mater., 2005, 15, 1641–1646 CrossRef CAS.
- A. Mizutani, K. Nagase, A. Kikuchi, H. Kanazawa, Y. Akiyama, J. Kobayashi, M. Annaka and T. Okano, J. Chromatogr. A, 2010, 1217, 522–529 CrossRef CAS.
- J. Du, M. F. He, X. M. Wang, H. Fan and Y. M. Wei, Biomed. Chromatogr., 2015, 29, 312–320 CrossRef CAS PubMed.
- D. J. Li, Y. Li, X. L. Li, Z. J. Bie, X. H. Pan, Q. Zhang and Z. Liu, J. Chromatogr. A, 2015, 1384, 88–96 CrossRef CAS PubMed.
- N. Ozdemir, A. Cakir and B. Somturk, Colloids Surf., A, 2014, 445, 40–47 CrossRef CAS.
- J. Dai, P. W. Carr and D. V. McCalley, J. Chromatogr. A, 2009, 1216, 2474–2482 CrossRef CAS PubMed.
- E. R. Gonzalo, D. G. Gomez and R. C. Martinez, J. Chromatogr. A, 2011, 1218, 9055–9063 CrossRef.
- M. L. Chen, S. S. Wei, B. F. Yuan and Y. Q. Feng, J. Chromatogr. A, 2012, 1228, 183–192 CrossRef CAS PubMed.
- C. D. Laourdakis, E. F. Merino, A. P. Neilson and M. B. Cassera, J. Chromatogr. B: Anal. Technol. Biomed. Life Sci., 2014, 967, 127–133 CrossRef CAS PubMed.
- W. Struck, D. Siluk, A. Y. Mpanga, M. Markuszewski, R. Kaliszan and M. J. Markuszewski, J. Chromatogr. A, 2013, 1283, 122–131 CrossRef CAS PubMed.
- L. B. Jeng, W. Y. Lo, W. Y. Hsu, W. D. Lin, C. T. Lin, C. C. Lai and F. J. Tsai, Rapid Commun. Mass Spectrom., 2009, 23, 1543–1549 CrossRef CAS PubMed.
- Y. Q. Jiang and Y. F. Ma, Anal. Chem., 2009, 81, 6474–6480 CrossRef CAS PubMed.
- E. Szymańska, M. J. Markuszewski, K. Bodzioch and R. Kaliszan, J. Pharm. Biomed. Anal., 2007, 44, 1118–1126 CrossRef PubMed.
- S. F. Wang, X. P. Zhao, Y. Mao and Y. Y. Cheng, J. Chromatogr. A, 2007, 1147, 254–260 CrossRef CAS PubMed.
Footnote |
| † Electronic supplementary information (ESI) available. See DOI: 10.1039/c5ra18443f |
| This journal is © The Royal Society of Chemistry 2015 |

