
Template-free synthesis of hierarchical porous calcium carbonate microspheres for efficient water treatment†
Jing Zhang,
Bin Yao,
Hang Ping,
Zhengyi Fu*,
Yu Li*,
Weimin Wang,
Hao Wang,
Yucheng Wang,
Jinyong Zhang and
Fan Zhang
State Key Laboratory of Advanced Technology for Materials Synthesis and Processing, Wuhan University of Technology, Luoshi Road, Wuhan 430070, P. R China. E-mail: zyfu@whut.edu.cn; yu.li@whut.edu.cn
First published on 1st December 2015
Abstract
A uniform, hierarchical porous vaterite calcium carbonate microsphere stacked from nanoparticles is synthesized in dimethylformamide–water (DMF–H2O) mixed solvent without template. We propose a solvent-reaction assisted synthesis of the product by a mesoscale growth pathway. The product shows large removal capacity towards Pb2+, Cd2+ and Zn2+, of 1960 mg g−1, 1040 mg g−1 and 587.3 mg g−1, respectively. It also exhibits efficient and selective adsorption of Congo red (272 mg g−1, 5 min for equilibrium), which is reported for the first time on calcium carbonate. The removal mechanism is demonstrated to be the precipitation transformation for the heavy metal ion sequestration, and adsorption mechanism for the removal of the organic dyes. The good performance of the product is ascribed to the large amount of active adsorption sites provided by the nanoscale building blocks and mesopores, and the short pathway provided by the sunken poles and the hierarchical structure with enhanced mass transfer and decreased blocking of channels.
Introduction
Water treatment has become one of the most important issues for human beings, since leaked toxic heavy metal ions, and organic pollutants from industrial and agricultural waste water pose a health risk for local residents, and also a threat to our ecological system.1,2 Adsorption has been regarded as the most convenient strategy due to its simplicity and low energy consumption.3 However, common adsorbents have limited adsorption capacities and low adsorption rates. Recently, hierarchical nanostructures have attracted substantial interest, as these structures feature a large surface area of adsorption sites originating from the nanometer-sized building blocks, and robust mechanical strength and convenient recycling procedures provided by the overall microstructure.4,5 Moreover, introducing pore structures also promotes the sorption process, as mesopores and micropores provide substantial active sites, and macropores enhance mass transfer and prevent blocking of channels.6,7Calcium carbonate (CaCO3), which is abundant in nature, and features good biocompatibility and biodegradability, is considered to be one of the most promising candidates for application in water treatment.8,9 Due to the higher solubility of calcium carbonate than its product, ion exchange and precipitation transformation were proved to occur between calcium carbonate and some heavy metal carbonates.10–13 Recently, some nanostructured calcium carbonates have been employed to remove heavy metal ions, including calcite, vaterite, and amorphous calcium carbonate.10–13 Yu reports a maximum removal capacity of 1028.21 mg g−1 for Pb2+, and 514.62 mg g−1 for Cd2+ within 2 hours by using polyacrylic acid stabilized amorphous calcium carbonate nanoparticles. Zeng reports double-shelled calcite calcium carbonate microcapsules, which show a maximum removal capacity of around 13 mmol g−1 (2693.6 mg g−1) for Pb2+ and 0.58 mmol g−1 (65.2 mg g−1) for Cd2+ in 24 hours. Although vaterite has a lower specific gravity and higher solubility than calcite, and is more stable than amorphous calcium carbonate, to the best of our knowledge, work on it for heavy metal ion extraction is still limited.13 Ma reports a hierarchical CaCO3–maltose meso/macro porous hybrid material, which has a high removal capacity for Pb2+ and Cd2+. Moreover, the removal of organic dyes using calcium carbonate has been limited to a few reports.14,15
The synthetic strategies of hierarchical calcium carbonate nanostructures usually employ a template.16,17 However, the extra template increases the cost, and complicates the synthetic procedures. A solvent, which can interact with reaction ions, attach to crystal surfaces, and also change the supersaturation degree of the final product, has become one of the tools for developing the template-free strategy for inorganic nanomaterials.5,18–20 To our knowledge, a few reports have focused on the synthesis of hierarchical calcium carbonate nanostructures in mixed solvents, such as ethanol/water, and ethylene glycol/water mixed solvents, whereas the function of the organic solvent is still limited to the conventional solvent effects in these reports.21,22 Recently, we have developed a solvothermal synthesis of calcium carbonate nanoplate assemblies without template, which employed a DMF–H2O mixed solvent as the source of the carbonate ions and the crystal modifier.23 Based on this, we intend to design a polycrystalline nanoparticle assembly by decreasing the reaction ion mobility, and the reaction ion reactivity.
In this work, uniform, hierarchical porous vaterite CaCO3 microspheres are synthesized via a solvothermal reaction in DMF/H2O without template. The as-prepared product shows efficient saturation capacity and rapid sorption kinetics for Pb2+, Cd2+ and Zn2+, where the solid–liquid interfacial precipitation transformation mechanism is demonstrated. Moreover, the product exhibits an efficient and selective adsorption capacity for Congo red, where adsorption is proposed for the removal process, which is reported for the first time on calcium carbonate. Finally, the benign biocompatibility of the product is confirmed by a cell cytotoxicity assay of co-incubation with HepG2 cells for 48 h.
Experimental
Synthetic procedures
Calcium acetate monohydrate (Ca(CH3COO)2·H2O, AR), DMF (C3H7NO, AR) and anhydrous ethanol (C2H6O, GR) were purchased from Sinopharm Chemical Reagent Co. Ltd. Ultrapure water (18.25 MΩ cm) was used throughout the whole experiment. All reagents were used without further purification. We added 100 mg of Ca(CH3COO)2·H2O to 80 ml of DMF/H2O (9![[thin space (1/6-em)]](https://www.rsc.org/images/entities/char_2009.gif) :1 v/v) solvent. The mixture was stirred for one hour, and was then carefully transferred into a Teflon-lined autoclave at the reaction temperature of 110–150 °C. The resultant suspension was centrifuged and washed three times using ultrapure water and anhydrous ethanol, and further dried in a vacuum oven at 60 °C for 12 hours.
:1 v/v) solvent. The mixture was stirred for one hour, and was then carefully transferred into a Teflon-lined autoclave at the reaction temperature of 110–150 °C. The resultant suspension was centrifuged and washed three times using ultrapure water and anhydrous ethanol, and further dried in a vacuum oven at 60 °C for 12 hours.
Characterization
The obtained samples were characterized using field-emission scanning electron microscopy (FESEM, Hitachi S4800, 5 kV), transmission electron microscopy and high-resolution TEM microscopy (HRTEM, JEOL JEM-210OF, 200 kV). The Fourier transform infrared spectra (FT-IR) were collected on a Nicolet 6700 FTIR spectrometer. Thermo-gravimetric and differential scanning calorimetric (TG-DSC) data were recorded on a Netzsch STA 449 F3 thermoanalyzer with air as the carrier gas at a heating rate of 5 °C min−1. N2 adsorption–desorption measurements were performed on a Micromeritics ASAP instrument, using Brunauer–Emmett–Teller (BET) calculations for surface area and Barrett–Joyner–Halenda (BJH) calculations for pore size distribution from the adsorption branch of the isotherm. The concentrations of the heavy metal ion solutions before and after the sorption were measured using inductively coupled plasma atomic emission spectroscopy (ICP-AES) with an Optima 4300DV instrument. UV-vis spectra were recorded on a Shimadzu UV-2550 spectroscope.Heavy metal ion extraction
4 mg of the as-prepared sample was added to 8 ml of the stock heavy metal ion solutions (Pb2+, Cd2+, and Zn2+) in screw-capped containers, and they were stirred for 2 hours at 25 °C. Then the resultant solution was centrifuged at 8000 rpm for 5 minutes to separate the sediment from the solution. The supernatants were collected and measured using ICP-AES to obtain the concentrations of the heavy metal ions left in the solution. The removal capacity (qe) of the sample is calculated by the following equation:| qe = (C0V − CeV)/m0 × 100% |
Congo red adsorption
Different dosages of the as-prepared sample were added to 8 ml of the stock Congo red solution in screw-capped containers, and they were stirred at 25 °C for 2 hours. Then the resultant solution was centrifuged at 8000 rpm for 5 minutes to separate the sediment from the solution. The supernatants were collected and measured using the UV-vis spectroscope to obtain the concentration of the Congo red left in the solution. The removal capacity (qe) of the sample is calculated by the following equation:| qe = (C0V − CeV)/m0 × 100% |
Cell cytotoxicity
The cell cytotoxicity of the hierarchical porous vaterite calcium carbonate microspheres was evaluated using the 48 h MTT (3-(4,5-dimethylthiazol-2-yl)-2,5-diphenyltetrazolium bromide) test. HepG2 cells were seeded and cultured in 96-well plates at a density of 6 × 10⁴ for 24 h before adding serial dilutions of the product. After co-incubation for 48 h, each well was treated with MTT for 4 h, and the formed formazan crystals were then dissolved in the dimethylsulfoxide. The absorbance of the as-formed solution was then measured at 570 nm on a Bio-rad model 550 microplate reader. For each assay, the data were obtained by averaging the values of five wells. The experiment was performed three times and the data were averaged afterward.Results and discussion
A typical sample is synthesized by the in situ reaction of Ca(CH3COO)2 (c = 7 mM) in DMF/H2O mixed solvent (9:1 v/v) at 130 °C for 4 hours. The polymorph, the structure, and the morphology of the sample are presented in Fig. 1. The XRD pattern (Fig. 1a) shows diffraction peaks corresponding to the vaterite polymorph (space group: P63/mmc, JCPDS 33-0268). It is noted that both calcite and aragonite are not detected, which indicates a pure vaterite phase for the product. As shown in Fig. 1b and c, the sample consists of uniform hierarchical porous microspheres.
 | ||
| Fig. 1 (a) XRD pattern, (b and c) FESEM images, (d and e) TEM images, and the inset in (e) is the SAED pattern of the hierarchical porous vaterite microspheres. (f) Nitrogen adsorption–desorption isotherm of the hierarchical porous vaterite microspheres. The inset in (f) is the pore-size distribution profile of the sample calculated from the desorption curve of the nitrogen sorption isotherm. | ||
Specifically, the microspheres (ca. 3.5 μm in diameter) are built from nanoparticles, and feature pores distributed through the entire microsphere. Besides, the hierarchical microsphere is also characteristic of a sunken district near the two “poles” of the microsphere (denoted as sunken poles, herein). TEM images (Fig. 1d and e) show that the sunken district is submicron-sized (500 nm), and the nanoparticle subunit is 30–40 nm in diameter. The SAED image (inset in Fig. 1e) shows a ring-like pattern, and it supports the scenario that the entire microsphere is a polycrystalline structure. It can be seen (Fig. 1c and S1a†) that the microsphere is built via a hierarchical assembly process, which includes the assembly of the nanoparticles into secondary “plate-like” ones, followed by the assembly of the secondary blocks into the microspheres. The high-resolution TEM image (Fig. S1b†) shows clearly resolved lattice fringes ascribed to the vaterite phase. The FT-IR spectrum and the TG-DSC curves are provided in Fig. S2.†
The nitrogen adsorption–desorption isotherm, and the corresponding Barrett–Joyner–Halenda (BJH) pore size distribution curve of the as-obtained sample are shown in Fig. 1f. A type IV isotherm with an obvious hysteresis loop is observed, indicating the presence of mesopores.24 The mesopores are formed via the aggregation of the nanoparticles, and thus are secondary mesopores. The sample has a Brunauer–Emmett–Teller (BET) surface area of 125 m2 g−1, and an average pore size of 40 nm. The specific surface area is larger than those reported by Ma et al. (63.2 m2 g−1) and Yu et al. (19.60 m2 g−1).13,21 Moreover, the products could be well obtained in a broad temperature range (110–150 °C), as shown in Fig. S3.† Thus, uniform, hierarchical, porous vaterite microspheres built from nanoparticles, with mesopores and sunken poles are successfully synthesized via the one-pot strategy. The large BET surface area, the nanoscale subunits, and the mesoporous structure are favourable for ion adsorption, exchange, and diffusion, and provide substantial active adsorption sites for organic dyes, rendering them suitable for water treatment.
To reveal the formation mechanism of the product, a time-dependant morphological evolution process was performed. As shown in Fig. 2, the hierarchical porous vaterite calcium carbonate microspheres were formed via a mesoscale growth pathway. As shown in Fig. 2a, the primary particles observed after reaction for 1.5 h have a particle size of around 40–60 nm. From the ED pattern, and the HRTEM image in Fig. 2b, we can see that these particles are amorphous, and they are used as the precursor for the formation of the vaterite phase afterwards, which is consistent with previous work.9 As the time was prolonged to 1.75 hours, the amorphous calcium carbonate (ACC) particles become crystallized, as shown by the quasi ring-like electron diffraction pattern inset in Fig. 2c. Meanwhile, the nanoparticles aggregated into the round cake-like intermediate particles of around 1 μm in diameter, and 400 nm thick (Fig. S4a†). Finally, after the reaction was extended to 4 hours, the hierarchical porous vaterite microspheres with sunken poles are matured (Fig. 2d and S4b†), indicating the growth along the lateral and the vertical directions of the microspheres, as well as the further crystallization process.
 | ||
| Fig. 2 Tentative scheme of the formation process of the hierarchical porous vaterite microspheres. (a) TEM image and (b) HRTEM image of the primary amorphous calcium carbonate precursor after reaction for 1.5 hours. Inset in (a) is the enlarged TEM image, while the SAED pattern is inset in (b). (c) TEM image of the intermediates after reaction for 1 hour and 45 minutes. The SAED pattern is inset in (c). (d) TEM image of the matured product at the final stage, after reaction for 4 hours. The inset is the corresponding SAED pattern, as indexed by the (114), (112), and (220) crystal planes of vaterite. | ||
The TG-MS result (Fig. S5a–c†) shows a variety of species released as temperature increases (starting at T = 80–90 °C), that are H2O, (CH3)2NCOH, CO2, and (CH3)2NH. Amino-bearing organics have been demonstrated to stabilize vaterite, and also direct the assembly process.25 Thus, in this system, in situ produced (CH3)2NH2+ was proposed to adsorb on the surface of the primary amorphous precursor, playing an important role in stabilizing the vaterite nanoparticles, and also assembling them into the hierarchical porous vaterite microspheres. This proposal may be verified by the FT-IR spectrum of the product (see Fig. S2a†), where the absorption bands of 2922 cm−1 and 2507 cm−1 are likely assigned to C–H stretching, and the stretching vibration of N–H in R2-NH2+ or R3-NH+. The vaterite polymorph was selected, possibly because the DMF/H2O mixed solvent decreased the reactivity and mobility of the reactive ions, resulting in a sluggish crystallization process, and also an increased supersaturation tendency of calcium carbonate, which is considered favourable for synthesizing the kinetically stable phase. This polymorph selection has already been reported in our previous work, and also in previous binary solvents, such as ethanol/water systems.21,23,26–28 Otherwise, the gas bubbles of CO2, (CH3)2NH, and the evaporated (CH3)2NCHO and H2O lead to the formation of pore structures in the final product. Similar to our recent work, the synthesis of the product lies in the in situ produced carbonate ion, and the crystal modifier employed in situ by the DMF/H2O solvent, quite different from its conventional function as a mere solvent or reducing reagent.29 It is also reasonably expected that the nanoparticle assemblies, rather than nanoplate assemblies, are formed because of the decreased reaction ion reactivity, and mobility, which result in a more sluggish crystallization process, and thus the suppression of the fusion of the primary nanoparticles.
The maximum removal capacity (qmax) for Pb2+, Cd2+ and Zn2+ of the self–assembled porous vaterite calcium carbonate microspheres was determined using isothermal removal tests. As shown in Fig. 3a, the removal capacities for Pb2+, Cd2+ and Zn2+ of the sample increase with the initial concentrations (C0), and then reach equilibrium afterward. The qmax is 1960 mg g−1 (15.68 mg m−2) for Pb2+, 1040 mg g−1 (8.32 mg m−2) for Cd2+, and 587.3 mg g−1 (4.69 mg m−2) for Zn2+. A short equilibrium time of 10 min is reached for Pb2+, 30 min for Cd2+, and 60 min for Zn2+, demonstrating the rapid removal processes (Fig. 3b). The Pb2+ and Cd2+ removal performances of the sample are superior to many inorganic nanomaterials, such as urchin-like α-FeOOH hollow spheres, hierarchical flower-like γ-AlOOH hierarchical superstructures, carbon aerogel, few-layered graphene oxide nanosheets etc., which are provided in Table S1.†10,30–33 The maximum Zn2+ removal capacity is also considerably higher compared to some inorganic sorbents.3 We propose that the large Pb2+, Cd2+ and Zn2+ removal capacities are ascribed to the nanoscale subunits, mesopores, and large surface area of adsorption sites. Actually, the sample shows almost equivalent removal capacity per mole for Pb2+, Cd2+, and Zn2+ (9.45 mmol g−1 for Pb2+, 9.25 mmol g−1 for Cd2+, and 8.98 mmol g−1 for Zn2+), which are visually seen by the points in Fig. 3c.
 | ||
| Fig. 3 (a) Removal capacity of the hierarchical porous vaterite microspheres for Pb2+, Cd2+, and Zn2+ according to the isothermal adsorption experiments. (b) Removal percentage of Pb2+, Cd2+, and Zn2+ at different time intervals, C = 4 mM and Cadsorbent = 0.5 g L−1. (c) The maximum removal capacity of the hierarchical porous vaterite microspheres for Pb2+, Cd2, and Zn2+. | ||
To elucidate the mechanism of the large removal capacity of the product, we tested the sediments at different time intervals during the removal process. From the XRD patterns in Fig. 4a, we find that the sediments have completely transformed into cerussite lead carbonate after only 10 min contact. The FESEM images (Fig. 4b and c) show typical rod-like morphology of the cerussite lead carbonate, and the EDS mapping image (Fig. 4d) further supports the transformation. We did not capture the intermediates for the Pb2+ removal, because the transformation for Pb2+ was considerably rapid. The XRD patterns and the FESEM images in Fig. 4e–h indicate the transformation from vaterite calcium carbonate into otavite cadmium carbonate. The intermediates collected after 10 minute contact are shown in Fig. 4f. It can be seen that the interfacial reactions initiate on the surface of the microspheres, resulting in the formation of the rhombohedral otavite cadmium carbonate distributed on the surface of the microspheres. The EDS mapping image (Fig. 4g) also supports this scenario. The XRD patterns and the FESEM images in Fig. 4i–l show that the sediments after Zn2+ removal are the complex hierarchical architecture of zinc carbonate and basic zinc carbonate built with tiny nanoparticles (the broadening of the diffraction peaks of the XRD pattern supports this view). Actually, the solubility products of the sample and the precipitates after the removal of heavy metal ions are favoured for the transformation (Ksp (PbCO3) = 1.5 × 10⁻¹³, Ksp (CdCO3) = 1.0 × 10⁻¹², Ksp (ZnCO3) = 1.2 × 10⁻¹⁰, Ksp (CaCO3) = 4.9 × 10⁻⁹). We have detected calcium ions during the sorption studies with the heavy metal ions. The relationship is obvious and expected, that is, the amount of calcium ions released in the solution is almost identical to that of the heavy metal ions which precipitate into the corresponding carbonates, indicating that ion exchange and precipitation transformation occur during the sorption process. Thus, the above results demonstrate a precipitation transformation mechanism for the extractions of Pb2+, Cd2+ and Zn2+.10–13 Compared to previous systems based on the solid–liquid interfacial reaction mechanism, the transformation percentages are calculated to be as high as 94% for Pb2+, 92% for Cd2+, and 90.4% for Zn2+ within 2 h. We believe that the nanoscale subunits and mesopores result in a large number of active sites, and the sunken poles and hierarchical structure (especially the voids between the secondary plate-like structures) provide a short pathway for enhanced mass transfer, and decreased blocking of channels,7 and contribute to the high transformation percentages, thus leading to efficient and rapid extraction of Pb2+, Cd2+, and Zn2+.
 | ||
| Fig. 4 (a) XRD patterns of the hierarchical porous vaterite microspheres and the sediment after mixing with 7 mM Pb2+ solution for 120 min, (b and c) FESEM images of the sediments after mixing with 7 mM Pb2+ solution for 120 min, and (d) EDS mapping image of the corresponding sediments. (e) XRD patterns of the product and the sediments after mixing with 7 mM Cd2+ solution for 10 min, and 120 min, (f and h) FESEM images of the sediments after mixing with 7 mM Cd2+ solution for (f) 10 min, and (h) 120 min, and (g) EDS mapping image of the corresponding sediments. (i) XRD patterns of the hierarchical porous vaterite microspheres and the sediments after mixing with 7 mM Zn2+ solution for 120 min. (j and k) FESEM images of the sediments after mixing with 7 mM Zn2+ solution for 120 min. (l) EDS mapping image of the corresponding sediments. We note that the sediments are cerussite lead carbonate for Pb2+ extraction, otavite cadmium carbonate for Cd2+ extraction, and a mixture of zinc carbonate and basic zinc carbonate for Zn2+ extraction. | ||
To further demonstrate the advantage of the hierarchical porous CaCO3 microspheres in water treatment, we evaluated the performance of this material in the removal of organic dyes at room temperature. Congo red was used as the model organic water pollutant for the trial. Fig. 5a shows the UV-vis absorption spectra of the Congo red solution after being treated with different amounts of the hierarchical porous CaCO3 microspheres at an initial Congo red concentration of 0.1 mM. It can be seen that Congo red can be completely removed when the amount of the hierarchical porous CaCO3 microspheres reaches 1 g L−1. The adsorption isotherm in Fig. 5b shows the relation between the equilibrium adsorption capacity (qe) of the hierarchical porous CaCO3 microspheres and the equilibrium concentration of the Congo red solution. The removal percentage of the Congo red solution can reach as high as 96.5%, when the initial concentration was 69.7 mg L−1. As can be seen, the qe almost increases linearly with the increased initial concentration at the low concentration ranges, and the linear growth of the qe is retarded at higher initial concentrations. This is ascribed to the decreased vacant sites of the adsorbent, as a large quantity of the dye molecules have occupied most of the vacant sites. The maximum adsorption capacity towards Congo red by the hierarchical porous CaCO3 microspheres is 272 mg g−1. The isotherm is L-type, indicating the high affinity of Congo red for the hierarchical porous CaCO3 microspheres. The adsorption kinetics in Fig. 5c shows that a removal efficiency of 86.3% can be achieved within the first 1 min for Congo red, at an initial concentration of 0.1 mM. The adsorption removal of Congo red was rapid at the initial time period (5 min), and then it decreases gradually to reach equilibrium with prolonged time. This is because a large number of vacant adsorption sites on the hierarchical porous vaterite microspheres are available at the initial stage, and after a time period, the remaining vacant adsorption sites are difficult to occupy as a result of the repulsive forces between the dye molecules adsorbed on the solid and free in the solution. The adsorption process is rapid, which is visually seen by the digital images inset (Fig. 5c). The performance of the product is superior to some inorganic nanomaterials, such as MnO2 hierarchical hollow nanostructures, FeOOH hierarchical nanostructures, etc., and comparable to the urchin-like α-FeOOH hollow spheres, which are presented in Table S2.†5,34–36
 | ||
| Fig. 5 (a) UV-vis absorption spectra of the Congo red (CR) solutions after being treated with different concentrations of the hierarchical porous CaCO3 microspheres. The initial concentration of Congo red c0 = 0.1 mM. (b) Adsorption isotherm and percentage removal of Congo red as a function of the equilibrium concentration. (c) Adsorption kinetics of the hierarchical porous CaCO3 microspheres at an initial concentration of Congo red c0 = 0.1 mM. Inset are the digital images of the initial Congo red solution and the supernatant after adsorption for 5 min. | ||
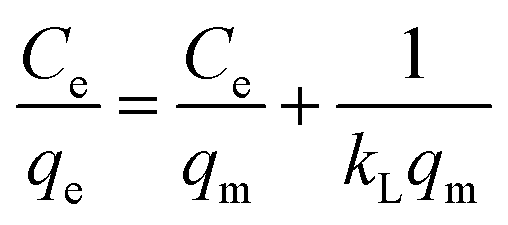
The Langmuir isotherm model (eqn (1)) and the Freundlich isotherm model (eqn (2)) are used to describe the adsorption process.37,38
 | (1) |
 | (2) |
 | (3) |
 | (4) |
 | ||
| Fig. 6 Fitting plots of (a) Langmuir isotherm model, and (b) Freundlich isotherm model for the adsorption of Congo red on the hierarchical porous CaCO3 microspheres. (c) Pseudo-first-order kinetic plots, and (d) pseudo-second-order kinetic plots for the adsorption of Congo red on the hierarchical porous CaCO3 microspheres (initial concentration: 0.1 mM, dosage of the product: 0.5 g L−1) (e) FT-IR spectra of the hierarchical porous CaCO3 microspheres (CaCO3), Congo red (CR), and Congo red adsorbed CaCO3 (CaCO3-CR). (f) Removal capacity of the hierarchical porous CaCO3 microspheres for Congo red (CR), methylene blue (MB) and rhodamine 6G (Rh6G), with the initial concentration of the organic dye of 0.6 mM. | ||
The mechanism for the removal of Congo red is proved to be the adsorption process, which is characterized by the FT-IR spectra (Fig. 6e) and the FESEM images (Fig. S6†) of the sediments after being treated with the hierarchical porous CaCO3 microspheres. From the FESEM images in Fig. S6,† we can see that no obvious morphological and structural transformations are observed for the sediments, indicating the structural stability of the hierarchical porous CaCO3 microspheres. From the FT-IR spectra in Fig. 6e, the absorption bands of Congo red (CR) are present in the absorption bands of the CR absorbed hierarchical porous CaCO3 microspheres (CaCO3-CR), indicating that the Congo red molecules have been anchored to the surface of the hierarchical porous CaCO3 microspheres. No other absorption bands are found in the absorption bands of CaCO3-CR, indicating that the absorption process is speculated to be physical adsorption.41 The sediments became red after the treatment, which is also consistent with the attachment process. Besides, the amount of calcium ions released into the solution can be almost neglected, indicating the adsorption process for the removal of organic dyes. It is clear that the adsorption process for Congo red is quite different from the precipitation transformation mechanism for the removal of heavy metal ions. Moreover, it should also be noted from Fig. 6f, that the hierarchical porous CaCO3 microspheres have a considerably larger adsorption capacity for Congo red than for methylene blue and rhodamine 6G. This can probably be ascribed to the strong electrostatic interaction between the positively charged surface of the hierarchical porous CaCO3 microspheres ((CH3)2NH+ modified surface) and the negatively charged Congo red molecule, whereas the electrostatic interactions are weak for methylene blue and rhodamine 6G as they are both positively charged. Thus, the effective adsorption of Congo red is ascribed to a large number of active sites from the nanoscale subunit and mesopores, the electrostatic interaction, and the short pathway provided by the sunken poles and the hierarchical structure, which enhance the mass transfer and prevent the blocking of the channels to a certain extent.7
The biocompatibility of the product was confirmed using a cell cytotoxicity test. As shown in Fig. S7a,† the viability of the HepG2 cells is over 80% after 48 hours co-incubating with the hierarchical porous vaterite microspheres, even at a concentration of 300 μg ml−1. The fluorescence images (Fig. S7b and c†) show the fluorescent stained nucleus of the HepG2 cells with 0 μg ml−1 and 12.5 μg ml−1 of the product after 48 h. Compared to the blank group, the HepG2 cells do not show noteworthy cell death after the co-incubation, further demonstrating the non-toxic nature of the product. Above all, the efficient and rapid extraction of Pb2+, Cd2+ and Zn2+, the favourable adsorption of Congo red, the good biocompatibility, and the convenient synthetic route, together render the hierarchical porous vaterite calcium carbonate microspheres a promising candidate for water treatment in some circumstances.
Conclusions
In summary, we developed a one-pot strategy for synthesizing hierarchical porous vaterite calcium carbonate microspheres via a solvothermal reaction. Multiple roles of the DMF/H2O solvent are explored. Combined with the conventional solvent effect, we demonstrate that the in situ produced carbonate ions contribute to CaCO3 crystallization; the in situ produced positively charged dimethylamine ions and gas bubbles are important for composing the hierarchical porous vaterite calcium carbonate microspheres. The product shows good capacity for removing Pb2+ (1960 mg g−1), Cd2+ (1040 mg g−1), and Zn2+ (587.3 mg g−1), and efficient and selective adsorption of Congo red (272 mg g−1), and also benign biocompatibility, making it a promising candidate for water treatment. The high performances are ascribed to the rapid and sufficient interfacial-reaction processes for the heavy metal ion removal, and the favourable adsorption process for the organic dye extraction, which are ascribed to the large number of active sites provided by the nanoscale subunit and mesopores, and the short pathway provided by the sunken poles and the hierarchical structure.Acknowledgements
This work was financially supported by the National Natural Science Foundation of China (51521001) and the Ministry of Science and Technology of China (2015DFR50650).Notes and references
- J.-S. Hu, L.-S. Zhong, W.-G. Song and L.-J. Wan, Adv. Mater., 2008, 20, 2977 CrossRef CAS.
- H.-W. Liang, X. Cao, W.-J. Zhang, H.-T. Lin, F. Zhou, L.-F. Chen and S.-H. Yu, Adv. Funct. Mater., 2011, 21, 3851 CrossRef CAS.
- Y. Ide, N. Ochi and M. Ogawa, Angew. Chem., Int. Ed., 2011, 50, 654 CrossRef CAS PubMed.
- L. S. Zhong, J. S. Hu, H. P. Liang, A. M. Cao, W. G. Song and L. J. Wan, Adv. Mater., 2006, 18, 2426 CrossRef CAS.
- B. Wang, H. Wu, L. Yu, R. Xu, T.-T. Lim and X. W. Lou, Adv. Mater., 2012, 24, 1111 CrossRef CAS PubMed.
- A. Sayari, S. Hamoudi and Y. Yang, Chem. Mater., 2005, 17, 212 CrossRef CAS.
- P. Tian, X. Y. Han, G. L. Ning, H. X. Fang, J. W. Ye, W. T. Gong and Y. Lin, ACS Appl. Mater. Interfaces, 2015, 5, 12411 Search PubMed.
- D. Walsh and S. Mann, Nature, 1995, 377, 320 CrossRef CAS.
- E. M. Pouget, P. H. H. Bomans, J. A. C. M. Goos, P. M. Frederik, G. de With and N. A. J. M. Sommerdijk, Science, 2009, 323, 1455 CrossRef CAS PubMed.
- G.-B. Cai, G.-X. Zhao, X.-K. Wang and S.-H. Yu, J. Phys. Chem. C, 2010, 114, 12948 CAS.
- X. Q. Li, Z. Feng, Y. Xia and H. C. Zeng, Chem.–Eur. J., 2012, 18, 1945 CrossRef CAS PubMed.
- Y. S. Al-Degs, M. I. El-Barghouthi, A. A. Issa, M. A. Khraisheh and G. M. Walker, Water Res., 2006, 40, 2645 CrossRef CAS PubMed.
- X. M. Ma, L. P. Li, L. Yang, C. Y. Su, K. Wang, S. B. Yuan and J. G. Zhou, J. Hazard. Mater., 2012, 209, 467 CrossRef PubMed.
- Y. Liu, Y. C. Jiang, M. C. Hu, S. N. Li and Q. G. Zhai, Chem. Eng. J., 2015, 273, 371 CrossRef CAS.
- D. H. Zhao and H. W. Gao, Environ. Sci. Pollut. Res., 2010, 17, 97 CrossRef CAS PubMed.
- W. Wei, G.-H. Ma, G. Hu, D. Yu, T. McLeish, Z.-G. Su and Z.-Y. Shen, J. Am. Chem. Soc., 2008, 130, 15808 CrossRef CAS PubMed.
- S. F. Chen, S. H. Yu, T. X. Wang, J. Jiang, H. Colfen, B. Hu and B. Yu, Adv. Mater., 2005, 17, 1461 CrossRef CAS.
- S. S. Wang and A. W. Xu, CrystEngComm, 2013, 15, 376 RSC.
- W. Lueangchaichaweng, N. R. Brooks, S. Fiorilli, E. Gobechiya, K. Lin, L. Li, S. Parres-Esclapez, E. Javon, S. Bals, G. Van Tendeloo, J. A. Martens, C. E. A. Kirschhock, P. A. Jacobs and P. P. Pescarmona, Angew. Chem., Int. Ed., 2014, 53, 1585 CrossRef CAS PubMed.
- C. R. Jiao, D. M. Chen and J. F. Tong, Adv. Mater. Res., 2010, 106, 794 CrossRef.
- S. F. Chen, S. H. Yu, J. Jiang, F. Q. Li and Y. K. Liu, Chem. Mater., 2006, 18, 115 CrossRef CAS.
- B. V. Parakhonskiy, A. Haase and R. Antolini, Angew. Chem., Int. Ed., 2012, 51, 1195 CrossRef CAS.
- J. Zhang, Y. Li, H. Xie, B. L. Su, B. Yao, Y. X. Yin, S. P. Li, F. Chen and Z. Y. Fu, ACS Appl. Mater. Interfaces, 2015, 7, 15686 CAS.
- S. Lowell, J. E. Shields, M. A. Thomas and M. Thommes, Characterization of Porous Solids and Powders: Surface Area, Pore Size and Density, Kluwer, London, 2004 Search PubMed.
- Y. C. Zhu, Y. Y. Liu, Q. C. Ruan, Y. Zeng, J. W. Xiao, Z. W. Liu, L. F. Cheng, F. F. Xu and L. L. Zhang, J. Phys. Chem. C, 2009, 113, 6584 CAS.
- K. K. Sand, J. D. Rodriguez-Blanco, E. Makovicky, L. G. Benning and S. L. S. Stipp, Cryst. Growth Des., 2012, 12, 842 CAS.
- B. G. Mao, D. Q. Chu, A. X. Wang, L. M. Wang, H. M. Sun, Z. Y. Zhang and X. Z. Yang, Eur. J. Inorg. Chem., 2013, 35, 5958 CrossRef.
- Y. D. Hu, Y. H. Zhou, X. R. Xu and R. K. Tang, Cryst. Res. Technol., 2015, 50, 312 CrossRef CAS.
- X. H. Guo, S. H. Yu and G. B. Cai, Angew. Chem., Int. Ed., 2006, 45, 3977 CrossRef CAS PubMed.
- H. Gao, Y. Sun, J. Zhou, R. Xu and H. Duan, ACS Appl. Mater. Interfaces, 2012, 5, 425 Search PubMed.
- R. Demir-Cakan, N. Baccile, M. Antonietti and M.-M. Titirici, Chem. Mater., 2009, 21, 484 CrossRef CAS.
- Y. H. Li, J. Ding, Z. K. Luan, Z. C. Di, Y. F. Zhu, C. L. Xu, D. H. Wu and B. Q. Wei, Carbon, 2003, 41, 2787 CrossRef CAS.
- G. X. Zhao, J. X. Li, X. M. Ren, C. L. Chen and X. K. Wang, Environ. Sci. Technol., 2011, 45, 10454 CrossRef CAS PubMed.
- J. B. Fei, Y. Cui, X. H. Yan, W. Qi, Y. Yang, K. W. Wang, Q. He and J. B. Li, Adv. Mater., 2008, 20, 452 CrossRef.
- J. B. Fei, Y. Cui, J. Zhao, L. Gao, Y. Yang and J. B. Li, J. Mater. Chem., 2011, 21, 11742 RSC.
- Z. H. Huang, X. Y. Zheng, W. Lv, M. Wang, Q. H. Yang and F. Y. Kang, Langmuir, 2011, 27, 7558 CrossRef CAS PubMed.
- I. Langmuir, J. Am. Chem. Soc., 1918, 40, 1361 CrossRef CAS.
- H. Freundlich, Colloid and Capillary Chemistry, Methuen, London, 1926 Search PubMed.
- Y. S. Ho and G. McKay, Chem. Eng. J., 1998, 70, 115 CrossRef CAS.
- M. M. Ayad and A. A. El-Nasr, J. Phys. Chem. C, 2010, 114, 14377 CAS.
- L. Meng, X. F. Zhang, Y. S. Tang, K. H. Su and J. Kong, Sci. Rep., 2015, 5, 7910 CrossRef CAS PubMed.
Footnote |
| † Electronic supplementary information (ESI) available: The supplementary characterization of the product, the TG-DSC curves, and TG-MS curves of the DMF/H2O mixed solvents, the statistical table of the maximum removal capacities of various inorganic adsorbents for Pb2+, Cd2+, and Congo red, and the cell cytotoxicity profile of the product. See DOI: 10.1039/c5ra18366a |
| This journal is © The Royal Society of Chemistry 2016 |