
3-Hydroxypropionaldehyde (3-HPA) quantification by HPLC using a synthetic acrolein-free 3-hydroxypropionaldehyde system as analytical standard†
G. Burgé‡
abc,
A. L. Flourat‡ade,
B. Polletbc,
H. E. Spinnlerbc and
F. Allais*abc
aChaire Agro-Biotechnologies Industrielles (ABI), AgroParisTech, F-51100 Reims, France. E-mail: florent.allais@agroparistech.fr; Tel: +33 326364368
bAgroParisTech, UMR 782 Génie et Microbiologie des Procédés Alimentaires (GMPA), F-78850 Thiverval-Grignon, France
cINRA, UMR 782 Génie et Microbiologie des Procédés Alimentaires (GMPA), F-78850 Thiverval-Grignon, France
dAgroParisTech, Institut Jean-Pierre Bourgin (IJPB), F-78026 Versailles Cedex, France
eINRA, Institut Jean-Pierre Bourgin (IJPB), F-78026 Versailles Cedex, France
First published on 23rd October 2015
Abstract
HPLC-based quantification of 3-HPA using a synthetic acrolein-free 3-HPA standard obtained from commercially available 1,2,4-butanetriol through a straightforward and easy synthetic process has advantages over previous colorimetric methods of easier and safer implementation, and greater specificity. This HPLC method is very simple to implement in a lab, does not need any extra handling of the sample to be analyzed, and is suitable even in the presence of other aldehydes and 3-HPA derivatives, provided that the latter do not have similar retention times.
Introduction
3-Hydroxypropionaldehyde (aka 3-HPA, β-hydroxypropionaldehyde, reuterin) was originally discovered in 1910 by Voisenet.1 Its formation was observed during bacterial spoilage of wine by Bacillus amaracrylus (now classified as Paenibacillus polymyxa). Voisenet assumed that 3-HPA was produced by dehydration of glycerol, which was later confirmed by Abeles.2 3-HPA is a viscous and colorless liquid with a slightly acrid smell. Nowadays, the name reuterin is used as a synonym for 3-HPA. This molecule exhibits powerful antimicrobial activity against many pathogenic microorganisms (Gram-positive and Gram-negative, yeast, protozoa),3 particularly into the gastrointestinal tract.4 Minimal inhibitory (MIC) and minimal bactericidal concentrations (MBC) were determined for several intestinal bacteria, showing that they were very sensitive to this molecule.5 3-HPA therefore participates, at least in part, on the L. reuteri probiotic behavior,6 which was confirmed by randomized, double-blinded, and placebo-controlled clinical studies.7 3-HPA may also cause oxidative stress in cells, by reacting with thiol groups of proteins, enzymes and small molecules. However, the mechanisms responsible for this toxicity have not been identified yet.8 3-HPA finds also use as a food preservative and as a therapeutic auxiliary agent in the pharmaceutical industry.9In addition, 3-HPA is a platform chemical of considerable industrial interest as it can be relatively easily converted into a number of commodity chemicals. It can be dehydrated to acrolein then oxidized to acrylic acid. 3-HPA can also be reduced to 1,3-propanediol (1,3-PDO) through the Degussa and Shell processes,10 or oxidized to 3-hydroxypropionic acid (3-HP) to produce malonic acid. All these molecules are starting materials for polymers and therefore of great interest for the industrial applications. Given the potential of this building block, biotechnological production of 3-HPA from glycerol is therefore being intensively studied11 and commercial production is expected to start in the near future. The biotechnological production of 3-HPA by Lactobacillus reuteri is initiated during the stationary growth phase, in the presence of glycerol as substrate.12
In water, 3-HPA system is made of several monomeric and oligomeric components that exist in a dynamic equilibrium, and depends upon the set conditions (Fig. 1). For example, studies on the structure of 3-HPA showed that 3-HPA in water is part of a concentration- and pH-dependent dynamic system and revealed that at high concentrations (4.9 M), the 3-HPA system was predominantly composed of 3-HPA dimer along with acrolein and unspecified HPA derivatives.10
 | ||
| Fig. 1 3-HPA system: (A) 3-HPA monomer, (B) 3-HPA hydrate (aka 1,1,3-trihydroxypropane, 1,1,3-propanetriol or 1,1,3-PPT), (C) 3-HPA cyclic dimer (2-(2-hydroxyethyl)-4-hydroxy-1,4-dioxane), (D) 3-HPA open dimer, (E) and (F) 3-HPA trimers. | ||
Given the great interest of 3-HPA, analytical methods for quantification of 3-HPA were developed using MIC (Minimum Inhibitory Concentration, calculated from the highest dilution showing a complete inhibition of the tested strain),8 colorimetry and HPLC. Although being one of the most used methods, MIC assay has a major drawback as it only provides relative 3-HPA concentrations expressed in arbitrary units (units 3-HPA mL−1). Indeed, there is a definite advantage for using methods allowing the determination of defined molar 3-HPA concentrations. To access the latters, colorimetric methods can be used.13–15 They all consist in transforming the complex 3-HPA system (monomers and oligomers) into acrolein by dehydrating 3-HPA, thus preventing the formation of the dynamic system. Acrolein is then further converted to UV absorbing compounds allowing its quantification through colorimetry. Though they allow the determination of the total amount of 3-HPA (mol L−1), these methods have two main drawbacks. Not only they require extra handling of the samples and the use of harsh conditions (toxic or harmful reagents), but they also do not distinguish between 3-HPA and eventual other aldehydes – such as acrolein – originally present in the samples, thus leading to inaccurate values. HPLC-based analytical methods were also reported,3 however pure 3-HPA (or 3-HPA system) analytical standards being not readily available from common chemical suppliers, such method requires preparing them before performing the analyses. Up to now, pure 3-HPA aqueous samples were obtained through bioconversion of glycerol using Lactobacillus reuteri,3 followed by purification of the resulting fermentation broth involving semi-preparative HPLC3a or flash chromatography on silica gel10 to remove contaminants (e.g., glycerol, 1,3-PDO, acrolein). Though effective, semi-preparative HPLC and silica gel chromatography provide 3-HPA in small quantity or with relatively low yield (45%), respectively. In view of these considerations, the preparation of pure, acrolein- and water-free 3-HPA standard in high yield through a scalable chemical synthesis under mild conditions appeared as a simpler and faster alternative. The main objectives of the present work were therefore to (i) design a straightforward and efficient chemical synthesis of 3-HPA that could be either easily implemented in an analytical chemistry laboratory, or used by a chemical supplier to produce commercial 3-HPA standards, (ii) fully characterize pure synthetic compound using 13C NMR, HPLC, GC-MS, LC-MS and FT-IR, as well as (iii) use it to develop a reliable quantitative analytical method using HPLC.
Experimental section
Materials and methods
Chemicals (1,2,4-butanetriol, sodium periodate, acrolein (>99.0% analytical standard, 0.2% hydroquinone as stabilizer)) were purchased from Aldrich and used as received. Reagent grade solvents were purchased from ThermoFisher Scientific. Deuterated chloroform (CDCl3) was purchased from Euriso-top.Instrumentation
Evaporations were conducted under reduced pressure at temperature below 25 °C to avoid 3-HPA evaporation. Column chromatography was carried out with an automated flash chromatography system (PuriFlash 4100, Interchim) and pre-packed INTERCHIM PF-30SI-HP columns (30 μm silica gel).IR and UV-Visible analyses were performed on Cary 60 UV-VIS and Cary 630 FT-IR from Agilent technologies, respectively.
HESI-MS analyses were performed on a Q-Exactive (Thermo-Fischer Scientific) at a flow rate of 5 μL min−1 in positive mode. The electrospray voltage was set to 3.70 kV, the S lens RF level was set to 55 V. The sheath auxiliary and sweep gas (nitrogen) flow rates were set to 30, 10 and 0 arbitrary units, respectively. The capillary and heater temperatures were set to 320 and 50 °C, respectively. Mass spectra were recorded from m/z 50 to m/z 300 at a resolution of 70![[thin space (1/6-em)]](https://www.rsc.org/images/entities/char_2009.gif) 000.
000.
GC-MS analyses were performed on a Varian 1200 (quadrupole) equipped with a DB5-MS capillary column 30 × 0.25 mm, 0.25 μm film thickness (J and W scientific), operated in the temperature program (from 40 °C held 1 min to 80 °C at +30 °C min−1, then 80 to 250 °C at +3 °C min−1), with helium as carrier gas (constant flow 1.2 mL min−1), injector at 260 °C operating in splitless mode and a transfer line to MS at 280 °C. The mass spectral analyses were run with a quadrupole in positive mode (electronic impact, 70 eV).
NMR analyses were performed on a Bruker Fourier 300. 1H NMR spectra of samples were recorded in CDCl3 at 300 MHz, chemicals shifts were reported in parts per million relative to the internal standard tetramethylsilane (TMS, δ = 0.00 ppm). 13C NMR spectra of samples were recorded at 75 MHz (CDCl3 residual signal at δ = 77.16 ppm).
HPLC analyses12 were performed on a Biorad column (300 mm × 7.8 mm; Biorad, Richmond, USA) equipped with an Aminex HPX-87H Guard column (30 mm × 4.6 mm; Biorad) at 50 °C eluted with aqueous H2SO4 (0.005 M) at a flow rate of 0.6 mL min−1 (Waters 717 plus autosampler; Waters Associates, Millipore, Molsheim, France). Detection was performed by a refractometer (Waters 2414 refractive index) and a UV spectrophotometer (Waters 2489 UV) at 210 nm. Results were processed by Empower software (Waters Associates).
Procedure for the synthesis of synthetic 3-HPA system
1,2,4-Butanetriol (1.0 g, 9.4 mmol, 1 equiv.) was dissolved in acetone, THF or 1,4-dioxane (190 mL, C = 0.05 M). Water (4.7 mL) and sodium periodate (8.0 g, 37.6 mmol, 4 equiv.) were then added, and the mixture was magnetically stirred at 1100 rpm at room temperature. Reaction was followed by TLC (9/1 ethyl acetate/methanol) until completion. The crude mixture was then filtered on Celite® and the latter washed with 1,4-dioxane. The solvent was removed under reduced pressure, and the crude oil was purified by flash chromatography (100% ethyl acetate) to provide 3-HPA as a colorless viscous oil.Heated electrospray ionization mass spectrometry (HESI-MS) analysis
The characterization of the 3-HPA system was determined by heated electrospray ionization mass spectrometry (HESI-MS). The sample was dissolved in pestipur grade acetonitrile to obtain a solution with a concentration about 10 ng μL−1, then filtered through a 0.22 μm pore-size filter in nylon (Millipore). The sample was infused into the HESI source of the mass spectrometer.Gas chromatography mass spectrometry (GC-MS) analysis
Analyses of the 3-HPA system were performed on a gas chromatograph coupled to an electronic impact mass spectrometer and fitted with a 30 m × 0.25 mm HP5 capillary column (film thickness: 0.25 μm). Extracted sample product was dissolved in pestipur grade dichloromethane to obtain a solution with a concentration of about 1 μg μL−1, then dried over anhydrous sodium sulfate. 5 μL of dried sample solution were silylated in presence of 50 μL of N,O-bis-trimethyl-trifluoroacetamide and 5 μL of pyridine (one night at room temperature) before injection onto the GC-MS system.13C nuclear magnetic resonance (NMR) analysis
20 mg of synthetic 3-HPA system, after purification, was dissolved in CDCl3.High performance liquid chromatography (HPLC) analysis
To obtain calibration curves, synthetic 3-HPA was diluted in water at different concentrations. Samples were filtered through a 0.22 μm pore-size filter in nylon (Millipore). Citric acid was used as internal standard and added at 50% (v/v) to the samples before HPLC analysis (20 μL aliquot was injected).3-HPA system quantification by colorimetric method
The assay for 3-HPA content was based on the colorimetric method of Circle et al. (1945),13 modified by Lüthi-Peng et al. (2002).14 To obtain standard curves, 5.6–280 mg L−1 of acrolein (>99.0% analytical standard, 0.2% hydroquinone as stabilizer, Sigma-Aldrich) in water and 3.9–780 mg L−1 of freshly diluted 3-HPA system in water were supplemented with 0.75 mL of DL-tryptophan (Sigma-Aldrich) solution (0.01 M solution in 0.05 M HCl) and 3.0 mL of 37% HCl were added immediately. For 3-HPA quantification, a 1 mL sample was mixed with 0.75 mL of DL-tryptophan (Sigma-Aldrich) solution and 3 mL of HCl 37%. Mixtures containing samples and standards were incubated for 20 min at 37 °C and the optical density was measured at 560 nm (OD560). If necessary, samples were diluted with the same medium to ensure an OD560 < 1.8.Results and discussion
Production and purification of synthetic 3-HPA
The most commonly used chemical method for producing 3-HPA is the catalytic hydration of acrolein under strong acidic conditions.16 However, it results in modest yields with many contaminants. Herein, we report the one-step synthesis and study of 3-HPA from commercially available biobased 1,2,4-butanetriol. This precursor is chemically produced via hydrogenation of malate17 or can be synthesized by bioconversion18 starting from xylose (E. coli) or arabinose (Pseudomonas fragi). These microbial syntheses relied on the creation of biosynthetic pathways that do not exist in nature. The aim of this study was to convert 1,2,4-butanetriol to 3-HPA by oxidative cleavage of the 1,2-diol in presence of sodium periodate (Fig. 2). The reaction was carried out at room temperature and did not need the use of an inert atmosphere. Different solvents were tested in order to evaluate their impact on reaction time (determined by TLC) and final yield (Table 1). To limit formation of oligomers, reaction media was very dilute (C = 0.05 M). Solubility of sodium periodate proved to be a critical factor for the kinetic of oxidation. The more soluble sodium periodate is, the faster the reaction (i.e., 2.5, 4 and 6 h for THF, acetone and 1,4-dioxane, respectively) (Table 1). Event though it required longer reaction time, 1,4-dioxane was the solvent of choice as large amount of salts were still present for reaction performed in acetone and THF, despite many filtration/evaporation cycles. It is noteworthy to mention that, due to its low molecular weight, 3-HPA is easily evaporated during sample concentration. To prevent this phenomenon, the water bath of rotavapor needs to be maintained at 25 °C (or below). | ||
| Fig. 2 Oxidative cleavage of 1,2,4-butanetriol into 3-hydroxypropionaldehyde. | ||
| Solvent | Reaction time (h) | Yield (%) |
|---|---|---|
| Acetone | 4 | 30 |
| THF | 2.5 | 28 |
| 1,4-Dioxane | 6 | 70 |
Crude 3-PA was then purified by flash chromatography on silica gel. Ethyl acetate was used as eluent because of its high polarity, low toxicity, and its inactivity towards aldehydes. Isolated spot of 3-HPA (Rf = 0.58 with 9/1 ethyl acetate/methanol) was actually composed of monomeric, dimeric and few trimeric forms, as identified by NMR spectroscopy and GC-MS.
To summarize, these quick and simple synthetic and purification procedures allowed 3-HPA to be obtained in very good yield (70%) through a one-step synthetic pathway without any temperature or atmosphere regulation. This method can be easily scaled-up if larger amounts of 3-HPA are needed. It is also noteworthy to mention that, sealed under nitrogen and stored in a freezer (4 °C), this synthetic 3-HPA can be used over a long period of time (ca. 6 months). In addition, in water for concentrations between 0.5 and 10 g L−1 and without citric acid, no change in signal area and calibration curve coefficients has been observed for both IR and UV detections over several weeks, demonstrating that no deterioration of synthetic 3-HPA system was observed for several weeks.
Synthetic 3-HPA system characterization by HESI-MS
Analysis of 10 ng μL−1 3-HPA solution in acetonitrile with HESI-MS (Fig. 3) showed signals for compounds with a m/z of n × 74 (n integer: 1, 2 or 3) corresponding to 3-HPA monomers, dimers, trimers, as well as signals for their Na+ and K+ adducts. It is noteworthy that 3-HPA hydrate could not be detected with this method. Table 2 gives the mass to charge (m/z) ratio of the components of the 3-HPA system. Under these conditions, the 3-HPA dimer was the most ionized form of 3-HPA as shown by peaks with the highest intensity with m/z of 171 corresponding to the sodium adduct of 3-HPA dimer ([C6H12O4Na]+). Smaller amounts of monomeric 3-HPA (m/z 74 + 23 = 97 and m/z 74 + 39 = 113), 3-HPA trimer (m/z 222 + 23 = 245) were also found in the mixture and observed in the spectrum. Conversely, acrolein (M = 56 g mol−1, m/z 56 + 23 = 79) was not detected in the synthesized 3-HPA system. | ||
| Fig. 3 HESI-MS spectrum of purified 3-HPA (100 ng μL−1) in acetonitrile. m/z values of 23, 39, 55, 71, 87, 119, and 141 correspond to 3-HPA and its derivatives and their Na+, K+, CH3CN + Na+, and CH3CN + K+ adducts. A detailed description of the m/z values is given in Table 2. | ||
| 3-HPA | 3-HPA dimer (C) | 3-HPA trimer (E) | 3-HPA trimer (F) |
|---|---|---|---|
| 74 [C3H6O2] | 148 [C6H12O4] | 204 [C12H24O8] | 222 [C9H18O6] |
| 97 [+Na]+ | 171 [+Na]+ | 227 [+Na]+ | 245 [+Na]+ |
| 113 [+K]+ | 187 [+K]+ | 243 [+K]+ | 261 [+K]+ |
| 138 [+CH3CN + Na]+ | 212 [+CH3CN + Na]+ | 268 [+CH3CN + Na]+ | 286 [+CH3CN + Na]+ |
| 154 [+CH3CN + Na]+ | 228 [+CH3CN + K]+ | 284 [+CH3CN + K]+ | 302 [+CH3CN + K]+ |
Synthetic 3-HPA system characterization by GC-MS
In the total ion current (Fig. 4), several forms of 3-HPA (monomeric 3-HPA at 6.1 min, 3-HPA dimers between 18.9 and 20.3 min, 3-HPA trimers between 25.8 and 26.2 min and 3-HPA tetramers at 38.3 min) can be observed. Under these conditions, the 3-HPA dimers were the most abundant. The spectra corresponding to the different species are shown in the additional data. Results thus confirm that dimers are the major components of the 3-HPA system.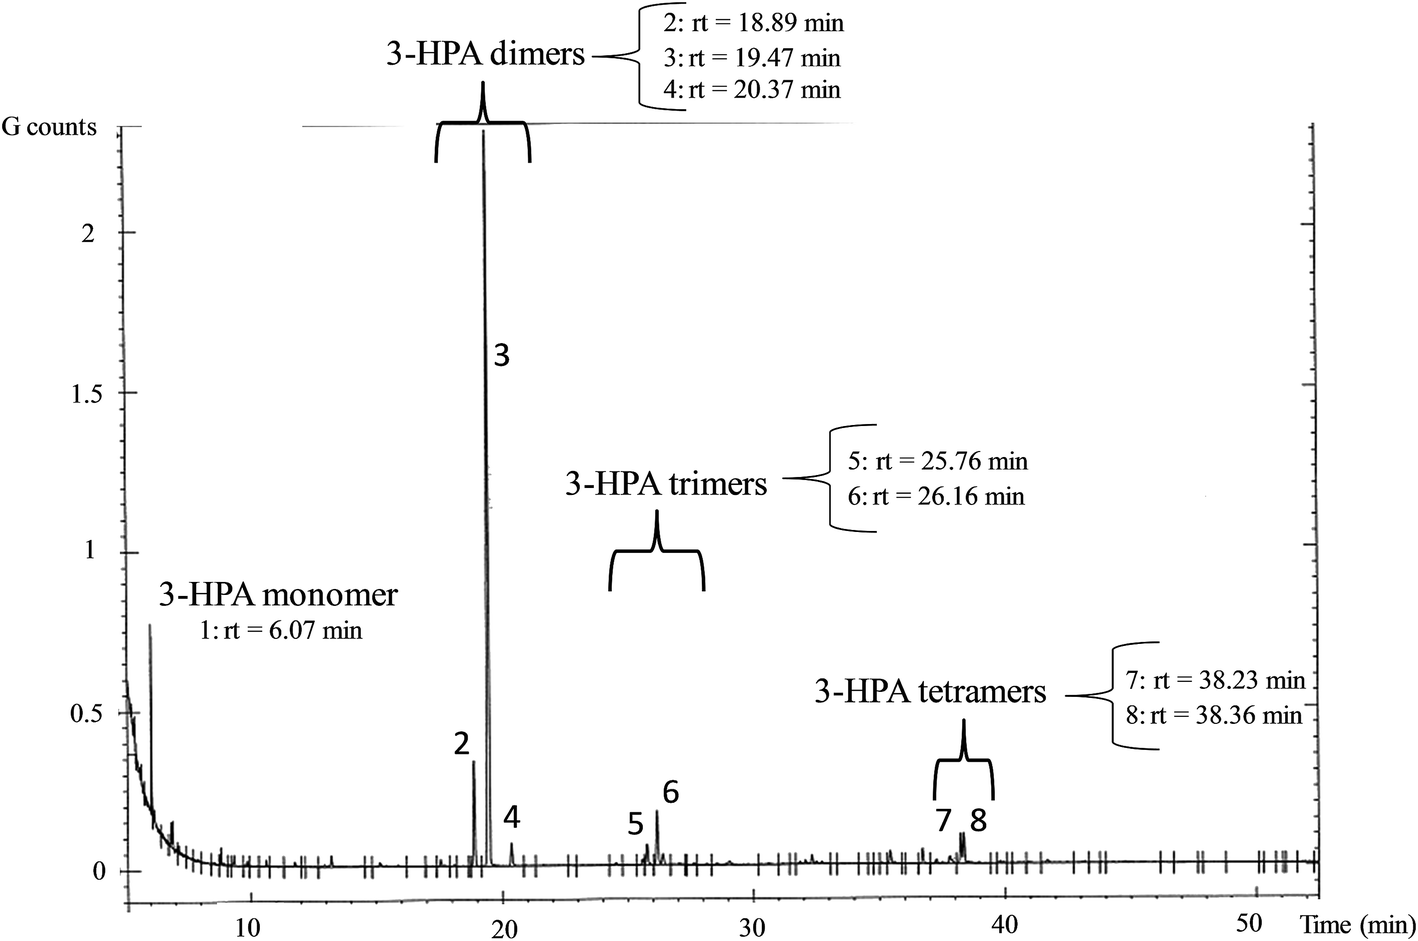 | ||
| Fig. 4 GC-MS chromatogram of 3-HPA system. Identification of each peak has been made thanks to the mass spectrum of each trimethylsilyl derivative (see ESI†). The peaks with retention times around 6, 20, 25 and 38 minutes correspond to 3-HPA monomer, 3-HPA dimers, 3-HPA trimers and 3-HPA tetramers, respectively. | ||
3-HPA system characterization by FT-IR
In infrared spectra (Fig. 5), in addition to the aldehyde band (1714 cm−1), bands in the ether area confirmed a dynamic system rather than pure 3-HPA as these bands correspond to the acetals and hemiacetals belonging to dimeric and trimeric forms (Fig. 5). Furthermore, no alkene band (around 1650 cm−1) has been detected, confirming the absence of acrolein (Table 3). | ||
| Fig. 5 FT-IR analysis of 3-HPA system after purification by flash chromatography on silica gel. The sample purity was tested by HESI-MS and GC-MS analyses before FT-IR analysis. The transmittance of the major functional groups of 3-HPA system are noted. | ||
| Wavelength (cm−1) | Groups | Bonding | Vibration type |
|---|---|---|---|
| 3355.5 | Alcohol | Hydrogen bonded OH | Stretch |
| 2962.9–2878.6 | Alkanes | CH2 | Stretch |
| 1714.5 | Aldehyde | C![[double bond, length as m-dash]](https://www.rsc.org/images/entities/char_e001.gif) O O |
Stretch |
| 1247.7–1368.7–1424.3 | Alcohol | O–H | Bend |
| 947.8–1031.8–1118.9 | Ether (hemiacetal and acetal) | C–O | Stretch |
Synthetic 3-HPA system characterization by 1H & 13C NMR
It is noteworthy to mention that the chemical shifts obtained here are in accordance with those reported by Kächele et al.20 (1H NMR in D2O at 400 MHz: 2.78, 3.96 and 9.74 respectively).
13C NMR (ppm, CDCl3, 75 MHz) δ = 46.1 (t, C2), 56.6 (t, C3), 202.4 (d, C1).
![[C with combining low line]](https://www.rsc.org/images/entities/b_char_0043_0332.gif) H2–OH; between 29 and 37 ppm: HO–CH2–H2–C.
H2–OH; between 29 and 37 ppm: HO–CH2–H2–C.In the acetal and hemiacetal areas (88–100 ppm, Fig. 6), various signals can be distinguished. They correspond to 1,1,3-PPT (B), the two diastereomers of the cyclic dimer (C), the opened dimer (D) and the trimers (E) and (F) (Fig. 1).
 | ||
| Fig. 6 13C NMR spectrum of pure synthetic 3-HPA system in CDCl3. | ||
In addition, the major signal in the aldehyde area (see 1H NMR in ESI†) corresponds to monomeric 3-HPA as proved by the correlations in 2D NMR spectra (see ESI†). In accordance with the literature,14,19 the four most intense signals observed in the acetal area (89.1, 92.7, 95.1 and 99.2 ppm) belong to the two diastereomers of cyclic dimer (C), demonstrating that cyclic dimer (C) is the most abundant form in our conditions. The other signals probably belong to 1,1,3-PPT (B), the open dimer (D) and trimers (E) and (F). No signal corresponding to the double bond of acrolein (around 140 ppm) was detected. This irrefutably demonstrates that no dehydration of 3-HPA into acrolein occurs during this chemical synthesis.
Synthetic 3-HPA system characterization by HPLC and its use as analytical standard for the quantification of 3-HPA in fermentation broth using HPLC
As the efficient separation and analysis of glucose, glycerol, formate, lactate, ethanol, 1,3-PDO, 3-HP and 3-HPA by HPLC using RI detection was already reported in the literature,12 the conditions published were used to assess the suitability of the synthetic 3-HPA system as analytical standard. Under these conditions, retention times of 3-HPA system and citric acid (internal standard) were: citric acid (8.01 and 8.38 min by UV and RI detectors, respectively), 3-HPA system (15.03 and 15.07 min with UV and RI detectors, respectively).On the RI chromatogram (Fig. 7 Top), only one peak (retention time = 15.07 min) was obtained. On the contrary, on the UV chromatogram (Fig. 7 Bottom), at least two peaks were obtained (retention times = 15.03 and 27.34 min), indicating that at least two forms of 3-HPA were detected. The unexpected asymmetric shape of the peak is probably due to the dynamic equilibrium between the different forms of 3-HPA system. Unfortunately, despite many attempts (modification of column temperature and/or mobile phase flow), we were not able to improve further the resolution of the peaks in UV detection.
 | ||
| Fig. 7 Analysis of 3-HPA by HPLC (distilled water supplemented with 4 g L−1 of synthetic 3-HPA system). Chromatogram obtained by (Top) Refractive Index detection and (Bottom) UV detection at 210 nm. Citric acid solution (C = 5 mM) was used as internal standard and added at 50% (v/v) to the sample before HPLC analysis. | ||
The linearity of the method was assessed by analytical curves of 3-HPA system with citric acid as internal standard for both detections (RI and UV). The calibration curves obtained showed linear regression with R2 coefficients >0.999 in the concentration range tested (Fig. 8). Repeatability was evaluated by measuring intra-day and inter-day variations of one sample 5 times in one day and in triplicate for three consecutive days. The overall intra- and inter-day relative standard deviations were less than 1.3% and 1.8%, respectively. This analytical method is therefore appropriate for the detection and quantification of 3-HPA system.
 | ||
| Fig. 8 Quantification using HPLC of synthetic 3-HPA system by (Top) UV detection at 210 nm and (Bottom) Refractive Index detection. | ||
To demonstrate that synthetic 3-HPA system can be used as analytical standard to quantify efficiently and effectively 3-HPA using HPLC, we realized the following experiments (Fig. 9). Using Lüthi-Peng's method,14 a calibration curve of the optical density at 560 nm (OD(560 nm)) for different concentrations of the synthetic 3-HPA system in water (mg L−1) was obtained and provided the following equation:
| OD(560 nm) = 0.0029 [3-HPA system] + 0.6712 | (1) |
 | ||
| Fig. 9 Calibration curves obtained for (Top) aqueous acrolein solutions and (Bottom) aqueous synthetic 3-HPA system, using Lüthi-Peng's method. | ||
The same methodology was then applied on aqueous acrolein solutions (mmol L−1) at different concentrations and gave the following equation:
| OD(560 nm) = 0.1434 [acrolein] + 0.6674 | (2) |
Using the two equations above, the concentration of the 3-HPA system ([3-HPA system] in mg L−1) can now be correlated to the actual quantity of 3-HPA in the synthetic 3-HPA system ([3-HPA] in mmol L−1) knowing that [acrolein] = [3-HPA] and with the approximation that the two curves have the same intercept:
| [3-HPA] = (0.0029/0.1434) [3-HPA system] | (3) |
| [3-HPA] = 0.0202 [3-HPA system] | (4) |
| [3-HPA] = [3-HPA system]/49.4483 | (5) |
It is noteworthy to mention that 49.4483 g mol−1 is lower than the molecular weight of monomeric 3-HPA (i.e., 74.0790 g mol−1) which is consistent with the fact 3-HPA is in the form of a mixture of oligomers.
Using eqn (5) and the above calibration curves (Fig. 8 and 9), two different fermentation broths containing 3-HPA have been analyzed using both methods (i.e., HPLC and Lüthi-Peng's). Results are reported in Table 4.
| Sample | [3-HPA]a using HPLC | [3-HPA]a using colorimetry | Difference (%) | ||||
|---|---|---|---|---|---|---|---|
| UV | RI | ||||||
| mmol L−1 | g L−1 | mmol L−1 | g L−1 | mmol L−1 | g L−1 | ||
| a [3-HPA] in g L−1 is obtained by multiplying [3-HPA] in mol L−1 by 74.08 g mol−1 (M(3-HPA)). | |||||||
| Broth 1 | 165.42 | 12.25 | 161.98 | 12.00 | 169.06 | 12.52 | 4.2% (RI) − 2.2% (UV) |
| Broth 2 | 191.48 | 14.18 | 172.50 | 12.78 | 175.73 | 13.02 | 1.8% (RI) − 9.0% (UV) |
In summary, even though synthetic 3-HPA system is a complex mixture, it can be used as analytical standard to reliably quantify 3-HPA using HPLC. However, because of the less resolved peak in UV detection, more reliable data are obtained with RI detection. This HPLC method based on the use of synthetic 3-HPA has been recently applied to monitor 3-HPA in a study dedicated to the production capabilities of diverse Lactobacillus reuteri strains.21
Conclusion
Herein, we propose an efficient and straightforward procedure to synthesize and purify an acrolein- and water-free 3-HPA system in high yield and in only one-step from commercially available 1,2,4-butanetriol under mild conditions (e.g., room temperature, atmospheric pressure). NMR, HPLC and IR analyses confirmed that acrolein was not produced during the course of the chemical reaction. Analyses also indicated that the dimeric form (C) was predominant in the 3-HPA system among several multimeric forms which is consistent given that the composition of the 3-HPA systems is concentration dependent.This pure synthetic 3-HPA system was then successfully used as analytical standard and allowed a reliable quantitative analysis of 3-HPA using HPLC. Unlike the HPLC and colorimetric methods used so far to quantify 3-HPA, this HPLC method based on synthetic 3-HPA is very simple to implement in a lab, does not need any extra handling of the sample to be analyzed, and is suitable even in the presence of other aldehydes and 3-HPA derivatives, provided that the latters do not have similar retention times.
Author contributions
The manuscript was written through contributions of all named authors. All authors have given approval to the final version of the manuscript.Conflict of interest
The authors declare no competing financial interest.Acknowledgements
The authors are grateful to the Region Champagne-Ardenne, the Conseil Général de la Marne and Reims Métropole for their financial support.References
- M. E. Voisenet, C. R. Acad. Sci., Ser. Gen. Vie Sci., 1910, 150, 1614–1616 Search PubMed.
- R. H. Abeles, A. M. Brownstein and C. H. Randles, Biochim. Biophys. Acta, 1960, 41, 530–531 CrossRef CAS.
- (a) T. L. Talarico, I. A. Casas, T. C. Chung and W. J. Dobrogosz, Antimicrob. Agents Chemother., 1988, 32, 1854–1858 CrossRef CAS PubMed; (b) J. K. Spinler, M. Taweechotipatr, C. L. Rognerud, C. N. Ou, S. Tumwasorn and J. Versalovic, Anaerobe, 2008, 14, 166–171 CrossRef CAS PubMed.
- W. J. Dobrogosz, I. A. Casas, G. A. Pagano, B. M. Sjöberg, T. L. Talarico and M. Karlsson, Lactobacillus reuteri and the enteric microbiota in the regulatory and protective role of the normal microflora, ed. R. Grubb, T. Midtvedt and E. Norin, Macmillan Press Ltd., London, 1989 Search PubMed.
- V. Cleusix, C. Lacroix, S. Vollenweider, M. Duboux and G. Le Blay, BMC Microbiol., 2007, 7, 101 CrossRef PubMed.
- I. A. Casas and W. J. Dobrogosz, Microb. Ecol. Health Dis., 2000, 12, 247–285 Search PubMed.
- N. Valeur, P. Engel, N. Carbajal, E. Connolly and K. Ladefoged, Appl. Environ. Microbiol., 2004, 70, 1176–1181 CrossRef CAS.
- L. Schaefer, T. A. Auchtung, K. E. Hermans, D. Whitehead, B. Borhan and R. A. Britton, Microbiology, 2010, 156, 1589–1599 CrossRef CAS PubMed.
- H. W. Sung, C. N. Chen, H. F. Liang and M. H. Hong, Biomaterials, 2003, 24, 1335–1347 CrossRef CAS.
- S. Vollenweider, G. Grassi, I. König and Z. Puhan, J. Agric. Food Chem., 2003, 51, 3287–3293 CrossRef CAS PubMed.
- (a) Q. Lüthi-Peng, F. B. Dileme and Z. Puhan, Appl. Microbiol. Biotechnol., 2002, 59, 289–296 CrossRef PubMed; (b) Q. Lüthi-Peng, S. Schärer and Z. Puhan, Appl. Microbiol. Biotechnol., 2002, 60, 73–80 CrossRef PubMed; (c) C. Ulmer and A. P. Zeng, Chem. Biochem. Eng. Q., 2007, 21, 321–326 CAS; (d) H. Krauter and K. D. Willke Vorlop, New Biotechnol., 2012, 29, 211–217 CrossRef CAS PubMed.
- M. G. El-Ziney, N. Arneborg, M. Uyttendaele, J. Debevere and M. Jakobsen, Biotechnol. Lett., 1998, 20, 913–916 CrossRef CAS.
- S. J. Circle, L. Stone and C. S. Boruff, Ind. Eng. Chem., 1945, 17, 259–262 CAS.
- Q. Lüthi-Peng, S. Schärer and Z. Puhan, Appl. Microbiol. Biotechnol., 2002, 60, 73–80 CrossRef PubMed.
- S. Vollenweider, S. Evers, K. Zubriggen and C. Lacroix, J. Agric. Food Chem., 2010, 58, 10315–10322 CrossRef CAS PubMed.
- R. H. Hall and E. S. Stern, J. Am. Chem. Soc., 1950, 490–498 RSC.
- K. N. G. Valdehuesa, H. Liu, G. M. Nisola, W. J. Chung, S. H. Lee and S. J. Park, Appl. Microbiol. Biotechnol., 2013, 97, 3309–3321 CrossRef CAS PubMed.
- W. Niu, M. N. Molefe and J. W. Frost, J. Am. Chem. Soc., 2003, 125, 12998–12999 CrossRef CAS PubMed.
- A. T. Nielsen, D. W. Moore and A. Schuetze Jr, Pol. J. Chem., 1981, 55, 1393–1403 CAS.
- M. Kächele, Y. B. Monakhova, T. Kuballa and D. W. Lachenmeier, Anal. Chim. Acta, 2014, 820, 112–118 CrossRef PubMed.
- G. Burgé, C. Saulou-Bérion, M. Moussa, B. Pollet, A. L. Flourat, F. Allais, V. Athès and H. E. Spinnler, Appl. Biochem. Biotechnol., 2015, 177, 923–939 CrossRef PubMed.
Footnotes |
| † Electronic supplementary information (ESI) available. See DOI: 10.1039/c5ra18274c |
| ‡ These authors contributed equally to this work. |
| This journal is © The Royal Society of Chemistry 2015 |