DOI:
10.1039/C5RA17962A
(Paper)
RSC Adv., 2015,
5, 91863-91868
BODIPY-based colorimetric/ratiometric fluorescence probes for sulfite in aqueous solution and in living cells†
Received
4th September 2015
, Accepted 16th October 2015
First published on 22nd October 2015
Abstract
Two colorimetric/ratiometric fluorescence probes (BSP1 and BSP2) for sulfite utilizing the Michael-addition mechanism were designed and synthesized by incorporating a substituted pyridinium/methyl pyridinium to a BODIPY fluorophore linked with an α,β-unsaturated ketone. BSP1 exhibited colorimetric and ratiometric fluorescence responses toward sulfite in PBS-CTAB system. The addition of sulfite to the C![[double bond, length as m-dash]](https://www.rsc.org/images/entities/char_e001.gif) C group in BSP1 induced about 60 nm hypsochromic shift in both absorption (from 554 nm to 494 nm) and emission (from 618 nm to 554 nm) spectra accompanied with fluorescent color change from red to green under hand-lamp excited at 365 nm. Good linear relationship was found between the emission ratio (I554/I618) and the concentration of sulfite in the range of 0–300 μM with a detection limit of 6.4 μM. In the case of BSP2, the probe showed excellent water solubility and faster spectral response to sulfite with about 100 nm blue shift (from 567 nm to 470 nm) in the absorption spectrum in PBS. The solution's color changed from purple to yellow. Both BSP1 and BSP2 displayed high selectivity and competition towards sulfite over other relative species such as thiols and sulfide. More importantly, we have demonstrated that BSP1 could be applied in the imaging of sulfite in living cells.
C group in BSP1 induced about 60 nm hypsochromic shift in both absorption (from 554 nm to 494 nm) and emission (from 618 nm to 554 nm) spectra accompanied with fluorescent color change from red to green under hand-lamp excited at 365 nm. Good linear relationship was found between the emission ratio (I554/I618) and the concentration of sulfite in the range of 0–300 μM with a detection limit of 6.4 μM. In the case of BSP2, the probe showed excellent water solubility and faster spectral response to sulfite with about 100 nm blue shift (from 567 nm to 470 nm) in the absorption spectrum in PBS. The solution's color changed from purple to yellow. Both BSP1 and BSP2 displayed high selectivity and competition towards sulfite over other relative species such as thiols and sulfide. More importantly, we have demonstrated that BSP1 could be applied in the imaging of sulfite in living cells.
Introduction
Sulphur dioxide (SO2) is considered as one of the main environmental pollutants, and is produced by the extensive combustion of fossil fuels and volcanic activity.1,2 Epidemiological studies have verified that long term exposure to SO2 could cause many respiratory responses, or even several health concerns: difficulty in breathing, gastrointestinal distress and wheezing.3,4 Usually, SO2 exists in the two forms of sulfite and bisulfite in physiological systems.5 Sulfites can inhibit the growth of bacteria and oxidation in a variety of processing and storage situations and they have been widely used as preservatives for foods and beverages to maintain freshness.6–9 Given the potential health concerns, the Joint FAO/WHO Expert Committee on food additives has regulated that an acceptable daily intake of sulfite is supposed to be lower than 0.7 mg kg−1 of body weight.10 Therefore, to develop efficient methods for quantification of sulfite in foods and environment with extraordinary selectivity and sensitivity is desired. So far, some conventional methods such as the official Monier-Williams method,9 electrochemistry,8–11 chromatography12,13 have been developed for detection of sulfite in food and beverages. However, most of them are unsuitable for routine analysis because they require tedious sample pretreatment or complicated instruments. Fluorescence technique has attracted considerable attention in determining anions, cations and biological molecules due to its simplicity, high sensitivity and selectivity, real-time detection as well as the potential application in living cell-imaging.14
Several fluorescent probes for sulfites have been reported based on the selective deprotection of a levulinate group,15–17 Michael additions,18–21 selective reaction with aldehyde,22–26 and forming complexes with amines.27,28 Most of these probes respond to sulfites with changes only in fluorescent intensities, which may limit their application in quantitative measurements because signal variation from the environment and probe concentration may interfere with the detection.29–31 Additionally, some of the fluorescent probes emit at short wavelength region (less than 550 nm), which is unfavorable for detecting sulfite in realistic samples. Ratiometric fluorescent probes with relatively long wavelengths of the absorption/emission maxima are desired for the identification of sulfite in food and beverages.
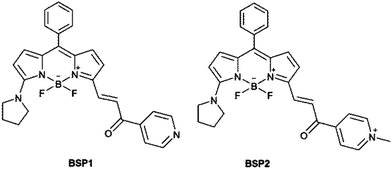
Herein, we present two colorimetric/ratiometric fluorescence probes for sulfite in aqueous solution. Both probes were designed with boron dipyrromethene (BODIPY) as the fluorophore due to its outstanding spectral properties of high fluorescence quantum yields, large extinction coefficients and ease of modification to give probes with emission maxima range from 550 nm to 750 nm.32–34 An α,β-unsaturated ketone unit was employed as the recognition group for sulfite.20,21,35 Pyridinium and methyl pyridinium groups were introduced to the probe molecules to adjust the reactivity and the solubility of the probes (Scheme 1). The Micheal-addition of sulfite to the α,β-unsaturated ketone will shorten the conjugation system of the probe and lead to evidently blue shifts in both absorption and emission maxima. Compared to BPS1, the electron density of the CC in BSP2 is lower because of the electron-receipting property of the quaternary ammonium salt, which benefits the Micheal addition. Therefore, the sensing of sulfite with BSP2 is expected to be faster.
 |
| | Scheme 1 The chemical structures of the probes. | |
Experimental
Synthesis
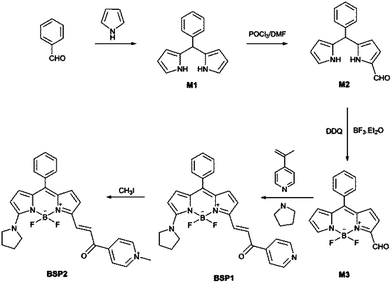
Probes BSP1 and BSP2 were synthesized according to the following procedures (Scheme 2).
 |
| | Scheme 2 The synthetic procedures of BSP1 and BSP2. | |
Synthesis of M1.
1.0 g benzaldehyde (9.43 mmol), 1.9 g pyrrole (28.29 mmol) and 7 drops of hydrochloric acid were added into 250 mL water. The reaction mixture was stirred at room temperature and the reaction progress was monitored by TLC. After benzaldehyde disappeared, the solid product was filtered off and washed with water and petroleum ether and then dried over anhydrous MgSO4 to afford the crude product, which was purified by column chromatography on the silica gel [petroleum![[thin space (1/6-em)]](https://www.rsc.org/images/entities/char_2009.gif) :dichloromethane = 1:1] to obtain M1 as a faint yellow solid (1.79 g, 86%). 1H-NMR (400 MHz, DMSO-d6), δ (ppm): 10.51 (s, 2H), 7.23–7.08 (m, 5H), 6.54 (s, 2H), 5.83 (d, J = 2.15 Hz, 2H), 5.59 (s, 2H), 5.28 (s, 1H).
:dichloromethane = 1:1] to obtain M1 as a faint yellow solid (1.79 g, 86%). 1H-NMR (400 MHz, DMSO-d6), δ (ppm): 10.51 (s, 2H), 7.23–7.08 (m, 5H), 6.54 (s, 2H), 5.83 (d, J = 2.15 Hz, 2H), 5.59 (s, 2H), 5.28 (s, 1H).
Synthesis of M2.
POCl3 (0.5 mL) was added dropwise to freshly distilled DMF (3.7 mL). The solution was stirred for 30 min at 0–5 °C under N2 atmosphere. Then 35 mL of dichloromethane containing M1 (2 g, 4.51 mmol) was added to the above solution. The mixed solution was stirred for 3 h. Then the solution's pH was adjusted to ∼9.0 with 20% NaOH solution. The product was extracted with CH2Cl2, and the organic layer was washed with brine and dried over anhydrous MgSO4. Then the obtained organic phase was concentrated under vacuum pump and purified by column chromatography [petroleum:ethyl acetate = 50:10] to give M2 as pink solid (400 mg, 17.8%). 1H-NMR (400 MHz, CDCl3), δ (ppm): 9.49 (s, 1H), 9.32 (s, 1H), 8.18 (s, 1H), 7.34–7.17 (m, 5H), 6.90 (s, 1H), 6.72 (s, 1H), 6.16 (s, 1H), 6.10 (s, 1H), 5.97 (s, 1H), 5.52 (s, 1H).
Synthesis of M3.
DDQ (400 mg, 1.76 mmol) was added slowly to a round-bottomed flask containing M2 (400 mg, 1.6 mmol) in CH2Cl2 (50 mL) under ice bath. The solution was stirred at room temperature for 20 min. Then triethylamine (1.6 mL) and BF3·Et2O (1.6 mL) were added into the flask. The solution was stirred at room temperature for another 15 min and then extracted with CH2Cl2 (3 × 100 mL). The organic phase was combined, washed with brine (3 × 100 mL) and dried with anhydrous MgSO4. The solvent was removed under reduced pressure to give the crude product, which was purified by column chromatography on the silica gel [petroleum:ethyl acetate = 50:35] to afford M3 as reddish powders (60 mg, 12.7%). 1H-NMR (500 MHz, CDCl3), δ (ppm): 10.38 (s, 1H), 8.23 (s, 1H), 7.66–7.62 (m, 5H), 7.16 (d, J = 4.36, 1H), 7.10 (d, J = 4.19, 1H), 6.86 (d, J = 4.17, 1H), 6.74 (d, J = 4.34, 1H). 13C NMR (400 MHz, CDCl3), δ (ppm): 184.37, 150.09, 149.19, 147.70, 137.05, 136.69, 135.26, 133.2, 131.49, 130.64, 128.75, 121.89, 121.86, 118.28. MS-ESI m/z: 319.1 (M + Na)+; calculated molecular weight of C16H12BF2N2NaO+: 319.1 for (M + Na)+.
Synthesis of BSP1.
8 drops of pyrrolidine were added to 60 mL of EtOH:CH2Cl2 = 1:2 (v/v) containing M3 (100 mg, 0.34 mmol) and 4-acetylpyridine (73.64 g, 0.61 mmol). The solution was stirred at room temperature for 2 h. The solvent was removed under reduced pressure, and the solid was purified by column chromatography on the silica gel [CH2Cl2:MeOH = 50:1] to give BSP1 as reddish powders (60 mg, 46.4%). 1H-NMR (400 MHz, DMSO-d6), δ (ppm): 8.83 (d, J = 4.61 Hz, 2H), 8.20 (d, J = 15.24 Hz, 1H), 8.0 (d, J = 4.76 Hz, 2H), 7.72 (d, J = 15.29 Hz, 1H), 7.55–7.49 (m, 5H), 7.38 (d, J = 3.43 Hz, 1H), 7.00 (d, J = 5.05 Hz, 1H), 6.79 (d, J = 5.03 Hz, 1H), 6.29 (d, J = 3.42 Hz, 1H), 4.12 (s, 2H), 3.89 (s, 2H), 2.05 (s, 4H). 13C-NMR (400 MHz, DMSO-d6), δ (ppm): 188.9, 161.8, 151.7, 145.3, 139.2, 138.0, 137.2, 137.1, 136.1, 135.1, 131.4, 130.1, 129.6, 126.9, 122.5, 120.7, 119.2, 118.1, 117.9, 54.42, 51.65, 26.85, 25.31. MS-ESI m/z: 491.2 (M + Na)+; calculated molecular weight of C27H23BF2N4NaO+: 491.2 for (M + Na)+.
Synthesis of BSP2.
In a 50 mL round-bottom flask, BSP1 (100 mg, 0.25 mmol) and an excess amount of iodomethane were dissolved in acetonitrile (25 mL). The resulting mixture was stirred in dark at room temperature for 10 d. The solvent was removed under reduced pressure, and the solid was purified by column chromatography on the silica gel [CH2Cl2:MeOH = 50:10] to give BSP2 as purple solid (50 mg, 48.2%). 1H-NMR (CD3OD, 400 MHz), δ (ppm): 9.07 (d, J = 6.59, 2H), 8.56 (d, J = 6.67, 2H), 8.45 (d, J = 15.15, 1H), 7.58 (d, J = 15.12, 1H), 7.53–7.49 (m, 6H), 7.28 (d, J = 4.12, 1H), 6.98 (d, J = 5.33, 1H), 6.69 (d, J = 5.34, 1H), 6.31 (d, J = 4.09, 1H), 4.47 (s, 3H), 4.26 (s, 2H), 3.89 (s, 2H), 2.14 (s, 4H). 13C-NMR (400 MHz, CD3OD) δ (ppm): 184.8, 162.0, 152.3, 147.1, 140.1, 138.9, 135.8, 135.0, 130.8, 130.3, 129.4, 128.8, 127.9, 126.9, 126.3, 125.5, 119.5, 118.2, 117.8, 116.3, 78.78, 78.52, 78.26, 17.05. HR-MS m/z: 483.2165 (M − I)+; calculated molecular weight of C28H26BF2N4O+: 483.2168 for (M − I)+.
Result and discussion
Colorimetric and fluorescent dual-responses of BSP1 toward sulfite
With probes BSP1 and BSP2 in hand, we first evaluated the photophysical properties of BSP1 in different media. BSP1 is non-fluorescent and has two absorption peaks at 542 nm and 589 nm in PBS (20 mM, pH 7.4, Fig. S5a†). The curve of absorbance at 542 nm vs.BSP1 concentration indicates that the solubility of BSP1 in PBS is less than 2 μM (Fig. S6†), which is far below the concentration for detection. However, BSP1 is more fluorescent and soluble in organic solvent (Fig. S5b†). Therefore, the spectral responses of BSP1 toward sulfite were conducted in PBS containing 1 mM CTAB to enhance the solubility of the probe. To our excitement that BSP1 displays intensive fluorescence at 618 nm and an absorption peak at 554 nm in PBS containing 1 mM CTAB (Fig. S5†), which suggests that BSP1 molecules exist in non-polar CTAB micelles.
Fig. S7† is the plot of emission intensity vs. the absorbance of BSP1. Good linear relationship between I618 and A554 is found at the absorbance below 0.25 ([BSP1] = 10 μM), which indicates that the inner filter effect could be ignored under the condition of [BSP1] ≤ 10 μM. Therefore, 10 μM BSP1 was used in the following experiments. The presence of 50 equiv. of sulfite made the absorption peak at 554 nm decrease; while a new peak at 494 nm appeared and developed. A well-defined isosbestic point at 512 nm suggests the clean formation of a new compound upon treatment of the probe with sulfite (Fig. 1a). At the same time, the solution's color changes from red to yellow. Ratiometric fluorescence response of BSP1 toward sulfite was found as well (Fig. 1b). It is seen that the emission band occurs 64 nm blue-shifts (from 618 nm to 554 nm) with an isoemissive point at 602 nm, accompanied by a color change from red to green under an ultraviolet lamp (365 nm). Time-course absorption and emission spectra of BSP1-sulfite were shown in Fig. S8,† from which it was clear that the absorbance at 494 nm and the fluorescence intensity at 554 nm hardly changed after 2 hours. Therefore, the assay time of 2 h was selected in the following studies with BSP1 as the probe. Next, we investigated pH effect on the emission spectra of BSP1 and its addition product of sulfite to obtain the optimal detection pH. Fig. S9† demonstrated that both I618 of BSP1 and I554/I618 of the product almost kept constant in the pH range of 7.0–8.0. Therefore, pH 7.4 PBS (20 mM) was chosen to simulate the physiological condition.
 |
| | Fig. 1 Time-dependent absorption (a) and emission (b) spectra of BSP1 (10 μM) in the presence of 500 μM sulfite in 1 mM CTAB-PBS (20 mM, pH 7.4), λex = 512 nm (isosbestic point). | |
The selectivity and competition studies of BSP1 towards sulfite over various analytes
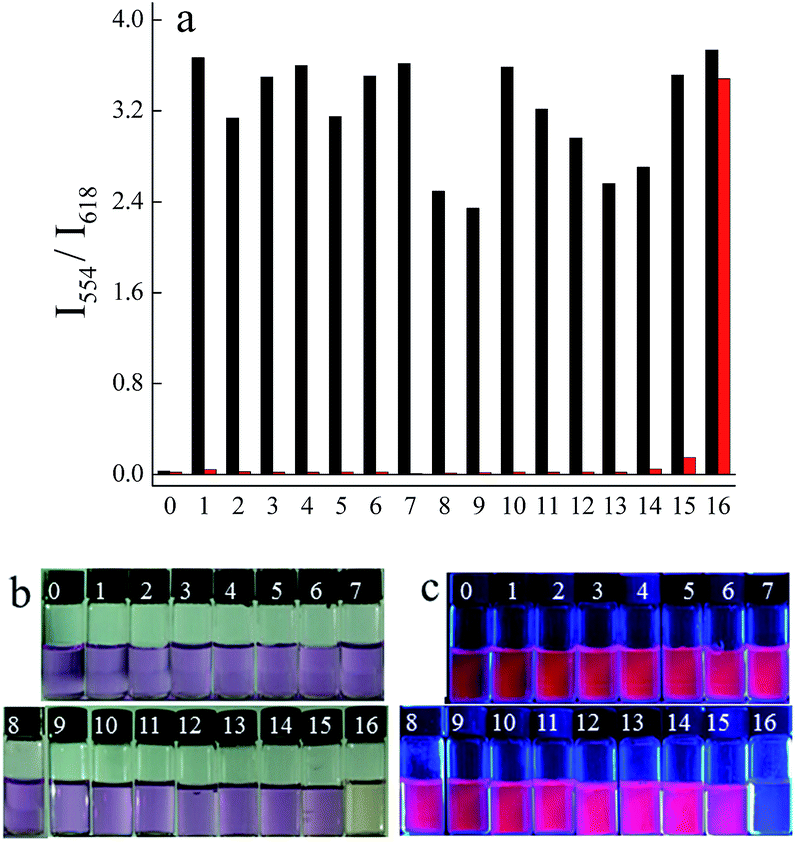
Selectivity and competition are two important properties of a probe for biological application. Then, we examined the fluorescence spectra of BSP1 incubated with kinds of biologically relevant anions and thiols, including F−, Cl−, Br−, AcO−, HCO3−, CN−, SCN−, NO2−, NO3−, PO43−, SO42−, S2O32−, cysteine (Cys), homocysteine (Hcy) and glutathione (GSH), under the same experimental conditions. It can be seen from Fig. 2 that BSP1 exhibits excellent selectivity and competition towards sulfite over other anions and thiols. Except for sulfide, other analytes did not trigger notable spectral changes of BSP1. Sulfide induced spectral changes to a less extent. Sulfide is a nucleophilic agent and can also form Micheal addition product with BSP1. But the nucleophilic reactivity of sulfide is much weaker than that of sulfite, suggesting that BSP1 is highly selective toward sulfite. Furthermore, the possible interferences by various agents were further evaluated through competitive experiments. The coexistence of other anions and biological thiols has negligible influence on the detection of sulfite, indicating that BSP1 could potentially be used to detect sulfite in realistic samples.
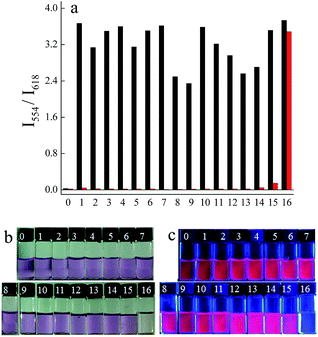 |
| | Fig. 2 The ratio of fluorescence intensities at 554 nm and 618 nm (I554/I618) of BSP1 in the presence of 50 equiv. of various additives with (black) or without (red) sulfite in CTAB-PBS equilibrium for 2 h and their corresponding photographs ((b) under natural light; (c) illuminated with a hand-lamp): (0) none; (1) AcO−; (2) Br−; (3) PO43−; (4) HCO3−; (5) NO2−; (6) F−; (7) SCN−; (8) NO3−; (9) S2O32−; (10) Cl−; (11) SO42−; (12) Cys; (13) Hcy; (14) GSH; (15) S2−; (16) SO32−. [BSP1] = 10 μM, [sulfite] = 500 μM, λex = 512 nm, recorded 2 h after the addition of the reagent in 1 mM CTAB-PBS (20 mM, pH 7.4), 25 °C. | |
Encouraged by the high selectivity of BSP1, we then tested the emission and absorption spectra of BSP1 in the presence of different concentrations of sulfite. Fig. 3 illustrates that the emission ratio of I554/I618 and absorbance ratio of A494/A554 were linearly proportional to sulfite concentration (0–300 μM) with a detection limit (S/N = 3) of 6.4 μM in CTAB-PBS solution. The above results verify that BSP1 can be used to quantitative measure sulfite concentrations below 300 μM.
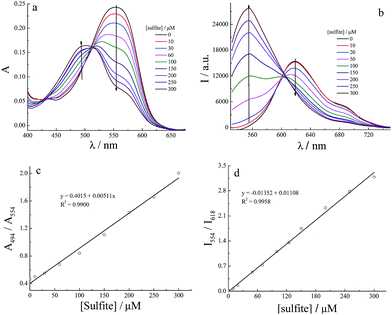 |
| | Fig. 3 The absorption (a) and emission (b) spectra of BSP1 in the presence of different concentrations of sulfite, the absorbance ratio at 494 nm and 554 nm (A494/A554) (c) and the fluorescence intensity ratio at 554 nm and 618 nm (I554/I618) (d) as a function of sulfite concentration. 1 mM CTAB-PBS (20 mM, pH 7.4), 25 °C, [BSP1] = 10 μM, λex = 512 nm, reordered 2 h after each addition. | |
Colorimetric response of BSP2 toward sulfite
From the above results, it is known that BSP1 exhibits colorimetric and ratiometric fluorescence responses to sulfite. However, its bad solubility and slow reaction rate with sulfite (≈2 h) may limit its application in fast identification of sulfite. In order to solve this problem, BSP1 was treated with MeI to give the quaternary ammonium salt BSP2. This modification is based on the following consideration: (1) normally, quaternary ammonium salts have good water solubility and (2) the strong electron-withdrawing property of quaternary ammonium salt can reduce the electron density of CC double bond, and the olefin in BSP2 can easily be attacked by the nucleophilic reagent sulfite.
As expected, BSP2 displayed good water solubility (Fig. S10†) and its absorption maximum is about 13 nm longer than that of BSP1 (Fig. S11†). Therefore, the detection of sulfite with BSP2 was performed in PBS. The presence of 50 equiv. of sulfite made the solution's color change from purple to orange immediately. The original absorption peak at 567 nm decreased companied with a new peak at 470 nm increased gradually (Fig. 4). The absorbance at 470 nm reached its maximum within 20 min. However, BSP2 and its addition product of sulfite are non-fluorescent, which could be ascribed to the strong photo-induced electron transfer from the fluorophore to electron-deficient quaternary ammonium salt. It is worth noting that CTAB micelles can accelerate the detection rate and improve the photophysical properties: the reaction was finished within 3 min and the reaction product of sulfite is weakly fluorescent (Fig. S12†).
 |
| | Fig. 4 Time-dependent absorption spectra of BSP2 (10 μM) in the presence of 500 μM of sulfite in PBS (20 mM, pH 7.4). | |
Good linear relationship was observed between the ratio of A470/A567 and the sulfite concentration ranging from 0 to 100 μM (Fig. S13†), which reveals that BSP2 could detect sulfite quickly and quantitatively in PBS. Biologically relevant analytes, such as biothiols and H2S, did not interfere with the detection of sulfite (Fig. 5), indicating that BSP2 exhibits good selectivity and competition for sulfite over other species.
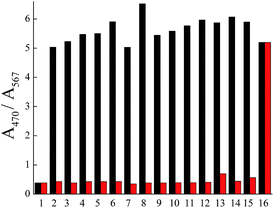 |
| | Fig. 5 The ratio of absorbance at 470 nm and 567 nm (A470/A567) of BSP2 in the presence of 50 equiv. of various additives with (black) or without (red) sulfite: (1) Br−; (2) PO43−; (3) HCO3−; (4) NO2−; (5) F−; (6) SCN−; (7) NO3−; (8) S2O32−; (9) Cl−; (10) SO42−; (11) Cys; (12) Hcy; (13) GSH; (14) S2−; (15) SO32−. [BSP2] = 10 μM, [sulfite] = 500 μM, recorded 20 min after the addition of the reagent in 1 mM CTAB-PBS (20 mM, pH 7.4), 25 °C. | |
Sensing mechanism of the probes to sulfite
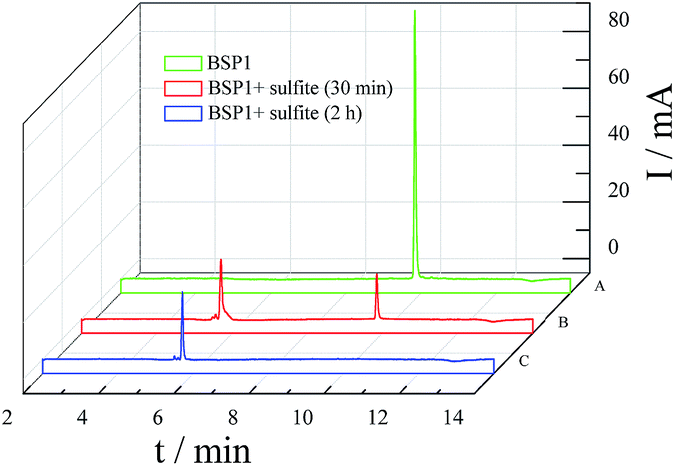
HPLC traces of the reaction process were monitored to further understand the sensing mechanism of the probes to sulfite. As shown in Fig. 6, the peak of BSP1 is at 9.83 min. After reacted with sulfite the origin peak decreased, and a new peak at 5.7 min appeared. After 2 h, the peak at 5.70 min reached its maximum and original peak disappeared. The peak at 5.70 min was supposed to be the Michael addition product (BSP1–SO3H).
 |
| | Fig. 6 HPLC trace of the reaction between BSP1 and sulfite in 1 mM CTAB-PBS (20 mM, pH 7.4). [BSP1] = 30 μM, [sulfite] = 1.5 mM, detected at 512 nm. | |
Fluorescent imaging in living cells
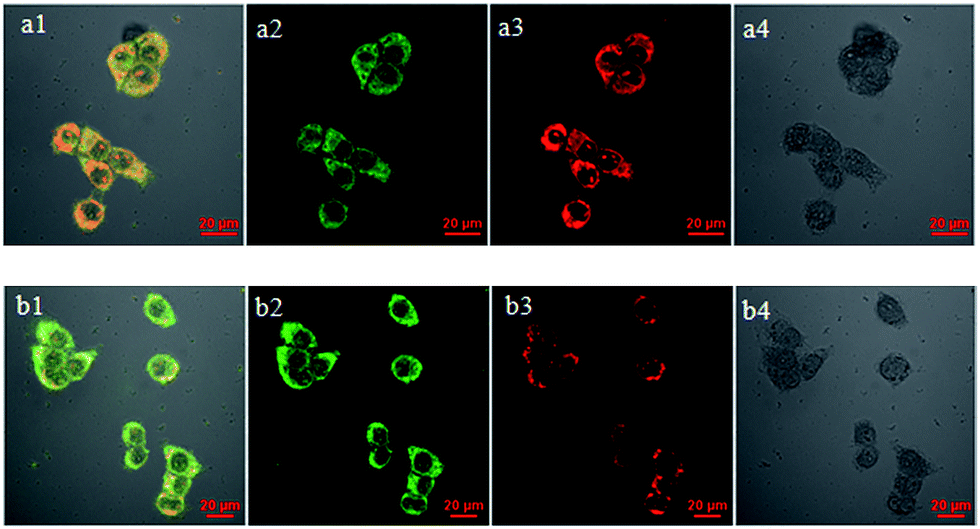
Finally, the capability of BSP1 for fluorescent imaging of sulfite in living cells was explored. After incubated HeLa cells with BSP1 (10 μM) for 120 min, weakly intracellular green fluorescence (Fig. 7a2) and strongly intracellular red fluorescence were observed (Fig. 7a3). Pretreated the cells with 1 mM sulfite followed by incubated with BSP1 for 2 h led to a marked increase in green emission (Fig. 7b2) and decrease in red emission (Fig. 7b3). These results verify that BSP1 could be a ratiometric fluorescence probe for subcellular imaging of sulfite.
 |
| | Fig. 7 Fluorescent images of HeLa cells incubated with 10 μM BSP1 at 37 °C. (a) HeLa cells incubated with BSP1 and CTAB for 2 h; (b) HeLa cells pretreated with 1 mM SO32− for 30 min followed by incubated with BSP1 and CTAB for another 2 h; (1) the merged images of (2) and (3); the fluorescent images at green (2) and red (3) channels; (4) the bright field images; λex = 514 nm, 1 mM CTAB-PBS (20 mM, pH 7.4). | |
Conclusion
In summary, two colorimetric/ratiometric fluorescence probes BSP1 and BSP2 based on the Micheal-addition reaction have been successfully developed for the detection of sulfite. BSP1 showed colorimetric and ratiometric fluorescence responses toward sulfite with a relatively long emission wavelength in CTAB micelles. BSP2 shows better water solubility and faster response to sulfite. Both probes had extraordinary selectivity and competition towards sulfite over other sulfur-containing compounds and common anions. Moreover, BSP1 can image sulfite in living cells. We hope this work could provide some new ideas in the design of fluorescence probes with relative long absorption and emission wavelengths for sulfite.
Acknowledgements
This work was financially supported by National Natural Science Foundation of China (No. 21576085) and Shanghai Municipal Natural Science Foundation (15ZR1409000).
Notes and references
- T.-M. Chen, J. Gokhale, S. Shofer and W. G. Kuschner, Am. J. Sci., 2007, 333, 249–256 Search PubMed.
- D. Q. Rich, J. Schwartz, M. A. Mittleman, M. Link, H. Luttmann-Gibson, P. J. Catalano, F. E. Speizer and D. W. Dockery, Am. J. Epidemiol., 2005, 161, 1123–1132 CrossRef PubMed.
- R.-C. Claudia and J.-C. Francisco, Food Chem., 2009, 112, 487–493 CrossRef PubMed.
- S. L. Taylor, N. A. Higley and R. K. Bush, Adv. Food Res., 1986, 30, 1–76 CAS.
- Z. Q. Meng, G. H. Qin, B. Zhang and J. L. Bai, Mutagenesis, 2004, 19, 465–468 CrossRef CAS PubMed.
- A. Isaac, C. Livingstone, A. J. Wain, R. G. Compton and J. Davis, TrAC, Trends Anal. Chem., 2006, 25, 589–598 CrossRef CAS PubMed.
- R. F. McFeeters, J. Food Prot., 1998, 61, 885–890 CAS.
- A. Isaac, A. J. Wain, R. G. Compton, C. Livingstone and J. Davis, Analyst, 2005, 130, 1343–1344 RSC.
- T. Fazio and C. R. Warner, Food Addit. Contam., 1990, 7, 433–454 CrossRef CAS PubMed.
- M. Koch, R. Koeppen, D. Siegel, A. Witt and I. Nehls, J. Agric. Food Chem., 2010, 58, 9463–9467 CrossRef CAS PubMed.
- U. T. Yilmaz and G. Somer, Anal. Chim. Acta, 2007, 603, 30–35 CrossRef CAS PubMed.
- L. Pizzoferrato, G. Di Lullo and E. Quattrucci, Food Chem., 1998, 63, 275–279 CrossRef CAS.
- R. F. McFeeters and A. O. Barish, J. Agric. Food Chem., 2003, 51, 1513–1517 CrossRef CAS PubMed.
- K. Wang, J. Huang, X. Yang, X. He and J. Liu, Analyst, 2013, 138, 62–71 RSC.
- M. G. Choi, J. Hwang, S. Eor and S.-K. Chang, Org. Lett., 2010, 12, 5624–5627 CrossRef CAS PubMed.
- X. Gu, C. Liu, Y.-C. Zhu and Y.-Z. Zhu, J. Agric. Food Chem., 2011, 59, 11935–11939 CrossRef CAS PubMed.
- S. Chen, P. Hou, J. Wang and X. Song, RSC Adv., 2012, 2, 10869–10873 RSC.
- M.-Y. Wu, T. He, K. Li, M.-B. Wu, Z. Huang and X.-Q. Yu, Analyst, 2013, 138, 3018–3025 RSC.
- Y.-Q. Sun, J. Liu, J. Zhang, T. Yang and W. Guo, Chem. Commun., 2013, 49, 2637–2639 RSC.
- H. Tian, J. Qian, Q. Sun, H. Bai and W. Zhang, Anal. Chim. Acta, 2013, 788, 165–170 CrossRef CAS PubMed.
- X. Pei, H. Tian, W. Zhang, A. M. Brouwer and J. Qian, Analyst, 2014, 139, 5290–5296 RSC.
- Y.-Q. Sun, P. Wang, J. Liu, J. Zhang and W. Guo, Analyst, 2012, 137, 3430–3433 RSC.
- G. J. Mohr, Chem. Commun., 2002, 2646–2647 RSC.
- C. Yu, M. Luo, F. Zeng and S. Wu, Anal. Methods, 2012, 4, 2638–2640 RSC.
- K. Chen, Y. Guo, Z. Lu, B. Yang and Z. Shi, Chin. J. Chem., 2010, 28, 55–60 CrossRef CAS PubMed.
- Y. Xiao-Feng, Z. Minglei and W. Gang, Sens. Actuators, B, 2011, 152, 8–13 CrossRef PubMed.
- A. V. Leontiev and D. M. Rudkevich, J. Am. Chem. Soc., 2005, 127, 14126–14127 CrossRef CAS PubMed.
- Y. Sun, C. Zhong, R. Gong, H. Mu and E. Fu, J. Org. Chem., 2009, 74, 7943–7946 CrossRef CAS PubMed.
- F. Kong, R. Liu, R. Chu, X. Wang, K. Xu and B. Tang, Chem. Commun., 2013, 49, 9176–9178 RSC.
- L. Long, L. Zhou, L. Wang, S. Meng, A. Gong, F. Du and C. Zhang, Org. Biomol. Chem., 2013, 11, 8214–8220 CAS.
- C. Liu, L. Liu, X. Li, C. Shao, X. Huang, B. Zhu and X. Zhang, RSC Adv., 2014, 4, 33507–33513 RSC.
- R. Ziessel, G. Ulrich and A. Harriman, New J. Chem., 2007, 31, 496–501 RSC.
- A. Loudet and K. Burgess, Chem. Rev., 2007, 107, 4891–4932 CrossRef CAS PubMed.
- G. Ulrich, R. Ziessel and A. Harriman, Angew. Chem., Int. Ed., 2008, 47, 1184–1201 CrossRef CAS PubMed.
- H. Tian, J. Qian, Q. Sun, C. Jiang, R. Zhang and W. Zhang, Analyst, 2014, 139, 3373–3377 RSC.
Footnote |
| † Electronic supplementary information (ESI) available. See DOI: 10.1039/c5ra17962a |
|
| This journal is © The Royal Society of Chemistry 2015 |
Click here to see how this site uses Cookies. View our privacy policy here.