Design, synthesis and biological evaluation of coumarin coupled nitroimidazoles as potential imaging agents
Nisha Sainiab,
Raunak Varshneya,
Anjani K. Tiwari*a,
Ankur Kaula,
M. P. S. Isharb and
Anil K. Mishra*a
aInstitute of Nuclear Medicine and Allied Sciences, Brig S K. Majumdar Road, Delhi-54, India. E-mail: anjani7797@rediffmail.com; akmishra63@gmail.com; Tel: +91-11-23905387
bDepartment of Pharmaceutical Sciences, Guru Nanak Dev University, Amritsar-005, India
First published on 12th October 2015
Abstract
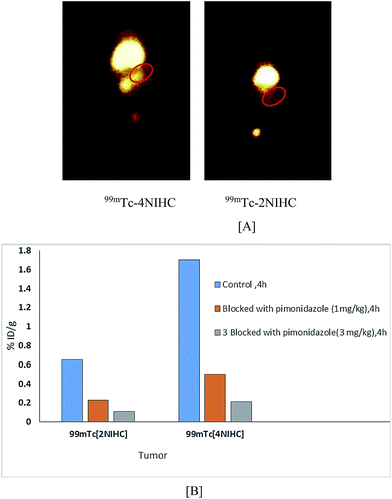
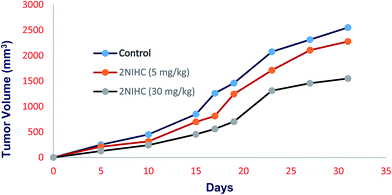
Solid tumors contain regions of hypoxia in comparison to normal tissues. The nitroimidazoles have shown great promise for targeting different types of cancers. The present work involves the design, syntheses, and in vitro and in vivo investigations of hypoxia targeted nitroimidazole radioconjugates (2NIHC and 4NIHC). Flow cytometry analysis showed that the normoxic–hypoxic mean fluorescence of 2NIHC is 10 fold greater than that of 4NIHC and much higher than that of the well-known pimonidazole hypoxia marker. Furthermore, molecular modeling studies of these ligands with CK2α revealed that 2NIHC is a more potential CK2α inhibitor due to π–π interactions and H-bonding with Val116, Glu114, Asp175, Asn161 and His160 in the active pockets of the target. Radio labeling yields for both the complexes with 99mTc were >98%. Biodistribution in EAT tumor bearing mice demonstrated rapid clearance of 99mTc-2NIHC and high T/M ratio (3.57% ID/g) as compared to 99mTc-4NIHC (2.05% ID/g) at 4 h. IC50 values of both ligands were estimated by MTS in different cell lines in addition to tumor regression studies.
1. Introduction
Adaptation of tumor cells to hypoxia is a critical driving force in tumor progression and metastasis.1 Such hypoxic zones have been postulated to have a reduced response to radiotherapy due to a decrease in oxygen free radicals that are required to produce enough DNA damage to give cell death.2 In addition, cells of these regions are considered to be chemo-therapy resistant due to limited delivery of drugs via circulation.3,4 Therefore, identification of hypoxic zones becomes crucial for effective treatment of tumors.A decade before assessment of hypoxia in tumor was difficult, as it involves the use of polarographic electrodes.5 It was invasive, expensive and limited for usage in few tumors. It led to the exploration of noninvasive method of diagnosing tumor hypoxia. In this regard, several probes have been developed to image hypoxia using PET and SPECT in nuclear medicine. Appropriately labeled nitroimidazoles (NI) are particularly attractive for imaging tumor hypoxia as nitro group undergoes one electron reduction by intracellular reductases, selectively in hypoxic conditions to generate reactive intermediates, which bind to cellular components and get trapped inside the cell.6 The PET radiotracer includes, [18F] EF5,7 [18F] FETNIM,8 [18F] FAZA9 but the use of above markers get limited due to the choice of radioisotope and it has led to great interest in the development of 99mTc labeled compounds like BMS1813-21,10 BRV59-21![[thin space (1/6-em)]](https://www.rsc.org/images/entities/char_2009.gif) 11 and HL91.12–14
11 and HL91.12–14
A constraint in the development of radiopharmaceuticals is the inability to image at cellular and sub cellular level. Dual modality imaging is emerging as a method for improved visual quality as well as increase the qualitative accuracy of radio imaging for diagnosis of a variety of diseases. For mechanistic studies of the uptake and bio-distribution in cells, the coupling of radio imaging with optical imaging is desirable. Chromophores are responsible for cell auto fluorescence predominantly in the blue region of the spectrum allowing the visualization at the cellular level. One of the used example is the nitro group which quenches the fluorescence of the ring system. Nitroimidazoles with fluorescent groups on side chain were well reported as hypoxic cell markers.15,16 We have selected substituted coumarins as fluorescent label for imaging hypoxic cells because substituted coumarins with electron donating group (–OH, –OCH3) at 7th position resulted in the increase of fluorescence.17,18
Protein kinase CK2 often presents as a heterotetramer composed of two catalytic α subunits and two regulatory β subunits. Overexpressed CK2α is a key oncogenic force for tumorigenesis, and pharmacological inhibitors of this therapeutic target have been considered as promising drug candidates.19,20 Besides that many hydroxycoumarins display IC50 (and Ki) values in micro to nano level.17,18 Therefore here we report synthesis and biological evaluation of 7-hydroxycoumarin coupled nitroimidazole derivatives i.e. 2NIHC and 4NIHC.
2. Experimental section
All the chemicals were purchased from Sigma-Aldrich and Merck. All solvents used were of analytical grades. TLC was run on silica gel coated aluminium sheets (Silica gel 60 F254, Merck, Germany) and visualized in UV light 254 nm. Radiocomplexation and radiochemical purity were checked by thin layer chromatography.2.1 Instrumentation
1H and 13CNMR spectra were recorded on a Bruker Avance II 400 MHz system (Ultra shield). Mass spectra (ESI-MS in positive and negative ion mode) were performed on Agilent 6310 system ion trap. Radioimaging was performed using HAWKEYE gamma camera and single well type capintec γ scintillation counter respectively. Molecular modeling investigations were carried out using an advanced molecular docking program GLIDE, version 9.3 (Schrodinger, Inc, USA).2.2 Cell culture
Cells were maintained in minimal essential medium supplemented with 10% fetal bovine serum, 4 mM glutamine, 1 mM sodium pyruvate, and 50 μg ml−1 gentamicin. Cells were grown in a humidified incubator at 37 °C/5% CO2 and removed from flasks for passage or for transfer to 12-well assay plates by incubating them with 0.25% trypsin/EDTA.2.3 Evaluation of in vitro specificity
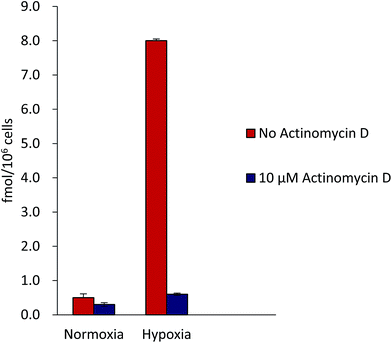
Completion ability of the CA-IX inhibitor with 99mTc-2NIHC for binding to hypoxic HeLa cells was examined. HeLa cells were plated in 12-well plates at approximately 2.5 × 10⁵ cells per well and allowed to adhere to the plate for 24 h. Cells were then incubated under hypoxic conditions (0.1% O2/5% CO2 at 37 °C) for an additional 24 h. The cells were then removed from hypoxia and incubated for 1 h in HBS Solution along with 0.5% BSA and 5 nM 999mTc-2NIHC in the presence of 10 μM actinomycin D. The assay media was then removed and the cells were washed 2× with cold HBS/0.5% BSA, collected by adding 0.25 mL of 1% SDS, and transferred to a 1.5 mL tube for counting the amount of radioactivity by gamma counter.BALB/c mice (aged 2 months) weighing between 20 and 25 g were selected for the study. EAT was maintained in the peritoneum of the mice in the ascites form by serial weekly passage. Exponentially growing EAT (Ehlrisch ascites tumor) cells were harvested, washed, and resuspended in PBS and 107 cells per mice were injected intramuscularly in the thigh of the left hind leg of the mice. Animal models were ready for hypoxic studies when tumor grew to a volume of 500–800 cm3 in 12–14 days.
2.4 Synthesis
![[double bond, length as m-dash]](https://www.rsc.org/images/entities/char_e001.gif) O). MS (ESI): found 161.2 [M + H]+, 105.5 [M − (C(CH3)3)]+.
O). MS (ESI): found 161.2 [M + H]+, 105.5 [M − (C(CH3)3)]+.4-Nitroimidazole derivative. 1H NMR (400 MHz, D2O) 1H: 1.83–1.96 (m, 2H), 1.99–2.10 (m, 2H), 3.42 (t, J = 6.0 and 6.0 Hz, 2H), 4.09 (t, 2H, J = 7.2 and 7.2 Hz). 7.53 (s, 1H), 7.85 (s, 1H). 13C NMR (100 MHz, D2O) ppm: 29.15, 32.29, 47.60, 119.35, 136.06, 148.11. MS (ESI): found 248.0 and 250.0 [M + H]+, 270.0 and 272.2 [M + Na]+ with isotopic pattern of Br.
2-Nitroimidazole derivative. 1H NMR (400 MHz, D2O) 1H: 1.89–1.96 (m, 2H), 2.01–2.14 (m, 2H), 3.41 (t, J = 6.4 and 6.4 Hz, 2H), 4.45 (t, 2H, J = 7.2 and 7.2 Hz). 7.13 (d, 2H, J = 6.0 Hz). 13C NMR (100 MHz, D2O, Me4Si): 13C = 29.29, 30.93, 32.38, 49.43, 126.02, 128.52. MS (ESI): found 248 and 250 [M + H]+ with isotopic pattern of Br.
2-nitroimidazole Derivative. 1H NMR (400 MHz, DMSO) 1H: 1.73–1.79 (m, 4H, CH2), 3.0 (brs, 4H, CH2), 3.44 (brs, 4H, CH2), 3.63 (s, 2H, CH2), 4.27–4.34 (m, 2H, CH2), 6.01 (s, 1H, CH), 6.35 (brs, 1H, CH), 6.60 (brs, 1H, CH), 7.00 (brs, 1H, CH), 7.29 (d, 2H, J = 16.4 Hz, CH). 13C NMR (100 MHz, DMSO) 13C: 26.22, 28.21, 37.13, 39.01, 49.90, 52.69, 60.99, 102.66, 111.81, 113.68, 126.30, 127.76, 127.94, 144.18, 151.31, 154.18, 160.35, 161.66, 163.69, 171.70. HRMS: 429.1782.
4-Nitroimidazole derivative. 1H NMR (400 MHz, DMSO) 1H: 1.69–1.76 (m, 2H, CH2), 1.90–1.97 (m, 2H, CH2), 2.39 (s, 2H, CH2), 2.50–2.51 (m, 4H, CH2), 4.10 (t, J = 6.4 and 6.4 Hz, 2H, CH2), 4.15 (t, J = 7.2 and 7.2 Hz, 2H, CH2), 6.20 (s, 1H, J = 0.8 Hz, CH), 6.71 (br, s, NH), 6.93- 6.96 (m, 2H, CH), 7.35 (br, s, 1H, NH), 7.67 (d, 1H, J = 8.8 Hz, CH), 7.91 (dd, 1H, J = 10.8 and 10.8 Hz, CH), 8.46 (dd, 1H, 10.4 and 10.4 Hz, CH). 13C NMR (100 MHz, DMSO) 13C: 18.59, 22.91, 25.68, 27.13, 47.50, 68.02, 101.62, 111.53, 112.95, 113.55, 122.03, 126.94, 137.90, 147.41, 154.01, 155.16, 162.02, 172.24. HRMS: 429.1846.
2.5 In-vitro study
2.6 Computational analysis
Docking experiments were carried out by using GLIDE (grid based ligand docking with energetic) and ligand docking programme from calculations in extra precision (XP) mode. The docking was initiated with putting specified receptor grid and prepared ligand molecule together. GLIDE was run in the flexible docking mode which automatically generates conformations for each input ligand. The combination of position and orientation of a ligand relative to the receptor, along with its conformations in flexible docking is referred to as a ligand pose. The ligand poses that GLIDE generates pass through a series of hierarchial filters that evaluate the ligand's interaction with the receptor. The initial filters test the spatial fit of the ligand to the defined active site, and examine the complementarity of ligand–receptor interactions using a grid based method pattern after the empirical chemscore function. Poses that pass their initial screens enter the final stage of the algorithm, which involves evaluation and minimization of a grid approximation to the OPLS-AA non-bonded ligand receptor interaction energy. Final scoring was then carried out on the energy minimized poses. By default, Schrodinger's proprietary glide score multi-ligand scoring function was used to score the poses and analyze the result of binding affinity on the basis of the score. The time to dock one ligand was approximately 2–5 min.
2.7 Radiochemistry
![[thin space (1/6-em)]](https://www.rsc.org/images/entities/char_2009.gif) :
:![[thin space (1/6-em)]](https://www.rsc.org/images/entities/char_2009.gif) 5
5![[thin space (1/6-em)]](https://www.rsc.org/images/entities/char_2009.gif) :
:![[thin space (1/6-em)]](https://www.rsc.org/images/entities/char_2009.gif) 1.5) and saline. TLC strips were cut into 0.5 cm fragments and counts of each fragment were taken. The complexed 99mTc remained at the origin whereas free 99mTc moved with the solvent front.
1.5) and saline. TLC strips were cut into 0.5 cm fragments and counts of each fragment were taken. The complexed 99mTc remained at the origin whereas free 99mTc moved with the solvent front.![[thin space (1/6-em)]](https://www.rsc.org/images/entities/char_2009.gif) :
:![[thin space (1/6-em)]](https://www.rsc.org/images/entities/char_2009.gif) 5
5![[thin space (1/6-em)]](https://www.rsc.org/images/entities/char_2009.gif) :
:![[thin space (1/6-em)]](https://www.rsc.org/images/entities/char_2009.gif) 1.5) as a mobile phase. Percentage of free pertechnetate at different time intervals was estimated from it, which gives the percentage labeling efficiency or dissociation of the complex.
1.5) as a mobile phase. Percentage of free pertechnetate at different time intervals was estimated from it, which gives the percentage labeling efficiency or dissociation of the complex.2.8 In vivo study
3. Results and discussion
3.1 Chemistry: synthesis of 7-hydroxycoumarin coupled 2(4)-nitroimidazole derivatives
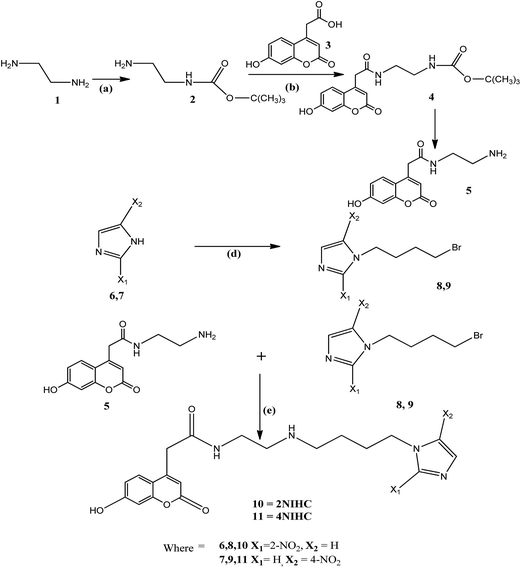
The mono tert-butyl ester of ethylenediamine was achieved by the controlling the stoichiometric amount of boc-anhydride. The (2-amino-ethyl)-carbamic acid tert-butyl ester 2 was prepared by dropwise addition of boc-anhydride to ethylene diamine in the presence of triethylamine at 0 °C followed by stirring at room temperature for 12 h in good yield (79%) (Scheme 1). The oily product was obtained used as such without further purification. The COOH group of 7-hydroxy coumarinyl-4-acetic acid 3 was in situ converted into to the active ester by using HOBT and DCC in dried DMF. The active ester was coupled to the NH2 group of synthesized oily compound for 2 h at 0 °C. The stirring was continued for 24 h at room temperature. The dicyclohexyl urea was filtered off and solvent was concentrated to afford the {2-(2-hydroxy-2-oxo-2H-chromen-4-yl)-acetylaminoethyl}-carbamic acid tert-butyl ester. The compound was purified by column chromatography to give 4 in 70% yield. Deprotection of tert-butyl ester 4 with trifluoroacetic acid in dried DCM furnished N-(2-amino-ethyl)-2-(7-hydroxy-2-oxo-2-2H-chromen-4-yl)-acetamide 5 (69%) in 6 h. Additionally 2-nitroimidazole and 4-nitroimidazole were refluxed with 1,4-dibromobutane in the presence of potassium carbonate at 70 °C for 0.5 h. The reaction mixture was cooled down to the room temperature and K2CO3 was removed by simple filteration by Whatman filter paper. The compound was purified by column chromatography and finally crystallized to yielded 1-(4-bromo-butyl)-4-nitro-1H-imidazole 8 as yellow powder and 1-(4-bromo-butyl)-2-nitro-1H-imidazole 9 as yellow crystal respectively in 76–79% overall yields. The bromo group of nitroimidazole derivative 8 and 9 were finally reacted with substituted acetamide 5 at 80 °C for 10 h in presence of triethylamine to give the desired products i.e. 2-(7-hydroxy-2-oxo-2H-chromen-4-yl)-N-{2-[4-nitro-imidazole-1-yl)-pentylamino]-ethyl}-acetamide (4-NIHC) 10 and 2-(7-hydroxy-2-oxo-2H-chromen-4-yl)-N-{2-[5-(2-nitro-imidazol-1-yl)-pentylamino]-ethyl}-acetamide (2-NIHC) 11 in 60–68% yields.3.2 Biological characterization
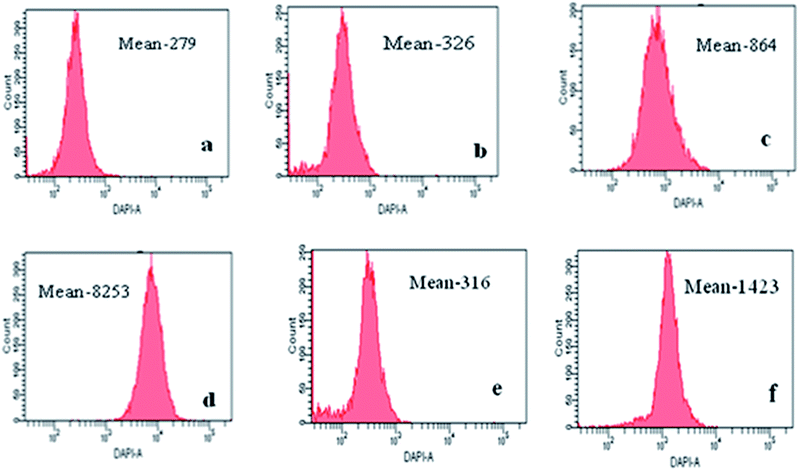
In vitro potency of 2NIHC and 4-NIHC was determined by flow cytometric analysis of cells incubated with both compounds under normoxic and hypoxic conditions as shown in Fig. 2.
There was no significant difference in the controls of hypoxic and normoxic conditions and histograms of 2NIHC and 4NIHC can be compared to them. There was approximately 10 fold increase in mean fluorescence in hypoxic cells when A549 (ref. 21 and 22) cells were incubated with 2NIHC as compared to normoxic condition i.e. from 864 to 8253. However in 4NIHC, only five time increase in uptake was noticed in hypoxic condition i.e. 316 to 1423. The negligible amount of overlap between the fluorescence of hypoxic and well oxygenated cells incubated with 2NIHC would be a desirable property of a compound to measure a low proportion of hypoxic cells in a well oxygenated tumor. Mean fluorescence of pimonidazole23 in normoxic as well as in hypoxic cell is 56.8 and 286 with cells in the range of 101 to 103 i.e. mean fluorescence increases only five fold in hypoxic cells. Comparative studies showed that mean fluorescence is much higher for 2NIHC with cells in the range of more than 104, which makes it a highly selective hypoxia marker.
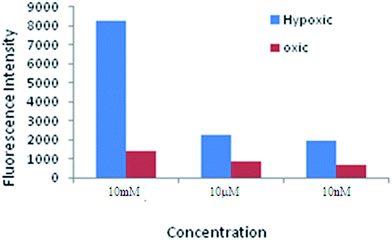
The concentration dependent development of fluorescence in cells incubated with 2NIHC is shown in Fig. 3. A large differential can be seen in fluorescence of cells incubated under normoxic and hypoxic conditions at different concentrations. Thus maximum fluorescence intensity was observed with 10 mM concentration of 2NIHC which indicates that drug binds firmly to the cellular macromolecules.
| Compound | IC50 ± SD (μM) | |||
|---|---|---|---|---|
| HeLaa,b | A549a,b | EATa,b | CK2αa,b | |
| a Cells were exposed in optimal culture conditions in 96-well plates to seven concentrations of the compounds (1, 5, 10, 15, 20, 25 and 100 μM) or control medium for 24 h before determining cellular metabolic activity by an MTS tetrazolium compound bioreduction assay.b Each value is determined from five samples using a non-linear regression analysis. | ||||
| 2NIHC | 13.22 ± 0.95 | 9.58 ± 0.76 | 16.24 ± 0.42 | 11.28 ± 3.86 |
| 4NIHC | 19.02 ± 1.02 | 15.78 ± 0.58 | 19.98 ± 0.17 | 27.18 ± 5.39 |
| Actinomycin D | 1.85 ± 0.46 | 1.16 ± 0.82 | 2.92 ± 0.66 | 4.86 ± 1.15 |
| Doxorubicin | 9.21 ± 0.32 | 6.08 ± 0.14 | 7.83 ± 0.82 | 6.32 ± 0.20 |
Determination of CK2α activity. The final reaction mixture (final volume of 40 μL) for the determination of CK2 activity (apoenzyme CK2α or holoenzyme CK2α/2β2) contained: casein substrate (75 μg) or peptide substrate (RRRDDDSDDD, 20 μM), Tris–HCl pH 7.5 (20 mM), MgCl2 (20 mM) and appropriate concentrations of inhibitor in 1 μL DMSO. After 30 min of incubation at 30 °C, 40 μL of the assay mixture was spotted onto a square (2 cm × 2 cm) of Whatman 3 MM (for casein), which was immediately immersed in cold 5% (w/v) trichloroacetic acid containing 0.3% o-phosphoric acid (10 mL per square), and washed with H2O three times for 10 min. Then the requisite squares were washed in 96% ethanol and dried. The radioactivity was quantified by liquid scintillation counter.
2NIHC was incubated with hypoxic or normoxic HeLa cells in the presence or absence of 10 μM actinomycin D.
3.3 Computational analysis
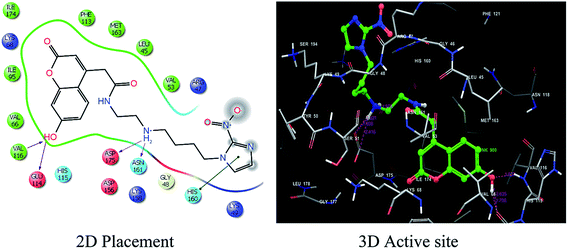
Primarily hydroxyl group at the 7 position of coumarin moiety is considered as essential feature to increase the inhibitory potency. Analysis of the lipophilic contact term (−4.4) clearly reveals that the binding site is very hydrophilic and hydrophilic interactions dominate (Table 2). The van der Waals energy is considered to be the main energy term favoring binding. Even with less favorable van der Waals energy for 10 (−40.1 kcal mol−1) in comparison to 11 i.e. −50.6 kcal mol−1, ligand 4NIHC achieves the highest glide score. The Emodel energy term of −75.1 kcal mol−1 for the highest ranked ligand 10 shows that this is the dominant interaction controlling the ranking of a ligand. For instance, in 4NIHC substitution of nitro group at position 2 results in loss of activity with glide score decrease from −9.5 to −3.6. Although the EvdW and Ecoul energy terms for 11 is higher than 10 but possess low glide score due to low Emodel and Hbond values. However the contribution of Hbond for 10 is −2.1 which is highest among the other coumarin derivatives and revealed that there is good hydrogen bonding interaction between ligand 10 and the crystal structure of protein complex CK2α.
3.4 Radiochemistry
3.5 In vivo study
| Organ | % ID/g | ||
|---|---|---|---|
| 1 h | 4 h | 24 h | |
| a Values are expressed as the mean ± SD; n = 3. | |||
| Blood | 4.82 ± 0.12 | 2.67 ± 0.14 | 2.75 ± 0.07 |
| Heart | 1.88 ± 0.2 | 0.83 ± 0.11 | 0.82 ± 0.08 |
| Kidney | 22.41 ± 1.04 | 18.37 ± 1.09 | 12.60 ± 0.95 |
| Liver | 15.53 ± 1.04 | 11.21 ± 0.68 | 10.05 ± 0.22 |
| Lungs | 1.65 ± 0.14 | 1.78 ± 0.21 | 2.89 ± 0.08 |
| Stomach | 0.97 ± 0.14 | 0.89 ± 0.12 | 0.75 ± 0.08 |
| Muscle | 0.81 ± 0.02 | 0.44 ± 0.01 | 0.45 ± 0.002 |
| Tumor | 1.66 ± 0.02 | 0.86 ± 0.01 | 0.32 ± 0.02 |
| T/M ratio | 2.05 ± 0.34 | 1.99 ± 0.27 | 1.02 ± 0.29 |
| Organ | % ID/g | ||
|---|---|---|---|
| 1 h | 4 h | 24 h | |
| a Values are expressed as the mean ± SD; n = 3. | |||
| Blood | 4.89 ± 0.12 | 1.39 ± 0.14 | 0.24 ± 0.07 |
| Heart | 0.55 ± 0.2 | 1.35 ± 0.11 | 0.13 ± 0.08 |
| Kidney | 29.60 ± 1.04 | 37.99 ± 1.09 | 17.73 ± 0.95 |
| Liver | 13.27 ± 1.04 | 9.05 ± 0.68 | 1.47 ± 0.22 |
| Lungs | 9.23 ± 0.14 | 5.69 ± 0.21 | 2.46 ± 0.08 |
| Stomach | 0.85 ± 0.14 | 0.52 ± 0.12 | 0.18 ± 0.08 |
| Muscle | 0.32 ± 0.02 | 0.23 ± 0.01 | 0.07 ± 0.002 |
| Tumor | 0.59 ± 0.02 | 0.83 ± 0.01 | 0.20 ± 0.02 |
| T/M ratio | 1.82 ± 0.34 | 3.57 ± 0.27 | 2.97 ± 0.29 |
4. Conclusion
In conclusion, we have synthesized and evaluated two nitroimidazole conjugated fluorophore systems, 2NIHC and 4NIHC for the purpose of enhancing retention in hypoxic cells. Computational docking study showed that the 2NIHC is potent CK2 inhibitor. The flow cytometry demonstrated that only 2NIHC showed improved retention in hypoxic relative to normoxic cells. In vitro studies confirm its potential and selectivity for hypoxic cells. Further longitudinal animal studies and optimization may give a lead for new small molecule based agent which may be useful for clinical application.Conflict of interest
This is also certified that there is no interest of conflict between the authors of this manuscript.Abbreviations
| NIHC | Nitroimidazoles hydroxyl coumarin |
| NI | Nitroimidazoles |
| CK2 | Casein kinase 2 |
| EAT | Ehlrisch ascites tumor |
| GLIDE | Grid based ligand docking with energetic |
| MBq | Megabecquerel |
| PET | Positron emission tomography |
| XP | Extra precision |
| ITLC | Instant thin layer chromatography |
| PAW | Pyridine, acetic acid and water |
Acknowledgements
We are highly thankful to Dr R. P. Tripathi, Director INMAS, for providing necessary facilities. The work was supported by Council of Scientific and Industrial research (CSIR) and Defence Research and Development Organization, under R&D project INM-311(3.1).References
- J. Zhou, T. Schmid, S. Schnitze and B. Brune, Cancer hypoxia and cancer progression, Cancer Lett., 2006, 237(1), 10–21 CrossRef CAS PubMed.
- P. Vaupel and L. Harrison, Tumor hypoxia: causative factors, compensatory mechanisms and cellular response, Oncologist, 2004, 9(5), 4–9 CrossRef PubMed.
- J. M. Browm, Tumor hypoxia in cancer therapy, Methods Enzymol., 2007, 435(10), 297–321 Search PubMed.
- A. M. Shannon, D. J. Bouchier-Hates, C. M. Condron and D. Toomey, Tumor hypoxia, chemotherapeutic resistance and hypoxia related therapies, Cancer Treat. Rev., 2003, 29(4), 297–307 CrossRef CAS PubMed.
- H. Lyng, K. Sundfor and E. K. Rofstad, Oxygen tension in human tumors measured with polarographic needle electrodes and its relationship to vascular density, necrosis and hypoxia, Radiother. Oncol., 1997, 44(2), 163–169 CrossRef CAS PubMed.
- A. Nunn, K. Linder and H. W. Strauss, Nitroimidazoles and imaging hypoxia, Eur. J. Nucl. Med. Mol. Imaging, 1995, 22(3), 265–280 CrossRef CAS PubMed.
- G. Mees, R. Diercks, C. Vangestel and C. V. Wiele, Molecular imaging of hypoxia with radiolabeled agents, Eur. J. Nucl. Med. Mol. Imaging, 2009, 36(10), 1674–1886 CrossRef CAS PubMed.
- L. S. Ziemer, S. M. Evans, A. V. Kachur, A. L. Shuman, C. A. Cardi, W. T. Jenkins, J. S. Karp, A. Alavi, W. R. Dolbier and C. J. Koch, Non invasive imaging of hypoxia in rats using the 2-nitroimidazole 18F-EF5, Eur. J. Nucl. Med. Mol. Imaging, 2003, 30(2), 259–266 CrossRef CAS PubMed.
- L. Kaisa, O. Vesa, N. Samuel, G. Tove, R. Anne, E. Olli and M. Heikki, Quantifying tumor hypoxia with 18F-fluroerythronitroimidazole (18F-FETNM) using tumor to plasma ratio, Eur. J. Nucl. Med., 2003, 30(3), 101–108 Search PubMed.
- K. E. Linder, Y. W. Chan, J. E. Cyr, M. F. Malley, D. P. Nowotnik and A. D. Nunn, TcO(PnAO-1-(2-nitroimidazole)) [BMS-181321], a new technetium-containing nitroimidazole complex for imaging hypoxia: synthesis, characterization, and xanthine oxidase-catalyzed reduction, J. Med. Chem., 1994, 37(1), 9–17 CrossRef CAS PubMed.
- T. Melo, J. Duncan, J. R. Ballinger and A. M. Rauth, BRU59–21, a second generation 99mTc-labeled 2-nitroimidazole for imaging hypoxia in tumors, J. Nucl. Med., 2000, 41(1), 169–176 CAS.
- S. J. Wang, J. M. Lo, L. H. Shen and S. P. Wey, Tumor Uptake of 99mTc-HL91 and 99mTc-PnAO-Nitroimidazole in an Animal Model of Non-small Cell Lung Cancer, Ann. Nucl. Med., 2004, 17, 139–146 Search PubMed.
- R. D. Okada, G. Johnson, K. N. Nguyen, B. Edwards, C. M. Archer and J. D. Kelly, 99mTc-HL91 effects of low flow and hypoxia on a new ischemia-avid myocardial imaging agent, Circulation, 1997, 95, 1892–1899 CrossRef CAS PubMed.
- G. J. R. Cook, S. Houston, S. F. Barrington and I. Fogelman, Technetium-99m-labeled HL91 to identify tumor hypoxia: correlation with fluorine-18-FDG, J. Nucl. Med., 1998, 39, 99–103 CAS.
- P. Wardman, E. D. Clarke, R. J. Hodgkiss, R. W. Middleton, J. Parrick and M. R. L. Stratford, Nitroaryl compounds as potential fluorescent probes for hypoxia. II. Identification and properties of reductive metabolites, Int. J. Radiat. Oncol., Biol., Phys, 1984, 10(8), 1353–1356 CrossRef.
- R. J. Hodgkiss, G. W. Jones, A. Long, R. W. Middleton, J. Parrick, M. R. L. Stratford, R. Wardman and G. D. Wilson, Fluorescent markers for hypoxic cells: a study of nitroaromatic compounds, with fluorescent heterocyclic side chains, that undergo bioreductive binding, J. Med. Chem., 1991, 34(7), 2268–2274 CrossRef CAS PubMed.
- Q. Zhu, M. Uttamchandani, D. Li, M. L. Lesaicherre and S. Q. Yao, Enzymatic profiling system in a small molecule array, Org. Lett., 2003, 5(8), 1257–1260 CrossRef CAS PubMed.
- I. Kostova, Synthetic and natural coumarins as cytotoxic agents, Curr. Med. Chem.: Anti-Cancer Agents, 2005, 5(1), 29–46 CrossRef CAS PubMed.
- Z. Dan, H. Jennifer, H. Robert, A. Mahan, P. Owen, D. Gordafaried, H. H. Xueqyn and C. Sarah, Inhibition of protein kinase CK2 expression and activity blocks tumor growth, Mol. Cell. Biochem., 2010, 333(4), 159–167 Search PubMed.
- C. Adriana, B. Roberto, B. Andrea, C. Giorgio, Z. Samuele, P. Giorgia, M. Marco, Z. Giuseppe, U. Eugenio, G. Adriano, A. P. Lorenzo, M. Flavio and M. Stefano, Coumarin as Attractive Casein Kinase 2 (CK2) Inhibitor Scaffold: An Integrate Approach to elucidate the Putative Binding Motif and Explain Structure-Activity Relationships, J. Med. Chem., 2008, 51(4), 752–759 CrossRef PubMed.
- T. Wang, T. Nik, A. Goto, S. Ota, T. Morikawa, Y. Nakamura, E. Ohara, S. Ishikawa, H. Aburatani, J. Nakajima and M. Fukayama, Hypoxia increases the motility of lung adenocarcinoma cell line A549 via activation of the epidermal growth factor receptor pathway, Cancer Sci., 2007, 98, 506–518 CrossRef CAS PubMed.
- S. E. Schnitzer, T. Schmid, J. Zhou and B. Brüne, Hypoxia and HIF-1protect A549 cells from drug-induced apoptosis, Cell Death Differ., 2006, 13, 1611–1613 CrossRef CAS PubMed.
- N. K. Wagh, Z. Zhou, S. M. Ogbomo, W. Shi, S. K. Brusnahan and J. C. Garrison, Development of hypoxia enhanced 111In-labeled bombesin conjugates: design, synthesis and in vitro evaluation in PC-3 human prostate cancer, Bioconjugate Chem., 2012, 23, 527–537 CrossRef CAS PubMed.
- T. Nadia, M. Alfonso, C. M. Paul, L. Yuanmei, S. Andrea, D. Shoukat, W. Jean-Yves and T. S. Claudiu, Glycosyl coumarin carbonic anhydrase IX and XII inhibitors strongly attenuate the growth of primary breast tumor, J. Med. Chem., 2011, 54(24), 8271–8277 CrossRef PubMed.
- V. S. Koneni, K. Abdhesh, K. Manoj, S. Jayanta and S. Sudhir, Synthesis and in vitro evaluation of novel coumarin–chalcone hybrids as potential anticancer agents, Bioorg. Med. Chem. Lett., 2010, 20(24), 7205–7211 CrossRef PubMed.
| This journal is © The Royal Society of Chemistry 2015 |

