Fabrication and application of non-rare earth red phosphors for warm white-light-emitting diodes

Qiang Zhoua, Yayun Zhoua, Zhengliang Wang*a, Yong Liua, Guo Chena, Jinhui Penga, Jing Yanb and Mingmei Wu*b
aKey Laboratory of Comprehensive Utilization of Mineral Resource in Ethnic Regions, Joint Research Centre for International Cross-border Ethnic Regions Biomass Clean Utilization in Yunnan, School of Chemistry & Environment, Yunnan Minzu University, Kunming, 650500, P. R. China. E-mail: wangzhengliang@foxmail.com
bMOE Key Laboratory of Bioinorganic and Synthetic Chemistry, School of Chemistry and Chemical Engineering, Sun Yat-Sen (Zhongshan) University, Guangzhou, 510275, P. R. China. E-mail: ceswmm@mail.sysu.edu.cn

Received 2nd September 2015 , Accepted 25th September 2015

First published on 25th September 2015


Abstract

In this work, a facile and efficient method for the preparation of K2XF6:Mn4+ (X = Si, Ti and Ge) red phosphors is reported. They were synthesized by adding KF to precipitate a warm mixed solution with XO2, KMnO4 and HF as raw materials. After the doping of Mn4+, although the obtained products exhibit irregular micro-sized particulate morphologies, they present the same single phases as their matrices and no impurities can be found. The optical properties of the fluoride complexes were investigated using photo-luminescence spectroscopy, diffuse reflectance spectroscopy, and luminescence decay curves. The complexes presented bright red emission under blue light illumination, and warm white-light-emitting diodes with low correlated color temperature, high color rendering index and high luminous efficiency, with values of 3156 K, 84.9 and 138.4 lm W−1, respectively, were achieved by coating a mixture of the red phosphor with commercial Y3Al5O12:Ce3+ on blue-GaN chips.

Introduction

After the creative invention of efficient blue light-emitting diodes (LEDs), bright white light sources, typically white-light-emitting diodes (WLEDs), have been enabled and have received a great deal of interest from scientists and engineers due to their long lifetimes, energy-saving nature and environmentally-friendly properties.1–3 To obtain high luminous efficiency white light, nowadays WLEDs are always fabricated from the merger of yellow Y3Al5O12:Ce3+ (denoted as YAG) phosphors with blue LED chips.4,5 However, the WLEDs fabricated using this approach lack red emission in their luminescence spectra,6,7 which restricts their application in indoor lighting due to their highly correlated color temperature (CCT > 4000 K) and low color rendering index (CRI, Ra < 80).8–11 To solve this problem, significant research effort has been devoted to exploring red phosphors with high luminous efficiency. For example, rare-earth-activated sulfides and nitrides have been reported to fabricate warm WLEDs.12,13 Although these materials exhibit fascinating luminescence properties, their unstable chemical properties and harsh preparation process limit their application in WLEDs; needless to say, their broadband emission beyond 650 nm decreases their luminous efficiency and their sensitivity to the human eye.14

Recently, Mn4+ activated red fluoride phosphors have attracted significant research interest because of their d–d transition in octahedral symmetry crystal fields, which causes broadband absorption in the blue region and narrowband emission in the red region of the spectrum.15,16 As is known to all, Mn4+ is sensitive to its surrounding environment and is hard to control. Hence, different synthesis routes have been developed to prepare Mn4+ doped fluoride complexes. The group of Adachi reported a series of red fluoride phosphors, K2XF6:Mn4+ (X = Sn, Ge or Si), through a wet chemical etching route in aqueous KMnO4 and HF mixed solution.17–19 For example, a cation exchange method was proposed by the group of Chen to prepare K2TiF6:Mn4+ and K2SiF6:Mn4+ red phosphors by mixing fluoride hosts with K2MnF6 powders in HF solution.14 A co-precipitation method for the preparation of Na2SiF6:Mn4+, K2SiF6:Mn4+ and K2GeF6:Mn4+ red phosphors was established by Liu and his co-authors with the use of H2O2 as a reductant to reduce Mn7+ to Mn4+.20–22 Pan and her colleagues demonstrated a hydrothermal method for the synthesis of Mn4+ doped fluorides, such as K2SiF6:Mn4+, BaSiF6:Mn4+, BaTiF6:Mn4+ and K2TiF6:Mn4+ phosphors.23–26 In addition, in our previous work, BaGeF6:Mn4+ and Cs2TiF6:Mn4+ red phosphors were synthesized and their potential applications in WLED devices were investigated.4,27 Despite their successes, all of the approaches have some drawbacks. Specifically, the product yield of the etching technique is very low, the starting materials for the co-precipitation and cation exchange routes are either expensive or complicated to prepare, and the reaction temperature of the hydrothermal method is very high, leading to a low doping concentration of Mn4+. In other words, up to now, red fluoride phosphors have not been produced efficiently and the doping amount of Mn4+ has been hard to control. Therefore, from a practical point of view, it appears very urgent and important to develop a facile and efficient way to properly control the formation and occupation of Mn4+, while using simple raw materials.

In this paper, we will present a facile and efficient one-step precipitation method to prepare single-phase K2XF6:Mn4+ (X = Si, Ti or Ge, denoted as KXFM) red phosphors by only employing simple and commercial starting materials. The doping amount of Mn4+ can be controlled through the reaction time with an excess amount of KMnO4. The effect of the reaction time on the photo-luminescence properties of the KXFM red phosphor has been determined. All of the obtained products emit intense red emission under blue light illumination, implying that the Mn4+ doped fluoride phosphors are potential red components for warm WLEDs.

Experimental

Materials

All source materials in this work, including hydrofluoric acid, potassium permanganate, potassium fluoride, silicon oxide, titanium oxide and germanium oxide, were of analytical grade and without any purification prior to use. The commercial YAG yellow phosphor was purchased from Shenzhen Quanjing Photon Co. Ltd, China.

Synthesis

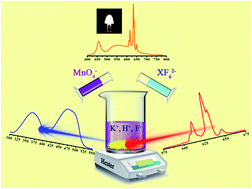
Red fluoride phosphors were synthesized via a facile one-step precipitation method with a mild heating process. In a typical synthesis, 5 mmol TiO2 (or SiO2, GeO2) was put into a plastic beaker containing 10 mL of magnetically stirred 40% HF solution until completely dissolved. Thereafter, 2 mmol KMnO4 and 16 mmol KF were added into the colorless transparent solution sequentially, and the solution was subsequently kept at 50 °C for 15 min. Then a K2TiF6:Mn4+ (KTFM) precipitate was found at the bottom of the plastic beaker. Finally, the resulting solid product was collected carefully from the plastic beaker, washed extensively with distilled water and methanol several times, and dried at 80 °C for 2 hours. A schematic diagram of this precipitation process is shown in Fig. 1.
image file: c5ra17846k-f1.tif
Fig. 1 Schematic illustration of the preparation process.

WLEDs were fabricated by coating YAG yellow phosphor with or without K2XF6:Mn4+ (X = Si, Ti and Ge) (denoted as KXFM) on GaN chips. These LEDs were operated at 5.0 V reverse voltage with a forward current of 20 mA.

Characterization

The crystal structure of the as-prepared samples was investigated using powder X-ray diffraction (XRD) with an X-ray diffractometer using Cu Kα radiation (λ = 0.15406 nm) and a graphite monochromator. The corresponding surface morphology and microstructure were observed on a scanning electron microscope (SEM, FEI Quanta 200 Thermal FE Environment scanning electron microscopy) with an attached energy-dispersive X-ray spectrometer (EDS). Compositional analysis was performed on a Shimadzu AA-6300 atomic absorption spectrophotometer (AAS). Diffuse reflectance ultraviolet-visible spectra (DRS) and decay curves were collected on a Cary 5000 UV-Vis-NIR spectrophotometer and an Edinburgh FLS920 combined fluorescence lifetime and steady state spectrometer, respectively. The photo-luminescence properties were measured on a Cary Eclipse FL1011M003 (Varian) spectrofluorometer with a xenon lamp as excitation light source. The performance of the WLEDs was investigated using a high accuracy array spectrometer (HSP6000).

Results and discussion

Mechanism, composition and morphology analysis

Previously, H2O2 was employed as a reductant to promote the reduction process of Mn7+ to Mn4+ for the preparation of Na2SiF6:Mn4+ red phosphors because of the slow redox rate between KMnO4 and HF at ambient temperature.20 In this work, a mild heat treatment at 50 °C, together with an excessive amount of KMnO4, was adopted to accelerate the formation of Mn4+, which was simultaneously coordinated with surrounding F to form stable MnF62− octahedra. Generally, because of the existence of an excess amount of KMnO4, the upper solution retained a purple color during the preparation process.

According to the experimental phenomenon of the preparation process, we presumed that the chemical stability of our KXFM products toward hydrolysis is better than that of rare-earth doped sulphides since a series of reactions occurred. Firstly, the XO2 precursor was dissolved in a colorless transparent solution at 40% HF concentration and no precipitate could be found at the bottom of the reaction beaker. The reaction formula is as follows:

XO2 + 6HF → H2XF6 + 2H2O

Because of the low solubility of K2XF6 in HF solution, when KF was put into the purple solution, K+ could substitute H+ to form K2XF6, which was precipitated from the clear solution. This precipitation reaction can be clearly observed.

2KF + H2XF6 → K2XF6↓ + 2HF

After the addition of KMnO4, Mn7+ can be transformed into Mn4+ in a concentrated HF environment. Mild heat treatment could accelerate the redox rate of this transformation process, which could be expressed as:

4KMnO4 + 4KF + 20HF → 4K2MnF6↓ + 10H2O + 3O2

As we know, the ionic radius and coordination number of Mn4+ (0.53 Å, CN = 6) in concentrated HF solution are similar to those of Si4+ (0.40 Å, CN = 6), Ti4+ (0.60 Å, CN = 6) and Ge4+ (0.53 Å, CN = 6), which is beneficial for the substitution of Mn4+ for X4+ in the XF62− group due to cation exchange between them. This is why the KXFM red phosphor can be easily produced from the clear solution using this one-step precipitation method.

(1 − x)K2XF6 + xK2MnF6 → K2X1−xMnxF6

Fig. 2 exhibits the X-ray diffraction (XRD) patterns of the obtained K2TiF6:Mn4+ (KTFM), K2GeF6:Mn4+ (KGFM) and K2SiF6:Mn4+ (KSFM) products, along with their corresponding standard diffraction cards. In curve a and b, all the diffraction peaks can be indexed to the space group P[3 with combining macron]m1 of either hexagonal K2TiF6 (JCPDS no. 73-2110, a = b = 5.715 Å and c = 4.656 Å) or K2GeF6 (JCPDS no. 07-0241, a = b = 5.632 Å and c = 4.668 Å), and no secondary impurities can be identified, indicating that both KTFM and KGFM products are single phase, and the introduction of Mn4+ does not change the crystal structure of either the K2TiF6 or K2GeF6 matrix. As illustrated above, that is because Mn4+ not only has an identical valence state, but also a similar ionic radius to both Ti4+ and Ge4+, which results in the replacement of Mn4+ at the lattice site of either Ti4+ or Ge4+ easily. Both the crystal structures of K2TiF6 and K2GeF6 are displayed in Fig. 3a and b (inset images). Each Ti4+ (or Ge4+) is coordinated with 6F to form a regular TiF62− (or GeF62−) octahedron, and K+ is at the center of 12 neighboring F. When the substitution of Mn4+ occurs, Mn4+ occupies the octahedral core site of Ti4+ (or Ge4+) to coordinate with 6F anions, forming a stable MnF62− octahedron. Similar results can be obtained from curve c of KSFM (JCPDS no. 07-0217, a = b = c = 8.133 Å) in Fig. 2 except for its crystal structure (inset of Fig. 3c). It belongs to the cubic Fm3m space group. Si4+ takes up the vertex and face-centered position of the cubic unit cell, and 4K+ ions are uniformly distributed inside the cube. Each Si4+ is surrounded by 6F to form a regular SiF62− octahedron.


image file: c5ra17846k-f2.tif
Fig. 2 Representative XRD patterns of the obtained (a) KTFM, (b) KGFM and (c) KSFM products.

image file: c5ra17846k-f3.tif
Fig. 3 The SEM images, crystal structures and representative EDS spectrum of the as-synthesized (a) KTFM, (b) KGFM and (c) KSFM products.

The representative morphology and composition results for the afore-discussed three products are displayed in Fig. 3. Obviously, the SEM image of Fig. 3a1 illustrates that the obtained KTFM product is composed of a number of irregular micro-sized particulate crystals, ranging from 5 to 50 μm, with clear edges and corners. This indicates that the KTFM product had good crystallization. The corresponding EDS spectrum exhibits the existence of F, Ti, K, and Mn elements and the absence of O, suggesting that the Mn element has been well doped into the K2TiF6 matrix and no MnO2 is produced during the entire precipitation process. This result confirmed that this precipitation method is a facile and beneficial route for the substitution of Mn4+ for Ti4+ in the matrix lattice. Moreover, the morphology results for two other products, KGFM and KSFM in Fig. 3b and c, also show a series of micro-sized particles, distributed from 10 to 30 μm (Fig. 3b) and from 5 to 10 μm (Fig. 3c) with clear particulate edges and corners.

Optical properties and application in WLEDs

The diffuse reflectance spectra (DRS) of the obtained KTFM, KGFM and KSFM products are shown in Fig. 4. Evidently, all of them revealed a similar broad absorption band around 460 nm in the blue region, with the strongest peaks located at 463, 460 and 455 nm, respectively. This is similar to the absorption properties of the Mn4+ ion-activated red fluoride phosphor, most likely originating from the spin-allowed transition of Mn4+ from ground state 4A2 to excited state 4T2. Furthermore, the strongest absorption peak position from curve a to c apparently blue shifted, which can be attributed to their different crystal field strengths. For comparison, TiF62− possesses a weaker crystal field strength than that of GeF62− and SiF62− because of the larger ionic radius of Ti4+ than Ge4+ and Si4+. TiF62− possesses the weakest crystal field strength among them, which leads to the blue shift behavior from curve a to c in Fig. 4. Actually, according to the Inorganic Crystal Structure Database (ICSD) results, the bond distances of Ti–F, Ge–F and Si–F are 1.9171, 1.7703 and 1.6829 Å (ICSD no. 24659, 24026 and 79407) respectively, which results in TiF62− possessing a weaker crystal field strength and hence a longer excitation wavelength than those of GeF62− and SiF62−. Furthermore, in Fig. 4, it can be clearly observed that the KTFM phosphor exhibits an obviously stronger absorption ability than the two others, which may lead to its better emission properties.
image file: c5ra17846k-f4.tif
Fig. 4 DRS spectra of the as-synthesized (a) KTFM, (b) KGFM and (c) KSFM products.

In order to prove the above DRS results, the photoluminescence excitation (PLE) and photoluminescence (PL) spectra of the obtained KXFM products were investigated and are shown in Fig. 5. It is clear that apart from the same broad absorption band as DRS results, the three excitation spectra still exhibit a broad absorption band in the UV region, which is due to the spin-allowed transition of Mn4+ from ground state 4A2g to excited state 4T1g. The full width at half maximum (FWHM) for KTFM, KGFM and KSFM at 460 nm are about 65, 60 and 50 nm respectively, much broader than that of blue GaN chip emission (∼20 nm). This demonstrates that the three KXFM phosphors can effectively absorb the emitted blue light from the GaN chip. The three main sharp peak lines from 600 to 650 nm strongly indicate that the emission light of these phosphors is red, and these are ascribed to the spin-forbidden d–d transition of Mn4+ between 2Eg and 4A2g. Obviously, the red emission in the PL spectra is a typical property of Mn4+ ion-activated phosphors, as reported previously.28,29 This strongly indicates that the Mn4+ ions have been doped into the K2XF6 matrices. Moreover, the red light emitted from the KTFM phosphor presents a stronger intensity than those of the two other products, which was in agreement with the DRS assumption demonstrated above.


image file: c5ra17846k-f5.tif
Fig. 5 PLE and PL spectra of (a) KTFM, (b) KGFM and (c) KSFM products with representative photographs of KTFM phosphor illuminated under UV and blue lamp respectively.

The influence of reaction time on the PL properties of the as-prepared KTFM red phosphors is shown in Fig. 6. It exhibits the emission spectra of KTFM phosphors prepared with 0.2 mol L−1 KMnO4 for 5, 10, 15, 20, 30, 60, 75 and 90 min under 460 nm blue light excitation. Evidently, these spectral shapes are similar and each of them is composed of three main sharp lines distributed in the range of 610–650 nm with the strongest peak at 631 nm. This red emission originates from the aforementioned spin-forbidden d–d transition from 2Eg to 4A2g of Mn4+.20–22 The influence of reaction time on the emission intensity of KTFM is very clear. Only reacted for 15 min, the obtained KTFM phosphor could emit the strongest red light, which further verifies that this synthesis route is efficient in fabricating Mn4+ doped red phosphor. Furthermore, no emission peak position shifts when the reaction time changes. This is because the 2Eg energy state in the d3 electronic configuration is independent of crystal field, which results in the emission transition position of 2Eg4A2g being independent of its crystal field strength. Gradually prolonging the reaction time from 15 to 90 min, the emission dropped, which definitely resulted from the concentration quenching of Mn4+ in the K2TiF6 crystal lattice.


image file: c5ra17846k-f6.tif
Fig. 6 The PL spectra of KTFM red phosphors obtained from 40% HF with different reaction times, and recorded at room temperature. Inset is the dependence of the PL intensity on reaction time.

In order to further confirm the concentration quenching phenomenon and determine the quenching concentration of Mn4+ in the K2TiF6 crystal lattice, a 68% concentrated HNO3 solution was employed to dissolve KTFM powders and atomic absorption spectrophotometry (AAS) as aforementioned in the characterization section was adopted to measure the relative concentration of Mn4+. The results are presented in Table S1. Obviously, with the extension of reaction time, the substitution amount of Mn4+ for Ti4+ in the K2TiF6 host indeed exhibits a rising tendency. According to the PL results obtained above, the product reacted for 15 min presents the strongest PL intensity, which means that the optimum doping concentration of Mn4+ in our work is 4.9%. Once more, Mn4+ ions were doped into the K2TiF6 matrix, and the PL intensity dropped contrarily, which indicated that the PL properties of the KTFM red phosphor are highly dependent on the doping amount of Mn4+. By controlling the reaction time, its PL properties can be rationally tuned. The production efficiency of K2TiF6:Mn4+ in this work as short as 15 min at 50 °C is extremely good. A quenching phenomenon also occurred in the KGFM and KSFM phosphors (Fig. S1 in ESI), and their optimum reaction times are 60 and 30 min, respectively. The dependence of the PL intensity and doping amount of the KTFM phosphor on the reaction time is shown in the inset of Fig. 6.

The influence of temperature on the PL properties of the KTFM red phosphor is shown in Fig. 7. It can be clearly observed that with the temperature increasing, the emission peak position does not shift. Up to 120 °C, nearly 139% of the integral emission intensity can be preserved, compared with that at 25 °C, which demonstrates its excellent thermal luminescent properties at high temperatures. The thermal luminescence properties of KGFM and KSFM are nearly the same as those of the KTFM phosphor (Fig. S2 in ESI). The PL decay properties of the prepared KTFM, KGFM and KSFM red phosphors were investigated at room temperature (Fig. S3 in ESI). The three PL decay curves are well fitted by a single-exponential function. Based on this characteristic, their PL lifetimes were determined as 4.7, 5.8 and 7.1 ms, respectively. This result complements the experimental data of previous reports using other preparation methods.


image file: c5ra17846k-f7.tif
Fig. 7 Temperature-dependent thermal luminescence spectra of KTFM red phosphor and the relationship between integral relative intensity and temperature.

The WLED performance of the YAG and YAG-KTFM mixture was evaluated and the difference is shown in Fig. 8. Only with the existence of YAG powders, cold bright white light was observed by the naked eye, whose electroluminescence spectrum still displays an intensive emission of GaN (∼450 nm), indicating that this kind of WLED is an appropriate acceptor for the combination of the KTFM red phosphor. After the addition of KTFM products, sharp red emission lines of Mn4+ in the EL spectrum and bright red light can be observed (Fig. 8b), which means that the addition of KTFM is favorable for the improvement of the CRI and CCT levels of the YAG type WLED. Without the use of KTFM, the CRI and CCT are 72.8 and 6315 K, respectively, while with the addition of KTFM, these data gradually change to be 84.9 and 3156 K, with an extraordinary luminous efficiency of 138.4 lm W−1 (Fig. S4 and Table S2 in ESI). The white light emitted from the YAG-KTFM system is much warmer. According to the survey of ref. 14, warm WLEDs based on the KTFM red phosphor present a luminous efficacy of 124 lm W−1 under a 20 mA drive current.14 In this work, with the same drive current, the fabricated KTFM type WLED shows a higher luminous efficacy of 138.4 lm W−1. This indicates that the KTFM red phosphor is a promising candidate for extending the current commercial WLED applications although its precipitation route is facile and efficient. The performance of other WLEDs is summarized in Fig. S5 and Table S2 in the ESI.


image file: c5ra17846k-f8.tif
Fig. 8 Electroluminescence spectra and corresponding bright white light images of the WLEDs fabricated (a) without and (b) with K2TiF6:Mn4+ red phosphor evaluated with a 20 mA forward current.

Conclusions

In this work, we have reported a facile and efficient precipitation route with very simple starting materials to fabricate phase-pure fluoride K2XF6:Mn4+ (X = Si, Ti and Ge) red phosphors without any impurities. The as-prepared products can absorb broadband blue light and emit intense bright narrowband red light. Their PL intensity can reach its highest value even if a short reaction period is employed. With the use of these Mn4+ doped fluoride red phosphors in WLED devices, obvious improvements in CRI and CCT data (Ra = 84.9 and CCT = 3156 K) have been achieved, whilst retaining an extraordinary luminous efficiency of 138.4 lm W−1. A simple preparation process and efficient red luminescence under blue light excitation make this precipitation approach an efficient and general way to prepare K2XF6:Mn4+ as promising phosphors.

Acknowledgements

This work was financially supported by the National Natural Science Foundation of China, the Natural Science Foundation of Yunnan Province (Grants 21261027 and 2014FB147), the Joint Funds of the National Natural Science Foundation of China and Guangdong Province, the Research Fund for the Doctoral Program of Higher Education of China, and Guangdong Province for industrial applications of rare earth materials (Grants U1301242, 20130171130001, and 2012B09000026).

References

  1. W. T. Chen, H. S. Shen, R. S. Liu and J. P. Attfield, J. Am. Chem. Soc., 2012, 134, 8022 CrossRef CAS PubMed.
  2. I. Ahemen, K. DeDilip and A. N. Amah, Appl. Phys. Res., 2014, 6, 95 Search PubMed.
  3. M. H. Chang, D. Das, P. V. Varde and M. Pecht, Microelectron. Reliab., 2012, 52, 762 CrossRef PubMed.
  4. Q. Zhou, Y. Y. Zhou, Y. Liu, L. J. Luo, Z. L. Wang, J. H. Peng, J. Yan and M. M. Wu, J. Mater. Chem. C, 2015, 3, 3055 RSC.
  5. C. C. Lin and R. S. Liu, J. Phys. Chem. Lett., 2011, 2, 1268 CrossRef CAS PubMed.
  6. P. Pust, V. Weiler, C. Hecht, A. Tucks, A. S. Wochnik, A. K. Hen, D. Wiechert, C. Scheu, P. J. Schmidt and W. Schnick, Nat. Mater., 2014, 13, 891 CrossRef CAS PubMed.
  7. P. H. Chuang, C. C. Lin, H. Yang and R. S. Liu, J. Chin. Chem. Soc., 2013, 60, 801 CrossRef CAS PubMed.
  8. P. Schlotter, R. Schmidt and J. Schneider, Appl. Phys. A: Mater. Sci. Process., 1997, 64, 417 CrossRef CAS.
  9. T. S. Chan, R. S. Liu and I. Baginskiy, Chem. Mater., 2008, 20, 1215 CrossRef CAS.
  10. R. Zhang, H. Lin, Y. L. Yu, D. Q. Chen, J. Xu and Y. S. Wang, Laser Photonics Rev., 2014, 8, 158 CrossRef CAS PubMed.
  11. G. G. Li, D. L. Geng, M. M. Shang, C. Peng, Z. Y. Cheng and J. Lin, J. Mater. Chem., 2011, 21, 13334 RSC.
  12. C. F. Guo, D. X. Huang and Q. Su, Mater. Sci. Eng., B, 2006, 130, 189 CrossRef CAS PubMed.
  13. X. X. Duan, S. H. Huang, F. T. You and K. Kang, J. Rare Earths, 2009, 27, 43 CrossRef.
  14. H. M. Zhu, C. C. Lin, W. Q. Luo, S. T. Shu, Z. G. Liu, Y. S. Liu, J. T. Kong, E. Ma, Y. G. Cao, R. S. Liu and X. Y. Chen, Nat. Commun., 2014, 5, 4312 CAS.
  15. Y. K. Xu and S. Adachi, J. Appl. Phys., 2009, 105, 013525 CrossRef PubMed.
  16. C. X. Liao, R. P. Cao, Z. J. Ma, Y. Li, G. P. Dong, K. N. Sharafudeen and J. R. Qiu, J. Am. Ceram. Soc., 2013, 96, 3552 CrossRef CAS PubMed.
  17. Y. Arai, T. Takahashi and S. Adachi, Opt. Mater., 2010, 32, 1095 CrossRef CAS PubMed.
  18. S. Adachi and T. Takahashi, J. Appl. Phys., 2009, 106, 013516 CrossRef PubMed.
  19. S. Adachi and T. Takahashi, J. Appl. Phys., 2008, 104, 023512 CrossRef PubMed.
  20. H. D. Nguyen, C. C. Lin, M. H. Fang and R. S. Liu, J. Mater. Chem. C, 2014, 2, 10268 RSC.
  21. L. L. Wei, C. C. Lin, M. H. Fang, M. G. Brik, S. F. Hu, H. Jiao and R. S. Liu, J. Mater. Chem. C, 2015, 3, 1655 RSC.
  22. L. L. Wei, C. C. Lin, Y. Y. Wang, M. H. Fang, H. Jiao and R. S. Liu, ACS Appl. Mater. Interfaces, 2015, 7, 10656 CAS.
  23. L. F. Lv, X. Y. Jiang, S. M. Huang, X. A. Chen and Y. X. Pan, J. Mater. Chem. C, 2014, 2, 3879 RSC.
  24. X. Y. Jiang, Y. X. Pan, S. M. Huang, X. A. Chen, J. G. Wang and G. K. Liu, J. Mater. Chem. C, 2014, 2, 2301 RSC.
  25. X. Y. Jiang, Z. Chen, S. M. Huang, J. G. Wang and Y. X. Pan, Dalton Trans., 2014, 43, 9414 RSC.
  26. L. L. Lv, Z. Chen, G. K. Liu, S. M. Huang and Y. X. Pan, J. Mater. Chem. C, 2015, 3, 1935 RSC.
  27. Q. Zhou, Y. Y. Zhou, Y. Liu, Z. L. Wang, G. Chen, J. H. Peng, J. Yan and M. M. Wu, J. Mater. Chem. C, 2015, 3, 9615 RSC.
  28. J. H. Oh, H. Kang, Y. J. Eo, H. K. Park and Y. R. Do, J. Mater. Chem. C, 2015, 3, 607 RSC.
  29. T. N. Ye, S. Li, X. Y. Wu, M. Xu, X. Wei, K. X. Wang, H. L. Bao, J. Q. Wang and J. S. Chen, J. Mater. Chem. C, 2013, 1, 4327 RSC.

Footnote

Electronic supplementary information (ESI) available: Details of the relationship between reaction time and PL properties of the obtained K2GeF6:Mn4+ and K2SiF6:Mn4+ red phosphors, as well as the AAS results for K2TiF6:Mn4+ and the WLED performance and corresponding CIE chromaticity diagram data. See DOI: 10.1039/c5ra17846k

This journal is © The Royal Society of Chemistry 2015
Click here to see how this site uses Cookies. View our privacy policy here.