Moolchand Kurmi,
Vijaya Madhyanapu Golla,
Sanjay Kumar,
Archana Sahu and
Saranjit Singh*
Department of Pharmaceutical Analysis, National Institute of Pharmaceutical Education and Research (NIPER), Sector 67, S.A.S. Nagar 160 062, Punjab, India. E-mail: ssingh@niper.ac.in; Fax: +91 172 2214692; Tel: +91 172 2214682
First published on 3rd November 2015
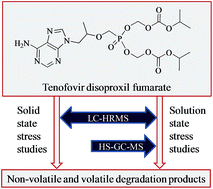
Tenofovir disoproxil fumarate (TDF), an antiretroviral drug, was evaluated for its degradation behaviour in solid and solution states. A total of twelve non-volatile degradation products were formed, which were separated on a C18 column in a gradient mode, using methanol and ammonium formate in the mobile phase. The same method was extended to liquid chromatography-high resolution mass spectrometry (LC-HRMS). First a comprehensive mass fragmentation pattern of the drug was established by direct injection and collection of HRMS and multi-stage tandem mass spectrometric (MSn) data. Then LC-HRMS studies were carried on the stability samples containing the degradation products. Also headspace gas chromatography-mass spectrometry (HS-GC-MS) studies were conducted to explore the formation of volatile components. The collated information was utilized for the characterization of all non-volatile and volatile degradation products. Eventually, the degradation pathway of the drug was established under the investigated conditions.
We have recently undertaken a project in our laboratory to carry out molecular level studies to delineate intrinsic stability behaviour of antiretroviral drugs alone and when present in combination formulations. The aim is to make available this vital pre-formulation information on antiretroviral drugs to formulation scientists as part of the QbD knowledge space. The drugs selected for the studies were tenofovir disoproxil fumarate (TDF), lamivudine (3TC), emtricitabine (FTC), zidovudine (AZT), stavudine (d4T), abacavir (ABC), efavirenz (EFV) and nevirapine (NVP), along with their marketed combinations.
This first part of the series reports intrinsic degradation behaviour of TDF (9-[(R)-2-[[bis[[(isopropoxycarbonyl)oxy] methoxy]phosphinyl]-methoxy]propyl]adenine fumarate). TDF is a reverse transcriptase inhibitor, which is used for the treatment of HIV and chronic hepatitis B.1,2 It is known to degrade via two interrelated mechanisms.3,4 The first is dismembering of isoproxil moieties, leading to formation of formaldehyde (HCHO). The second is formation of the methylene linked dimer of TDF. A few of impurities are also named in compendial monographs, e.g., United States Pharmacopeia (USP) pending monograph mentions control of tenofovir, tenofovir isoproxil monoester and tenofovir disoproxil dimer.5 The latter two, tenofovir monosoproxil dimer as well as tenofovir di- and monosoproxil heterodimer are listed in monograph on the drug in the World Health Organization's International Pharmacopoeia (Ph. Int.).6 Recently, a study reported two alkaline degradation products of TDF, viz., methyl hydrogen ({[1-(6-amino-9H-purin-9-yl)-propan-2-yl]oxy}methyl) phosphonate and dimethyl({[1-(6-amino-9H-purin-9-yl)propan-2-yl]oxy} methyl)phosphonate.7 Some other studies are available on degradation behaviour of the drug, but these are limited to solution state, and structures of the degradation products were also not elucidated.8–13
To best of our knowledge, no comprehensive report exists on solid as well as solution state degradation behaviour of TDF, which includes characterization of its all degradation products. In this paper, we provide information on mass fragmentation profile, degradation behaviour, structures of non-volatile and volatile degradation products, and degradation pathway of the drug. The study was accomplished using sophisticated instrumental techniques, viz., liquid chromatography-high resolution mass spectrometry (LC-HRMS), multi stage tandem mass spectrometry (MSn), and headspace gas chromatography-mass spectrometry (HS-GC-MS).14
HPLC studies were carried out on LC-2010 HT liquid chromatograph (Shimadzu, Kyoto, Japan), which was equipped with a SPD-M20A prominence diode array detector. LC column used was Pursuit XRs 5 C18 250 × 4.6 mm (Varian Inc., Lake Forest, CA, USA).
LC-HRMS studies were carried out using LC-ESI-Q-TOF-MS, in which LC part consisted of 1100 series HPLC (Agilent Technologies, Waldbronn, Germany) comprising of an on-line degasser (G1379A), binary pump (G1312A), auto injector (G1313A), column oven (G1316A) and PDA detector (G1315B). The MS system consisted of MicrOTOF-Q spectrometer (Bruker Daltonics, Bremen, Germany). System control and data acquisition were done by Hystar software (version 3.1) from the same source. The calibration solution used was 5 mM sodium formate. LTQ-XL-MS 2.5.0 (Thermo, San Jose, CA, USA) mass spectrometer was used for tandem mass experiments. The mass spectra were acquired and processed using Xcalibur software (version 2.0.7 SP1).
HS-GC-MS system consisted of HS sampler (TurboMatrix 16), GC (Clarus 600) and MS (Clarus 600C). The three were controlled using TurboMass (version 5.4.2) software (PerkinElmer Inc., Shelton, CT, USA). The GC column used for the analysis of samples was Elite-5MS, 30 m, 0.25 mm ID, 0.25 μm df.
pH/Ion analyzer (PB-11 235, sartorius, Goettingen, Germany) was used to check the pH of all solutions. Other equipments used were sonicator (3210, Branson Ultrasonics Corporation, Danbury, CT, USA), precision analytical balance (AG 135, Mettler Toledo, Schwerzenbach, Switzerland) and auto pipettes (Eppendorf, Hamburg, Germany).
:
stressor ratio was fixed as 1
:
2. The powders were mixed thoroughly in the vial with the help of a spatula. The first set (all three subsets) contained drug and stressors along with 50 μl H2O in closed vials, and was stored in accelerated stability test chamber for 1 month. The second set (three subsets) was exposed to accelerated stability condition of 40 °C/75% RH for 3 months. The third set containing drug alone was kept at 60 °C and subjected to thermal exposure for 1 month. Similarly, in the fourth set, the drug was charged to the photostability chamber and exposed for sufficient duration so as to provide a total dose of 6 million lux h cool white light and 1193 W h m−2 near-UV. After completion of the study period of all the sets, the samples were withdrawn, and were monitored for chemical changes through HPLC. Samples for HPLC analyses were prepared in water, and had concentration of 2 mg ml−1. HPLC method was optimized to provide clear picture on generation of the new degradation products. The developed method involved mobile phase composed of methanol (A) and 10 mM ammonium formate (pH 3.75) (B) in a gradient mode (Tmin/B; T0/95; T5/95; T50/10; T55/95; T62/95). The column oven temperature was maintained at 30 °C during analysis, while detection wavelength, flow rate and injection volume were 254 nm, 1 ml min−1 and 5 μl respectively.
For the analysis of volatile degradation products, 2 ml of 10 mg ml−1 drug solutions in water and CH3OH
:
H2O (50
:
50 v/v) were stressed in 22 ml crimp top sealed glass vials. The temperature was set at 80 °C, and monitored for 15 h. HS-GC parameters were optimized with helium as a carrier gas. The optimized column oven temperature program was: Tmin/°C; T0/40; T30/240; T40/240. All samples were injected through HS sampler with a split ratio of 5. The injector, HS oven, HS transfer line and HS needle temperature were set at 140, 80, 120, and 90 °C, respectively. Thermostat, withdraw and inject time were fixed at 15, 0.5 and 0.04 min, respectively. The mass spectrometer was operated in electron impact ionization mode (EI, 70 eV) in the mass range of m/z 25–600. GC-MS interface and ion-trap temperatures were 270 and 170 °C, respectively.
| MSn | Precursor ion | Product ion(s) |
|---|---|---|
| a Ions were not captured for further MSn studies. | ||
| MS2 | 520 | 490, 476, 448, 446, 416, 404, 386, 374, 344, 342, 330, 312, 300, 288, 282, 270, 240, 206, 176a |
| MS3 | 490 | 446, 404, 386, 374, 344, 330, 300, 288 |
| 476 | 446, 330, 288 | |
| 448 | 404, 288 | |
| 416 | 386, 342, 300, 270 | |
| 312 | 270 | |
| 282 | 252 | |
| 240 | 176a | |
| 206 | 176a | |
| MS4 | 446 | 404, 374, 342, 330, 312, 300, 288 |
| 386 | 344, 300 | |
| 270 | 288, 252, 240, 206, 176a | |
| MS5 | 404 | 374, 330, 288, 270 |
| 344 | 300 | |
| 342 | 300 | |
| 252 | 136a | |
| MS6 | 374 | 330 |
| 330 | 312, 288 | |
| 300 | 288, 282, 270 | |
| MS7 | 288 | 270, 240, 206, 176a, 136a |
| Peak | Accurate mass | Best possible molecular formula | Exact mass | Error (mmu) | RDB | Precursor ion | Loss from precursor ion | Molecular formula for loss |
|---|---|---|---|---|---|---|---|---|
| [TDF + H]+ | 520.1811 | C19H31N5O10P+ | 520.1803 | 0.8 | 7.5 | |||
| a | 490.1692 | C18H29N5O9P+ | 490.1697 | −0.5 | 7.5 | [TDF + H]+ | 30.0119 | CH2O |
| b | 446.1811 | C17H29N5O7P+ | 446.1799 | 1.2 | 6.5 | a | 43.9881 | CO2 |
| c | 416.1350 | C15H23N5O7P+ | 416.1330 | 2.0 | 7.5 | [TDF + H]+ | 104.0461 | C4H8O3 |
| d | 404.1347 | C14H23N5O7P+ | 404.1330 | 1.7 | 6.5 | b | 42.0464 | C3H6 |
| e | 386.1244 | C14H21N5O6P+ | 386.1224 | 2.0 | 7.5 | a | 104.0448 | C4H803 |
| c | 30.0106 | CH2O | ||||||
| f | 374.1241 | C13H21N5O6P+ | 374.1224 | 1.7 | 6.5 | d | 30.0106 | CH2O |
| g | 344.0774 | C11H15N5O6P+ | 344.0754 | 2.0 | 7.5 | e | 42.0470 | C3H6 |
| h | 342.1340 | C13H21N5O4P+ | 342.1326 | 1.4 | 6.5 | b | 104.0471 | C4H8O3 |
| c | 74.0010 | C2H2O3 | ||||||
| i | 330.1342 | C12H21N5O4P+ | 330.1326 | 1.6 | 5.5 | f | 43.9899 | CO2 |
| j | 312.1235 | C12H19N5O3P+ | 312.1220 | 1.5 | 6.5 | i | 18.0107 | H2O |
| k | 300.0877 | C10H15N5O4P+ | 300.0856 | 2.1 | 6.5 | g | 43.9897 | CO2 |
| h | 42.0463 | C3H6 | ||||||
| l | 288.0874 | C9H15N5O4P+ | 288.0856 | 1.8 | 5.5 | i | 42.0468 | C3H6 |
| m | 282.0817 | C10H13N5O3P+ | 282.0751 | 6.6 | 7.5 | k | 18.0060 | H2O |
| n | 270.0774 | C9H13N5O3P+ | 270.0751 | 2.3 | 6.5 | j | 42.0461 | C3H6 |
| k | 30.0103 | CH2O | ||||||
| l | 18.0100 | H2O | ||||||
| o | 252.0650 | C9H11N5O2P+ | 252.0645 | 0.5 | 7.5 | m | 30.0167 | CH2O |
| n | 18.0124 | H2O | ||||||
| p | 240.0671 | C8H11N5O2P+ | 240.0645 | 2.6 | 6.5 | n | 30.0103 | CH2O |
| q | 206.1065 | C9H12N5O+ | 206.1036 | 2.9 | 6.5 | n | 63.9709 | HO2P |
| r | 176.0966 | C8H10N5+ | 176.0931 | 3.5 | 6.5 | p | 63.9705 | HO2P |
| q | 30.0099 | CH2O |
The parent of m/z 520, on collision-induced dissociation (CID), fragmented via four routes involving loss of CH2O, CO2, C4H8O and C4H8O3, resulting into the product ions of m/z 490, 476, 448 and 416, respectively. The precursors of m/z 490 and 476, on MS3 CID, fragmented into common ion of m/z 446 on loss of CO2 and CH2O, respectively. The product ions of m/z 448 and 446 further dissociated into a common fragment of m/z 404 upon neutral loss of CO2 and C3H6, respectively. The precursor of m/z 490 also reduced into fragment ion of m/z 386 (loss of C4H8O3), which was also formed from m/z 416 on loss of CH2O. The fragment of m/z 416, in parallel, reduced to ion of m/z 342 on loss of C2H2O3, which was also formed from m/z 446 on loss of C4H8O3. The precursor of m/z 386 dissociated into ion of m/z 344 on loss of C3H6. The latter, and also product ion of m/z 342, reduced into a common product ion of m/z 300 on loss of CO2 and C3H6, respectively. The fragment of m/z 374 (loss of CH2O) was generated from the parent ion of m/z 404, which further formed ion of m/z 330 (loss of CO2). The latter dissociated into fragments of m/z 312 (loss of H2O) and 288 (loss of C3H6), and both were further reduced into a common product ion of m/z 270 on loss of C3H6 and H2O, respectively. The precursor of m/z 300 was also reduced into ions of m/z 282 (loss of H2O) and 270 (loss of CH2O) that were further converted to a common fragment of m/z 252 on loss of CH2O and H2O, respectively. An interesting observation was formation of a higher mass product ion of m/z 288 from m/z 270 on addition of H2O. The ion of m/z 288 was incidentally also a degradation product T1, as described later. The ion of m/z 270 further yielded fragments of m/z 240 (on loss of CH2O) and 206 (on loss of HO2P). The latter two reduced to a common product ion of m/z 176 on loss of HO2P and CH2O, respectively. Finally, the precursor of m/z 252 resulted in product ion of m/z 136 on loss of C4H5O2P.
The whole fragmentation pattern showed multiple unusual losses of CH2O, CO2 and C2H2O3. The unusual loss of CH2O was observed from the drug and its fragments of m/z 476, 416, 404, and 270, while the unusual loss of CO2 was showed by the drug and precursor ions of m/z 490 and 374. The fragment of m/z 416 showed unusual loss of C2H2O3. Among these unusual gas phase transitions, loss of CH2O is reported in the case of adefovir, which is a congener of TDF.19 We anticipate that the two losses of CO2 and C2H2O3 follow a similar mechanism involving attachment of isopropyl alcohol to the cleavage site generated subsequent to loss of the mentioned moiety.
![]() | ||
| Fig. 3 Chromatograms showing degradation products of tenofovir disoproxil fumarate (TDF) formed under different solid state conditions. | ||
![]() | ||
| Fig. 4 Chromatograms showing degradation products of tenofovir disoproxil fumarate (TDF) formed under different solution state conditions. | ||
![]() | ||
| Fig. 5 LC-HRMS line spectra of degradation products T1–T12 (a–l) of tenofovir disoproxil fumarate (TDF) formed on stressing the drug in solid and solution states. | ||
| [DP + H]+ | Accurate mass | Molecular formula | Exact mass | Error (mmu) | Accurate mass of fragments |
|---|---|---|---|---|---|
| a DP, degradation product. | |||||
| [T1 + H]+ | 288.0818 | C9H15N5O4P+ | 288.0856 | −3.8 | 270.0699, 240.0615, 206.1044, 176.0960 |
| [T2 + H]+ | 300.0803 | C10H15N5O4P+ | 300.0856 | −5.3 | 288.0815, 282.0677, 270.0692 |
| [T3 + H]+ | 557.1521 | C18H27N10O7P2+ | 557.1534 | −1.3 | 288.0823, 270.0739, 240.0619, 206.0995 |
| [T4 + H]+ | 587.1612 | C19H29N10O8P2+ | 587.1640 | −2.8 | 557.1508, 300.0849, 288.0812, 270.0723, 240.0564, 206.1061 |
| [T5 + H]+ | 587.1593 | C19H29N10O8P2+ | 587.1640 | −4.7 | 300.0823, 288.0813, 282.0774, 270.746 |
| [T6 + H]+ | 404.1354 | C14H23N5O7P+ | 404.1330 | 2.4 | 374.1210, 330.1307, 288.0857, 270.0772, 206.1062 |
| [T7 + H]+ | 416.1333 | C15H23N5O7P+ | 416.1330 | 0.3 | 386.1219, 342.1294, 314.0972, 300.0827, 282.0716 |
| [T8 + H]+ | 819.2546 | C29H45N10O14P2+ | 819.2586 | −4.0 | 685.1968, 569.1475, 416.1333, 404.1317, 352.1139, 343.0986, 330.1269, 315.1042, 300.0821, 294.0833, 288.0814, 285.0762, 282.0711, 270.0674 |
| [T9 + H]+ | 490.1666 | C18H29N5O9P+ | 490.1697 | −3.1 | 460.1561, 430.1087, 374.1169, 356.1085, 314.0601, 288.0807, 270.0700 |
| [T10 + H]+ | 610.2103 | C22H37N5O13P+ | 610.2120 | −1.7 | 592.1980, 532.1789, 494.1619, 476.1511, 378.1125, 360.1029 |
| [T11 + H]+ | 935.3023 | C34H53N10O17P2+ | 935.3060 | −3.7 | 819.2608, 685.1987, 611.1977, 587.1630, 569.1533, 554.1609, 542.1609, 532.1786, 520.1797, 468.1523, 416.1324, 410.1315, 404.1328, 373.1328, 352.1065, 343.1031, 336.1251, 330.1303, 315.1053, 306.1001, 300.0815, 294.0827, 288.0830, 285.0778, 282.0725, 270.0707 |
| [T12 + H]+ | 1051.3457 | C39H61N10O20P2+ | 1051.3533 | −7.6 | 935.3015, 861.3091, 819.2549, 745.2693, 685.1980, 629.2188, 611.2003, 587.1586, 569.1565, 554.1646, 542.1622, 532.1793, 526.1779, 520.1794, 468.1543, 446.1750, 431.1517, 416.1305, 410.1318, 404.1320, 401.1283, 373.1293, 352.1069, 343.1020, 336.1275, 330.1304, 315.1060, 306.1003, 300.0815, 294.0823, 288.0834, 285.0786, 282.0726, 270.0722 |
![]() | ||
| Fig. 6 Structures and fragmentation behaviour of degradation products T2, T5–T8, T11 and T12. See Fig. 2 for the structures of fragments not shown in this figure. The structures of degradation products are shown in solid boxes. | ||
The common fragmentation pattern of both degradation products is shown in Fig. 7. The parent of m/z 557 reduced to product ion of m/z 288 (loss of C9H12N5O3P) and 270 (loss of C9H14N5O4P). Direct formation of these two fragments indicated that the parent was formed due to addition of two tenofovir molecules after loss of water. The molecular ion of T4 fragmented into product ions of m/z 557, 300 and 288 on the neutral loss of CH2O, C9H14N5O4P and C10H14N5O4P, respectively. The loss of CH2O meant that methylene was attached with oxygen (different from T5). The fragment of m/z 288 further dissociated into fragment of m/z 270 on loss of H2O, the same product ion as in T3. The latter in both cases underwent loss of CH2O and HO2P and generated fragment ions of m/z 240 and 206, respectively. These latter two on loss of HO2P and CH2O reduced into a common product ion of m/z 176. Based on these observations, the structures of T3 and T4 were proposed as bis((1-(6-amino-9H-purin-9-yl)propan-2-yloxy)methyl) pyrophos-phonic acid, and (1-(6-((((1-(6-amino-9H-purin-9-yl) propan-2-yloxy)methyl) (hydroxy)phosphoryloxy)methylamino)-9H-purin-9-yl)propan-2-yloxy)methylphosphonic acid, respectively.
![]() | ||
| Fig. 7 Fragmentation behaviour of degradation products T3 and T4. See Fig. 2 for missing structures here. The structures of degradation products are shown in solid boxes. | ||
![]() | ||
| Fig. 10 Fragmentation behaviour of degradation product T9. For missing structures see Fig. 2. The structure of degradation product is shown in the solid box. | ||
The released formaldehyde formed imine via Schiff base mechanism and resulted in degradation products T2, T7 and an intermediate20 (shown in dotted box in Fig. 12, Scheme A). The latter combined with oxydimethanol (formed on interaction of two molecules of formaldehyde with water21,22) resulted in formation of the degradation product T10. The imine moiety of T2 interacted with phosphonic acid and amino groups of T1, resulting in T4 and T5, respectively. Also, the imine moiety of T7 on interaction with free amino group of T6 resulted in T8. T12 was generated from combination of imine intermediate and TDF, which on hydrolysis of one of isoproxil moiety resulted in T11. T11 could also form via two other routes, viz., (1) combination of T7 and TDF and (2) T6 and imine intermediate.
:
H2O, 60
:
40 v/v), degradation products T1, T2, T3, T4 and T5 showed two peaks (Fig. S2†), which had similar mass and UV spectrum in each case. The presence of CH3OH (CH3OH
:
H2O, 60
:
40 v/v), resulted in the formation of two products, which were detected during LC-HRMS studies (Fig. S3a and b†) and had mass of m/z 302.0994 and 316.1153 (Fig. S3c and d†). These two were characterized to be methyl esters of tenofovir (Fig. S3e†), formed in the presence of methanol. The same structures have erroneously been reported by Anandgaonkar et. al.7 as degradation products of TDF which in fact should only be considered as interaction products of drug base with the solvent.
![]() | ||
Fig. 13 GC chromatograms showing volatile components of tenofovir disoproxil fumarate (TDF) in H2O (a) and CH3OH : H2O (50 : 50 v/v) (b). | ||
![]() | ||
| Fig. 14 EI mass spectra of volatile components VT1 (a), VT2 (b) and VT3 (c) along with their structures and fragmentation pattern. | ||
Because formaldehyde was responsible for formation of most of the non-volatile degradation products, a study was hence carried out to confirm its presence. For the same, CH3OH
:
H2O (50
:
50, v/v) was deliberately used as a solvent, as it is known that methanolic solution of formaldehyde has the tendency to convert into hemiformal and poly(oxymethylene) hemiformal.22,23 The presence of these were looked into by conducting another HS-GC-MS run on the methanolic sample solution. Practically, two peaks in addition to methanol were seen in the chromatogram, labelled as VT2 and VT3 in Fig. 13b. However, their masses of 76 Da (Fig. 14b) and 106 Da (Fig. 14c) did not match hemiformal or poly(oxymethylene) hemiformal. The fragmentation behaviour of VT2 and VT3 involved the routes m/z 76 → 75 (loss of H radical) → 45 (loss of CH2O) → 29 (loss of CH4) and m/z 106→105 (loss of H radical) → 75 (loss of CH2O) → 59 (loss of CH4), 45 (loss of CH2O) → 29 (loss of CH4), respectively. The two were instead identified as dimethoxymethane and methoxy(methoxymethoxy)methane. Fig. 15 describes the pathway of their formation involving interaction of one and two molecules of formaldehyde with one molecule of methanol to yield initially hemiformal and di(oxymethylene) hemiformal, which further interacted with another molecule of methanol and loss of water resulting in VT2 and VT3, respectively.
Footnote |
| † Electronic supplementary information (ESI) available. See DOI: 10.1039/c5ra17532a |
| This journal is © The Royal Society of Chemistry 2015 |