DOI:
10.1039/C5RA17452J
(Paper)
RSC Adv., 2015,
5, 78614-78624
Functionalized Fe3O4 nanoparticles: influence of ligand addition sequence and pH during their continuous hydrothermal synthesis†
Received
28th August 2015
, Accepted 7th September 2015
First published on 8th September 2015
Abstract
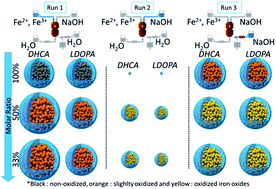
In this study we report various new efficient ways to synthesize and modify in situ magnetite (Fe3O4) iron oxide nanoparticles (NPs). Thanks to an apparatus especially developed for this new method of grafting, the NPs have been synthesized and functionalized by 3,4-dihydroxyhydrocinnamic acid (DHCA) or 3,4-dihydroxy-L-phenylalanine (LDOPA) in one step and under hydrothermal conditions using varying concentration ratios ([organic molecules]/[ferrous and ferric ions]). The organic molecules were added before or after the NP synthesis. The addition of these organic molecules modifies the structure, the morphology, the oxidation degree and the growth of the crystallites. Adding the organic molecules before the synthesis step and under acidic conditions increases the average crystallite size and prevents further oxidation whereas under basic conditions the growth is stopped but a partial oxidation of magnetite to maghemite NPs is observed. Adding DHCA or LDOPA after the synthesis step results in a modification of the lattice structure and oxidation degree of the NPs but does not change the average size. This study underlines the importance of the sequence of the addition of organic molecules on the synthesis of NPs.
Introduction
Iron oxide NPs are widely used in the industrial and biological domains due to their magnetic properties.1,2 They are attractive due to their superparamagnetic behavior for sizes less than approximatively 20 nm.3,4 Thanks to their chemical and physical properties such NPs are used in the biomedical domains in particular for targeting, imaging (MRI: Magnetic Resonance Imaging) and therapy.5–7
Various methods exist to prepare iron oxides NPs such as thermal decomposition,8 co-precipitation9 and hydrothermal synthesis under subcritical or supercritical conditions.10–14 In particular hydrothermal continuous processes allow a large productivity and a good control of the size and shape distributions of the NPs.15–17 Moreover iron oxide NPs can be synthesized and coated by organic molecules in one step in order to improve their size and their biocompatibility.11,16,18 Lately some studies have shown the interest of organic molecules such as citric acid, DHCA, or clickable anchors like 5-hexynoic or 10-undecynoic acid to control and modify the size and the biocompatibility of the NPs to make them suitable for application in the biomedical and imaging domains.14,16,19
Under hydrothermal conditions, a basic pH is required in order to synthesize magnetite by the coprecipitation of ferrous and ferric ions.20–22 In such conditions the grafting of organic molecules may be difficult. Indeed, grafting may require either an acidic or a basic pH.23 It is therefore necessary to adjust the pH in order to optimize the grafting on the surface of the iron oxide NPs.
To the best of our knowledge, no previous study tried to assess the importance of the sequence of addition of catechol ligands on the hydrothermal synthesis of oxide NPs. The sequence of additions of other ligands has already been studied for instance in the case of FePt NPs synthesized via thermal decomposition in a batch reactor24 (oleylamine and oleic acid) or in the case of iron oxide NPs (with hexanoic acid, 5-hexynoic acid or 10-undecynoic acid) synthesized near-critical and supercritical water.25 In this work, our synthesis setup has been modified to this end. A new input has been added after the reactor. We report the grafting of DHCA and LDOPA on iron oxide NPs with a continuous hydrothermal process and explore the effects of the mixing conditions (sequence of the mixing step (pH) and concentrations).26 These agents may be added with the metallic precursors or with the NaOH solution (before the synthesis step in both cases) or immediately after the formation of the iron oxide NPs thanks to this process. This study highlights how the mixing conditions modify the crystallite size, the anchoring and the oxidation degree of iron oxides. Controlling all these parameters would be difficult to achieve in a batch reactor.
Experimental
Chemicals
Iron(III) sulfate (97%), ammonium iron(II) sulfate hexahydrate (99%), sodium hydroxide (99%), LDOPA (98%) and DHCA (98%) were purchased from Sigma Aldrich. Demineralized water (σ = 2.2 μS cm−1) has been used for the hydrothermal synthesis.
Magnetite nanoparticles synthesis
The hydrothermal continuous process is presented in Fig. 1. The reactor is described in details elsewhere.26,27 However, the process has been recently modified in order to optimize and improve the coating of NPs by organic molecules (see run type 3 thereafter). At ambient temperature, ferrous and ferric metal salts in an aqueous medium with a 1
:
2 molar ratio (8 mM and 16 mM respectively, HPP 1) and a NaOH solution (33 mM) (HPP 2) are introduced in the countercurrent reactor as well as preheated demineralized water (HPP 3). The temperature is monitored and controlled by several thermocouples and furnaces. Pressure is regulated and kept constant in the whole apparatus thanks to a back pressure regulator located at the outlet. The organic modifiers (a = LDOPA or DHCA) are added in three different ways (run types 1, 2 or 3) and three molar ratios (b = [organic molecule]/[Fe2+ + Fe3+] = 0, 33, 50 or 100%). Experiments are noted run{1/a/b} if the organic modifier is added with the metallic salt precursors, run{2/a/b} if the organic modifier is added in the NaOH solution before the synthesis step and run{3/a/b} if the organic modifier is introduced at the outlet of the reactor with the NaOH solution (33 mM) via HPP 4. NaOH is used to deprotonate the functional groups of the organic molecules. All experiments were carried out at 150 °C and 250 bar with a total flow rate of 80 mL min−1 (4 × 20 mL min−1). The suspension is quickly cooled down to room temperature thanks to a cooling bath in order to stop the growth of the NPs. The synthesis lasts 11 seconds. The solid products are isolated by centrifugation (24
400g, 15
000 rpm during 10 min) and washed by dialysis (Cellu·Sep® tubular membranes of 3500 Da) until the dielectric constant is 2.2 μS cm−1. Samples are then freeze-dried in order to obtain powders for subsequent analyses.
 |
| Fig. 1 Diagram of the experimental set-up for the continuous hydrothermal synthesis of iron oxide NPs functionalized with LDOPA or DHCA (HPP: High Pressure Pump, red ball: O, black ball: C, white ball: H, green ball: N). | |
XRD measurements
Powder X-ray Diffraction (XRD) patterns were collected using a Bruker D8 Advance diffractometer and the Cu Kα1,2 radiations (λα1 = 1.540598 Å and λα2 = 1.544426 Å). Scans were measured over the 25–65° 2θ range with a step of 0.026° and a scan speed of 52 seconds per angle. The Topas® software was used for data analysis (lattice parameters and mean crystallite size determined using the Le Bail method). Both Kα1,2 radiations were taken into account in the fitting process. The XRD measurements took place after approximately the same time after the synthesis step for all the samples.
TGA measurements
A Discovery TGA-TA instrument with a nitrogen flow rate of 25 mL min−1 and a temperature ramp of 5 °C min−1 from 25 to 800 °C was used to analyse the powders.
Raman measurements
Raman spectroscopy measurements of the dried powders were performed using a Renishaw inVia apparatus. The 632.8 nm excitation wavelength of an He/Ne laser was used with a power density of ∼3 kW cm−2. A baseline correction has been applied.
TEM observations
Transmission Electron Microscopy (TEM) images were obtained using a JEOL JEM-2100F microscope operating at 200 kV (point to point resolution of 0.19 nm). The samples were prepared by evaporating a diluted suspension of the NPs in an ethanol solution on a carbon-coated copper grid. The mean crystallite size for each sample was determined by measuring 100 NPs. The size distribution curves for each sample were then fitted with a Gaussian distribution.
XPS measurements
X-ray Photoelectron Spectroscopy (XPS) measurements were recorded with a PHI 5000 Versaprobe instrument equipped with an Al Kα1 monochromatic radiation (EKα(Al) = 1486.7 eV with a 200 μm diameter spot size). Powders were pressed on an indium sheet in order to immobilize the NPs during measurements. Data were analyzed with the CasaXPS processing for curve fitting and MultiPak software for quantitative analysis. A neutralization process has been applied in order to avoid charge accumulation at the surface of the samples. The carbon C1s peak at 284.5 eV was used as a reference. A Shirley background was subtracted and a Gauss (70%)–Lorentz (30%) profile was used. Full Width at Half Maximum (FWHM) were fixed between 1.5 and 2.0 eV except for the curves fitting of the C1s (π–π*) and N1s (2.0–2.3 eV) peaks.
BET measurements
BET measurements were performed with a Micromeritics Tristar II apparatus. Samples were outgassed in situ under a pressure of 20 mTorr and at 100 °C. The measurements were performed at liquid N2 temperature with N2 as the adsorbing gas. The mean apparent particle diameters (ØBET) were derived from the surface area assuming that the nanometric crystallites have a smooth and spherical shape with a narrow size distribution. They have been calculated using the equation: ØBET = 6000/(ρ × S) where ØBET is the mean apparent particle diameter (nm), S is the surface area (m2 g−1) and ρ the mass density (5.2 g cm−3 in the case of magnetite).
DLS measurements
Dynamic Light Scattering (DLS) measurements of suspensions at pH = 7.4 and in 10−2 M NaCl have been carried out at 25 ± 0.1 °C using a Malvern Zetasizer Nano ZS by DTS Nano V4.2 software. Sample were ultrasonicated and filtered (filter of 0.45 μm).
Results and discussion
According to the literature, catechols can react with oxidant species such as metallic cations (Mn4+ or Fe3+ for instance) depending on the pH conditions. Under acid conditions and in presence of Fe3+ ions, catechols are oxidized into quinones. This is the case for LDOPA which transform into L-DOPAquinone in run type 1 (Fig. 1).28,29 However a basic pH promotes the instability of these molecules (especially LDOPA).23,30 Indeed, without metallic ions, dopaquinone can be formed. Then cyclization takes place spontaneously into leukodopachrome which can be transformed into L-DOPAchrome by oxidation (Fig. 2).31,32
 |
| Fig. 2 Evolution of a catechol (LDOPA as example) according to the pH and the run type of the hydrothermal continuous synthesis. | |
Nature of the synthesized oxides
All XRD measurements in Fig. 3 show the formation of Fe3(1−δ)O4 magnetite (δ is the deviation from oxygen stoichiometry)33 whatever the order of the addition of the organic molecule, the concentration and the nature of the organic molecule (run{1/a/b}, run{2/a/b}, run{3/a/b}). The XRD patterns reveal the inverse cubic spinel structure of Fe3(1−δ)O4 magnetite (Fd
m) (magnetite ICDD: 19-0629). Raman measurements confirm this observation through the presence of the characteristic A1g (668 cm−1) and A1 (720 cm−1) peaks of magnetite and maghemite respectively (Fig. S1†).
 |
| Fig. 3 XRD patterns of (A) Fe3O4-LDOPA and (B) Fe3O4-DHCA NPs from run{1/a/b}, run{2/a/b} and run{3/a/b}. | |
In addition to Fe3(1−δ)O4, two other lattice structures are observed in the XRD patterns (run{1/DHCA/100%} and run{3/DHCA/100%}) (Fig. 3B). When DHCA is added to the ferrous and ferric solution (run{1/DHCA/100%}) or to the NaOH solution after the synthesis of the NPs (run{3/DHCA/100%}), 2-line ferrihydrite (Fe(III) oxyhydroxide, precursor of goethite or hematite)34 and wüstite (Fe1−xO) are produced respectively (2-line ferrihydrite ICDD: 058-0900 and wüstite ICDD: 089-0687). These lattice structures appeared only for large concentrations of DHCA (molar ratio of 100%). When the molar ratio decreases (50% or 33%) only Fe3(1−δ)O4 magnetite NPs are produced. These structures are not observed by Raman spectroscopy. We should notice that according to the diffractograms and the previous publication,35 the proportion of these two structures is very low compared to magnetite. Usually the ferrihydrite phase is poorly crystallized and the average size of the NPs is around 2 nm.36 It can be converted into hematite (α-Fe2O3) at neutral pH and high temperature (>85 °C) or into goethite (FeO(OH)) under either acidic or basic conditions.36 Previously, it has been reported that some catechols (with electronegative groups) form complexes with Fe3+.37 These complex precursors promote in our case the formation of Fe(III) oxyhydroxides or Fe(III) oxides such as 2-line ferrihydrite. In our study, the mixing of the metal salt ions and DHCA under acidic conditions enhances the formation of this phase. Moreover the formation of these new phases does not take place only during the nucleation step (run{1/DHCA/100%}) but also during the growth of the NPs and the cooling step (run{3/DHCA/100%}). The wüstite lattice structure is usually obtained at high temperature and/or pressure.38 It decomposes into metal Fe and Fe3O4 when slowly cooled down to room temperature.39 It can be kept as a metastable phase when quickly cooled.39,40 Shultz et al.41 reported the partial degradation of iron oxide NPs induced by the coordination of dopamine (chemical structure close to LDOPA) on the surface of NPs. An iron(II) hydroxide fragmentation occurs. In our study, the addition of DHCA at 150 °C and pH ∼ 13 after the synthesis probably enhances this phenomenon. Indeed, DHCA molecules are already totally deprotonated. They can anchor by the two CO− groups of the aromatic cycle on the surface of NPs very quickly. The surface degradation stage of the NPs comes faster with the formation of Fe(II) hydroxide which lead to the generation of wüstite. We suggest that a high molar ratio of DHCA together with the rapid cooling conditions promote the formation of wüstite.
In summary the addition of DHCA organic molecules (with COOH groups) modifies the lattice structure of the iron oxide NPs unlike the addition of LDOPA (with COOH and NH2 groups). LDOPA prevents the formation of the metastable wüstite and 2-line ferrihydrite lattice structures.
Grafting efficiency
Presence of organic molecules. TGA, Raman and XPS measurements were used to check the grafting of the DHCA and LDOPA molecules at the surface of the iron oxide NPs. An increase of the molar ratio of organic molecules manifests as an additional weight loss after 100 °C which can be observed by TGA measurements (Fig. 4). The weight loss between 20 and 100 °C corresponds to physisorbed water. The presence of Raman peaks in the 1200-1700 cm−1 wavenumber range is used to check the presence of the organic molecules (Fig. S3†). The narrow peak at 1485 cm−1 (ν19b) is assigned to the catechol moiety.23,42 The skeletal mode of the benzene rings ν3 at 1337 cm−1 and the in-plane ring stretches (ν8a and ν8b) at about 1586 cm−1 are also observed.43 A detailed study of these Raman spectra goes beyond the scope of this article. But we note that previous work have demonstrated an enhanced Raman scattering for catechol moieties linked to metal-oxide nanoparticles due to the formation of a charge-transfer complex resulting from a bidentate binding between the two hydroxyl catechols and the surface of the NPs.30 This suggests that these molecules are probably very close to the surface of the NPs.
 |
| Fig. 4 TGA measurements of (A) Fe3O4-LDOPA and (B) Fe3O4-DHCA NPs from run{1/a/b}, run{2/a/b} and run{3/a/b}. | |
Finally XPS measurements show that the C1s and N1s contributions for NPs modified by LDOPA are more intense when organic molecules are introduced during the synthesis which confirms that DHCA and LDOPA are present on the surface of the NPs (Table 2 and Fig. S4†). Carbon peaks observed on naked NPs comes from the contamination resulting from the exposure of the NPs to ambient air. These measurements confirm the grafting of LDOPA and DHCA on the surface of iron oxide NPs.
Effect of the molar ratio. When the molar ratio of the organic molecules increases, the coating of the NPs increases too as shown, in most cases, by the increased weight loss measured by TGA (Fig. 4). Thanks to these values combined to surface area measurements (Table 1), the coverage rates (number of organic molecules on the surface of NPs) have been determined: for example in run{1/LDOPA/100%}, 5.9 molecules per nm2 cover the surface of the NPs whereas 1.9 molecules per nm2 are observed in run{1/LDOPA/33%} (Table 1). The same fact is observed in run type 2 and 3 with LDOPA and DHCA. XPS measurements confirm this observation (Table 2). Indeed, whatever the run type (1, 2 or 3), both ratios of C (%)/Fe (%) and N (%)/Fe (%) (DHCA and LDOPA samples) increase (Table 2) when the amount of molecules rises. For example, C (%)/Fe (%) is equal to 0.5 in run{1/DHCA/33%} and 1.6 in run{1/DHCA/100%}. As expected, a higher surface coverage results from a higher molar ratio of organic agents.
Table 1 SBET is the surface area of the NPs (m2 g−1) determined from BET measurements. molec is short for molecules
Samples |
a: DHCA |
a: LDOPA |
SBET (m2 g−1) |
Number of molec per nm2 |
SBET (m2 g−1) |
Number of molec per nm2 |
Naked Fe3O4 |
104 ± 1 |
— |
104 ± 1 |
— |
Run{1/a/100%} |
40 ± 1 |
12.6 |
50 ± 2 |
5.9 |
Run{1/a/50%} |
62 ± 1 |
5.8 |
81 ± 1 |
5.0 |
Run{1/a/33%} |
84 ± 1 |
2.3 |
106 ± 1 |
1.9 |
Run{2/a/100%} |
n.d |
n.d |
6 ± 1 |
n.d |
Run{2/a/50%} |
217 ± 1 |
0.7 |
51 ± 3 |
n.d |
Run{2/a/33%} |
202 ± 1 |
0.6 |
194 ± 1 |
2.0 |
Run{3/a/100%} |
133 ± 1 |
1.7 |
48 ± 1 |
n.d |
Run{3/a/50%} |
172 ± 1 |
0.8 |
144 ± 1 |
1.1 |
Run{3/a/33%} |
143 ± 1 |
0.4 |
139 ± 1 |
0.9 |
Table 2 Atomic concentration of naked Fe3O4, Fe3O4-DHCA and Fe3O4-LDOPA NPs from run{1/a/b}, run{2/a/b} and run{3/a/b} as determined by XPS
Samples |
a: DHCA |
a: LDOPA |
C (%) |
O (%) |
Fe (%) |
Na (%) |
C (%)/Fe (%) |
C (%) |
O (%) |
Fe (%) |
N (%) |
Na (%) |
C (%)/Fe (%) |
N (%)/Fe (%) |
Naked Fe3O4 |
9 |
56 |
35 |
— |
0.3 |
9 |
56 |
35 |
— |
— |
0.3 |
0 |
Run{1/a/100%} |
29 |
53 |
18 |
— |
1.6 |
27 |
49 |
20 |
4 |
— |
1.4 |
0.2 |
Run{1/a/50%} |
24 |
53 |
23 |
— |
1.0 |
30 |
45 |
20 |
4 |
— |
1.5 |
0.2 |
Run{1/a/33%} |
17 |
52 |
31 |
— |
0.5 |
17 |
50 |
30 |
3 |
— |
0.6 |
0.1 |
Run{2/a/100%} |
53 |
35 |
3 |
9 |
17.7 |
53 |
31 |
4 |
6 |
6 |
13.3 |
1.5 |
Run{2/a/50%} |
11 |
54 |
35 |
— |
0.3 |
30 |
49 |
17 |
4 |
— |
1.8 |
0.2 |
Run{2/a/33%} |
12 |
53 |
35 |
— |
0.3 |
19 |
48 |
30 |
3 |
— |
0.6 |
0.1 |
Run{3/a/100%} |
18 |
49 |
28 |
5 |
0.7 |
33 |
39 |
19 |
4 |
5 |
1.7 |
0.2 |
Run{3/a/50%} |
13 |
51 |
36 |
— |
0.4 |
14 |
53 |
29 |
3 |
— |
0.5 |
0.1 |
Run{3/a/33%} |
11 |
54 |
35 |
— |
0.3 |
13 |
50 |
33 |
2 |
— |
0.4 |
0.1 |
Effect of the addition sequence of the organic molecules. The addition sequence of the organic molecules plays an important role too. Indeed TGA and XPS measurements show that when DHCA and LDOPA are mixed with ferrous and ferric ions in solution in run type 1, the amount of organic molecules grafted on the surface of NPs is higher than in the other cases (Fig. 4 and Table 2). The ratio of the atomic concentrations C (%)/Fe (%) or N (%)/Fe (%) as determined by XPS in run type 1 is approximately equal or higher to the ones in the other runs. For example, we observed that the ratio of C (%)/Fe (%) for DHCA is 0.6, 0.6 and 0.4 for run{1/DHCA/33%}, run{2/DHCA/33%} and run{3/DHCA/33%} respectively. The same trend is observed by TGA. For example we obtained 2.3 molecules of DHCA per nm2, 0.6 DHCA per nm2 and 0.4 DHCA per nm2 in run{1/DHCA/33%}, run{2/DHCA/33%} and run{3/DHCA/33%} respectively. When LDOPA or DHCA are added after the synthesis of the NPs, the number of molecules per nm2 determined by TGA and the C (%)/Fe (%) ratio determined by XPS are lower than for the other run types (1 and 2) (Tables 1 and 2). In run type 1, DHCA or LDOPA are mixed with metallic ions. They form a “pre-complex” between ions and ligands which leads to a better grafting during the synthesis of the NPs. In run type 2 and 3 the ligands are exposed to high pH (they are totally deprotonated) and not mixed with ferrous and ferric ions before the synthesis of NPs. A partial amount of these ligands may be oxidized into semiquinones and/or quinones and submitted to a cyclization like leukodopachrome (Fig. 2). These new forms conjugated with the very short synthesis time may be less propitious to the grafting of the ligands.44 In summary the grafting efficiency is improved in run type 1.But a large quantity of organic molecules is also grafted on the surface of the NPs when DHCA and LDOPA are mixed with the NaOH solution before the NPs synthesis with a 100% ratio. Atomic concentrations as determined by XPS (Table 2) show a large decrease of the iron atomic concentration from 35% (Fe3O4) to 3% (run{2/DHCA/100%}) and 4% (run{2/LDOPA/100%}) when the molar ratio increases from 0% to 100%. Moreover C (%)/Fe (%) is larger for run{2/LDOPA/100%} (13.3) compared to run{1/LDOPA/100%} (1.4). This shows that the grafting is significant at high pH and high concentration during run type 2. The coating is larger in this case (Fig. 4). This observation is confirmed by the Raman measurements. Whatever the parameters (run{1/a/b}, run{2/a/b}, run{3/a/b}), no shifts are observed for the ν3, ν8a, ν8b and ν19b vibrations (Fig. S3†). However for large pH and large molar ratio (100% and 50%), new bands (torsion τ(HOCC))45 are observed (run{2/DHCA/100%}, run{2/LDOPA/100%}, run{2/LDOPA/50%} and run{3/LDOPA/100%}) (Fig. S1†). These may be assigned to the different arrangement due to the larger amount of DHCA and LDOPA on the surface of the NPs as observed by TGA and XPS measurements.
Effect of large concentrations and of the addition sequence of DHCA and LDOPA. Two drawbacks have to be taken into account at pH ∼ 13 (run types 2 and 3). First, a high pH can modify the structure of LDOPA and DHCA (Fig. 2). For instance, when LDOPA is mixed with a NaOH solution with a significant molar ratio (100% and 50%) it can transform into leukodopachrome or L-DOPAchrome30 as shown by the presence of new peaks at 398.1 eV (run{3/LDOPA/100%}) and 398.2 eV (run{2/LDOPA/100%}) in the N1s contribution (Fig. S4C†) in the XPS spectra. The conformation of this nitrogen atom is similar to the one observed for pyridinic compounds.46–48 This weak N1s peak is assigned to C–N cyclic compounds. The second drawback comes from the reactivity of the functional groups of catechols moieties. Under basic pH, the reactive groups are (COO−, NH2 and CO−, the latter coming from the hydroxyl groups linked to the cycle). Indeed in runs 2 (pH ∼ 13) all the functional groups of the ligands are fully deprotonated (Fig. 2). Consequently the interaction between ferrous ions, ferric ions and organic molecules is probably promoted. Furthermore if each group interacts with the surface of the NPs then the following step of grafting between the catechols and other molecules such as PolyEthylene Glycol (PEG) will be inefficient. It is important to avoid this situation in order to allow subsequent graftings to improve the long-time circulation and the stability of the NPs which is required for biomedical applications.Other contributions in the region of the N1s XPS peak were observed for all samples modified by LDOPA (Fig. S4C†). Whatever the run type (1, 2 or 3), NH3+ groups remain after the synthesis when the molar ratio increases to 100%.49 However the NH3+ contribution is significantly smaller than the NH2 one (9% in run{2/LDOPA/b}) at 399.9 eV.49 This latter represents neutral amino NH2 groups obtained thanks to a basic pH at the outlet of the synthesis. Finally when DHCA and LDOPA are mixed with the NaOH solution with a 100% molar ratio, a high atomic concentration of Na is observed (9 and 6% for run{2/DHCA/100%} and run{2/LDOPA/100%} respectively and 5% for run{3/DHCA/100%} and run{3/LDOPA/100%}) (Table 2). A possible explanation is that organic molecules at high concentration form a complex with sodium ions. TGA, Raman and XPS measurements confirm that DHCA and LDOPA molecules have been grafted during the continuous synthesis under hydrothermal conditions (150 °C, 25 MPa and 4 × 20 mL min−1) whatever the sequence of the addition of the organic molecules and the concentration. Large molar ratios increase grafting. In order to fix a large amount of LDOPA and DHCA on the NPs, a molar ratio of 100% is preferred.
Anti-oxidizing effect of organic molecules on iron oxide NPs
Effect of the molar ratio. Unmodified NPs have a lattice parameter of 8.385 ± 0.002 Å. The deviation from oxygen stoichiometry δ in the formula Fe3(1−δ)O4 determined from the lattice parameter shows that unmodified NPs are partially oxidized (δ = 0.023).33,50Whatever the run type (1, 2 or 3), increasing the molar ratio of DHCA and LDOPA results in an increase of the lattice parameter (a) and a decrease of the deviation from oxygen stoichiometry (δ). NPs are better protected against oxidation during the synthesis by larger molar ratios. For example, when the molar ratio of LDOPA or DHCA increases from 33% to 100% in run type 3, the lattice parameter of the coated NPs increases from 8.346 ± 0.003 Å (run{3/LDOPA/33%}) to 8.374 ± 0.003 Å (run{3/LDOPA/100%}) and the deviation from oxygen stoichiometry decreases from 0.105 (33%) to 0.045 (100%). These observations are confirmed by Raman spectroscopy. Indeed, with a low percentage of organic molecules (33% and 50%), whatever the run type (1, 2 or 3), a slight shoulder at 720 cm−1 characteristic of the A1 peak of maghemite (γ-Fe2O3) is observed (Fig. S1†). The anti-oxidizing effect results from the formation of a “protective layer” at the surface of the NPs whose coverage increases when the molar ratio increases as demonstrated previously (Fig. 6). Only the A1g Raman peak is observed for non-oxidized samples (run{1/LDOPA/100%} and run{1/LDOPA/100%}). This latter is characteristic of magnetite. Raman spectroscopy supports the XRD results.
For each sample, the Fe2p3/2, Fe2p1/2 and Fe2p3/2 satellite peaks are observed in the XPS spectra (Fig. S2†).51 In the case of unmodified NPs, the binding energies are respectively 710.4 eV, 723.9 eV and 718.6 eV. The binding energy difference between the Fe2p3/2 and the satellite peak of the Fe3O4-LDOPA and Fe3O4-DHCA NPs obtained in all cases with run{1/a/b}, run{2/a/b} and run{3/a/b} is always approximately 8.2 eV. This value is usually linked to the oxidation degree of iron cations and changes with the presence of Fe2+ or Fe3+. It does not enable us to conclude about the oxidation state of the iron cations (Table S1†).51,52
Effect of the addition sequence (run type). The anti-oxidizing effect is more pronounced for run type 1 (pH ∼ 3) than for the two others (Table 3). Indeed the lattice parameters in run type 1 are higher than in run types 2 and 3. Additionally when DHCA and LDOPA are mixed with Fe2+ and Fe3+ ions with a molar ratio of 100% (run{1/LDOPA/100%} and run{1/DHCA/100%}), the lattice parameters are very close to pure magnetite (a = 8.396 Å)53 and higher than that of unmodified NP (8.385 ± 0.002 Å) (Table 3). A high concentration of organic agents and an acid pH promote the anti-oxidizing effect on the NPs during the synthesis step. Indeed, before the synthesis of the NPs, these molecules which are mixed with ferrous and ferric ions (pH ∼ 3) in run type 1 are hardly deprotonated (Fig. 2 and 5). Only the COOH groups can be a little deprotonated and bind with other ions. On the contrary under basic conditions (pH ∼ 13 as in run types 2 and 3), the NH2 and OH groups from the catechol moieties are deprotonated and can bind with iron ions (run type 2) or with the surface of the NPs (run type 3). Under acidic conditions, catechol moieties and Fe3+ ions can react to produce quinone moieties leading to a reduction of Fe3+ into Fe2+.29 Thanks to this process and despite the fact that Fe2+ ions transform easily into Fe3+ ions at high temperature and pressure,17 it is possible to keep a 1
:
2 molar ratio which is required to have pure magnetite (Fig. 5). This may be the reason of the appearance of an anti-oxidizing effect in this work. Under basic conditions, DHCA and LDOPA are fully deprotonated in run type 2 and 3 and a significant oxidation of the iron oxide NPs is observed. At the same pH value (pH ∼ 13 in run type 2 and 3) and concentration (33%, 50% and 100% molar ratios) there is a difference between run type 2 and 3. Indeed, when DHCA is introduced before the synthesis of the NPs (run{2/DHCA/b}), the lattice parameter and the deviation from stoichiometry reveal a moderate oxidation compared to run{3/DHCA/b}. In run type 3, the measured lattice parameters are lower than those of bare NPs. For example, in run{3/LDOPA/100%} the lattice parameter is equal to that of maghemite (γ-Fe2O3, a = 8.345 Å).54 It has been reported that some catechols strongly bind to Fe3+ ions at the surface of NPs and can be removed from the surface and reduced into Fe2+ with an oxidation of the organic molecules into semi-quinones or/and quinones (Fig. 5).29,37,41,44 Compared to run type 1, organic molecules are introduced with higher pH value and temperature. These parameters can promote the oxidation of LDOPA and DHCA into semi-quinones and/or quinones before cyclization (Fig. 5). Totally deprotonated, the bidendate binding is accelerated and the ligands promote and speed up the degradation of the nanoparticle surface. A loss of Fe3+ is observed (Fig. 5). This cation deficiency in the Fe3(1−δ)O4 structure may explain the high oxidation of the NPs in run type 3.
Table 3 Structural parameters of naked Fe3O4 NPs and Fe3O4 NPs modified by DHCA and LDOPA from run{1/a/b}, run{2/a/b} and run{3/a/b}. a (Å) is the lattice parameter, δ the deviation from oxygen stoichiometry of Fe3(1−δ)O4, ØTEM the mean diameter of the crystallites as determined from the TEM images (100 crystallites), ØBET is the diameter of the nanoparticles resulting from surface area measurements and ØXRD the diameter of the crystallites as determined from the XRD patterns. n.d is short for not determined
Samples |
a: DHCA |
a: LDOPA |
ØTEM (nm) |
ØXRD (nm) |
a (Å) |
δ |
ØBET (nm) |
ØTEM (nm) |
ØXRD (nm) |
a (Å) |
δ |
ØBET (nm) |
Naked Fe3O4 |
8 ± 2 |
10.4 ± 0.1 |
8.385 ± 0.002 |
0.023 |
11.1 ± 0.1 |
8 ± 2 |
10.4 ± 0.1 |
8.385 ± 0.002 |
0.023 |
11.1 ± 0.1 |
Run{1/a/100%} |
22 ± 5 |
18.7 ± 0.7 |
8.392 ± 0.007 |
0.006 |
28.8 ± 0.7 |
20 ± 5 |
19.7 ± 0.3 |
8.396 ± 0.007 |
0 |
23.1 ± 0.9 |
Run{1/a/50%} |
23 ± 7 |
26.5 ± 0.3 |
8.386 ± 0.001 |
0.015 |
18.7 ± 0.3 |
15 ± 4 |
16.1 ± 0.2 |
8.382 ± 0.002 |
0.028 |
14.2 ± 0.1 |
Run{1/a/33%} |
25 ± 7 |
25.8 ± 0.3 |
8.374 ± 0.001 |
0.045 |
13.8 ± 0.1 |
11 ± 3 |
13.3 ± 0.2 |
8.373 ± 0.002 |
0.048 |
10.9 ± 0.1 |
Run{2/a/100%} |
n.d |
5 ± 2 |
n.d |
n.d |
n.d |
n.d |
5 ± 3 |
n.d |
n.d |
231 ± 9 |
Run{2/a/50%} |
6 ± 1 |
6.3 ± 0.2 |
8.372 ± 0.008 |
0.050 |
5.3 ± 0.1 |
6 ± 1 |
4 ± 1 |
n.d |
n.d |
22.4 ± 1.2 |
Run{2/a/33%} |
7 ± 1 |
7.5 ± 0.1 |
8.367 ± 0.001 |
0.060 |
5.7 ± 0.1 |
5 ± 2 |
4.7 ± 0.1 |
8.347 ± 0.010 |
0.102 |
6.0 ± 0.1 |
Run{3/a/100%} |
8 ± 1 |
12.5 ± 0.2 |
8.365 ± 0.003 |
0.064 |
8.7 ± 0.1 |
8 ± 4 |
12.4 ± 0.2 |
8.374 ± 0.003 |
0.045 |
24.0 ± 0.5 |
Run{3/a/50%} |
8 ± 1 |
7.9 ± 0.1 |
8.352 ± 0.003 |
0.093 |
6.7 ± 0.1 |
7 ± 1 |
8.4 ± 0.1 |
8.367 ± 0.004 |
0.060 |
8.0 ± 0.1 |
Run{3/a/33%} |
8 ± 1 |
9.1 ± 0.1 |
8.359 ± 0.003 |
0.091 |
8.1 ± 0.1 |
8 ± 2 |
9.4 ± 0.1 |
8.346 ± 0.003 |
0.105 |
8.3 ± 0.1 |
 |
| Fig. 5 Mechanisms and evolution of ferrous and ferric ions in run type 1, (A) without catechol and (B) with catechol (LDOPA as example) in run type 1 and (C) in run type 3. | |
However no conclusion can be reached for run type 2 concerning the LDOPA and DHCA samples because the NPs are poorly crystallized (see below). We have shown above that organic molecules are present on the surface of the NPs. They form a layer whatever the run type (Fig. 6). In run type 1, DHCA and LDOPA protect the NPs from oxidation during the synthesis. In run types 2 and 3, oxidation occurs but is limited when using a large molar ratio. DHCA and LDOPA do not act only before or during the synthesis step but also after. They modify the oxidation degree of the NPs depending on the order of their addition (Fig. 6). A high concentration and a mixing of the organic agents (LDOPA and DHCA) with ferrous and ferric ions (run 1) are preferred to synthesize non-oxidized Fe3O4 NPs. Moreover the modification of the oxidation degree cannot be explained by the size of NPs. Indeed as demonstrated in the next part, for run type 3 the size of the NPs is equal to the one of the bare NPs but they are more oxidized (Table 3).
 |
| Fig. 6 Effects of DHCA and LDOPA on the oxidation degree and size of the nanoparticles according to the run type and the molar ratio of organic molecules. | |
Effect of the organic molecules on the size and morphology of iron oxide NPs
Effect of the addition sequence (run type). The addition of DHCA and LDOPA plays a role on the crystallite size of the NPs as determined by XRD (Fig. 3 and Table 3), TEM images (Fig. 7, Table 3 and Fig. S5†) and BET measurements (Table 1). The size of naked NPs is ØXRD = 10.4 ± 0.1 nm. When adding DHCA and LDOPA with ferric ions, the average size of the crystallites increases by a factor of two approximately whatever the molar ratio (33, 50 and 100%). For example with LDOPA the mean size increases to 19.7 ± 0.3 nm (run{1/LDOPA/100%}). However when the agents are added in run type 2 with the NaOH solution, the effect is opposite. The mean size of the crystallites decreases by a factor of two approximately (4.7 ± 0.1 nm for run{2/LDOPA/33%} for example). In run type 3 the mean size of the crystallites is unchanged (approximately 8 nm as determined by TEM measurements, Table 3 and Fig. S5†). When DHCA and LDOPA are almost completely protonated (run{1/a/b}), their addition result in an increase the size of the crystallites. Contrary to run type 1, when DHCA and LDOPA are fully deprotonated under basic conditions (run{2/a/b}) they prevent the growth of the crystallites. The interaction between their functional groups and the metallic species is increased. The ferrous and ferric ions bind immediately to the hydroxyls groups of the catechol species during the synthesis. As a result the growth is stopped quickly. Moreover the interaction of the NPs with the surrounding medium occurs at their surface. The larger sizes of the NPs obtained for run type 1 result in a smaller surface to volume ratio. This explains at least in part why the NPs obtained in run type 1 are less oxidized than those obtained in run types 2 and 3 (Fig. 6).
 |
| Fig. 7 TEM images of (A) naked Fe3O4 NPs, NPs from (B) run{1/LDOPA/100%} (C) run{1/LDOPA/33%}, (D) run{1/LDOPA/50%} and (E) run{2/LDOPA/50%}. (F) HRTEM image for NPs from run{3/LDOPA/50%} (G) run{1/DHCA/33%}, (H) run{2/DHCA/33%} and (I) run{3/DHCA/50%}. | |
The addition sequence induces also some modifications of the NPs morphology and more particularly when ligands are mixed with metallic ions (run type 1). The NPs look like nanoflowers (Fig. 7B, D and G) as reported previously by Hugounenq et al.55 They are made of spherical NPs resulting from an assembly of small crystallites (Fig. 7B, D and G). This particular morphology is not observed in run type 2 and 3. Indeed, well-defined NPs with spherical and polyhedral shapes are observed (Fig. 7H and I) as well as in the case of bare NPs (Fig. 7A).
In addition, a high agglomeration is observed in run type 2 particularly for LDOPA sample (Fig. 7E). This state in run type 2 could explain the low SBET measured in Table 1 (SBET = 6 ± 1 and SBET = 51 ± 3 m2 g−1 for run{2/LDOPA/100%} and run{2/LDOPA/50%}). As observed in Fig. S6A–C,† NPs are organized in large aggregates (size around 200 nm) in which crystallized NPs (Fig. S6D†) have an individual size inferior to 10 nm. NPs seem to be more dispersed in run type 1 and 3 (Fig. 7B). In addition, the interparticle edge to edge separation distance of adjacent NPs (di) in run type 1 is larger (Fig. 7B) than in run type 2 and 3. It confirms the low agglomeration state in run type 1. This interval reveals the presence of a larger organic shell in the nano-gaps of NPs in run type 1 in good agreement with TGA measurements.
NPs synthesized according to run{1/a/100%} are less aggregated compared to naked NPs (Fig. 7A and B). This increased colloidal stability is also proven via hydrodynamic size measurements. Indeed, in the case of run{1/LDOPA/100%} and run{1/DHCA/100%}, we obtained hydrodynamic sizes of 106 ± 2 nm and 124 ± 2 nm respectively at pH = 7.4 and in NaCl 10−2 M. In comparison, for naked NPs the hydrodynamic size is 434 ± 26 nm. This state is also observed in Fig. S7.† After 6 hours the suspensions of modified NPs remain stable.
HRTEM images (Fig. 7D–F) show good crystallization (in Fig. 7F, the 0.25 nm interatomic distance which corresponds to (311) plans is highlighted). Sizes obtained thanks to TEM and HRTEM are in quite good agreement with those obtained thanks to XRD (Table 3, Fig. 7 and S5†).
Effect of organic molecules. Finally there is a difference between LDOPA and DHCA in run type 1 (Fig. 6). When the molar ratio of DHCA increases from 33% to 100%, the average size decreases (from ØXRD = 25.8 ± 0.3 nm to ØXRD = 18.7 ± 0.7 nm, respectively). In the case of LDOPA, the average size increases (from ØXRD = 13.3 ± 0.2 nm to ØXRD = 19.7 ± 0.3 nm respectively). We suggest that this is the result of the NH2 groups of LDOPA. They can prevent an interaction between the COO− groups and the surface of the NPs before and during the synthesis step, interaction that may limit the crystallite growth when it occurs. This explanation is in good agreement with the XPS results. The peak shift of the carboxyl groups of the NPs is smaller for LDOPA than for DHCA (1.5 eV for run{1/DHCA/100%} vs. 0.6 eV for run{1/LDOPA/100%}) (Fig. S4†). Weinhold et al.56 assigned this shift to an interaction between the charge state of CO2− group and the Au(110) surface.
Conclusions
Using a continuous process, we have pointed out the impact of the ligand addition sequence on the properties of iron oxide NPs. Such a study would not have been possible using a batch reactor. Despite the short duration of the reaction (11 s), we have shown that the chelating agent (DHCA or LDOPA) concentration and the sequence of its addition (pH) have a significant influence on the structure, the grafting efficiency, the oxidation degree and the size of the magnetite NPs. Finally a high molar ratio ([organic molecules]/[Fe2+ + Fe3+]) (100%) introduced under acidic conditions (run type 1) prevents the further oxidation of the NPs. These optimized parameters lead to crystallites smaller than 20 nm which is preferred for MRI applications (superparamagnetic properties). In run type 2 for which the addition occurs at basic pH and before the synthesis of the NPs, DHCA and LDOPA slow down and stop the growth of the NPs through the interaction between their functional groups and the metallic ions. In run type 3 for which the addition occurs after the synthesis of the NPs, their addition modifies only the lattice structure and the oxidation degree of the NPs. We have therefore demonstrated the effect of both the addition sequence and pH of the organic ligands on the formation of the final functionalized NPs under continuous hydrothermal conditions. We determined that for further biomedical applications needing other graftings (polymers like PEG, chelates to sequestrate radioelements for bimodal imaging or fluorophores), run type 1 with 100% of organic molecules is preferred. Indeed, it leads to the best results concerning the particle size (lower than 20 nm), oxidation degree (composition close to magnetite), grafting rates (from 6 to 12 LDOPA or DHCA/nm2) and conformation of these molecules (carboxylic and amine groups free for further graftings). This study opens new perspective for the grafting and synthesis of oxide NPs under continuous hydrothermal conditions.
Acknowledgements
This work was supported by the Conseil Régional de Bourgogne. The authors thank Dr Rémi Chassagnon for TEM observations and Maxime Guérineau for BET measurements.
Notes and references
- R. M. Fratila, S. G. Mitchell, P. del Pino, V. Grazu and J. M. de la Fuente, Langmuir, 2014, 30, 15057–15071 CrossRef CAS PubMed.
- S. Laurent, D. Forge, M. Port, A. Roch, C. Robic, L. Vander Elst and R. N. Muller, Chem. Rev., 2008, 108, 2064–2110 CrossRef CAS PubMed.
- A. S. Teja and P.-Y. Koh, Prog. Cryst. Growth Charact. Mater., 2009, 55, 22–45 CrossRef CAS PubMed.
- Y.-X. Wang, S. Hussain and G. Krestin, Eur. J. Radiol., 2001, 11, 2319–2331 CrossRef CAS PubMed.
- J. R. McCarthy and R. Weissleder, Adv. Drug Delivery Rev., 2008, 60, 1241–1251 CrossRef CAS PubMed.
- L. Zhang, W. F. Dong and H. B. Sun, Nanoscale, 2013, 5, 7664–7684 RSC.
- L. Maurizi, A.-L. Papa, L. Dumont, F. Bouyer, P. Walker, D. Vandroux and N. Millot, J. Biomed. Nanotechnol., 2015, 11, 126–136 CrossRef CAS PubMed.
- E. D. Smolensky, H. Y. E. Park, T. S. Berquo and V. C. Pierre, Contrast Media Mol. Imaging, 2011, 6, 189–199 CAS.
- F.-Y. Cheng, C.-H. Su, Y.-S. Yang, C.-S. Yeh, C.-Y. Tsai, C.-L. Wu, M.-T. Wu and D.-B. Shieh, Biomaterials, 2005, 26, 729–738 CrossRef CAS PubMed.
- T. Adschiri, K. Kanazawa and K. Arai, J. Am. Ceram. Soc., 1992, 75, 1019–1022 CrossRef CAS PubMed.
- T. Togashi, S. Takami, K. Kawakami, H. Yamamoto, T. Naka, K. Sato, K. Abe and T. Adschiri, J. Mater. Chem., 2012, 22, 9041–9045 RSC.
- T. Togashi, M. Umetsu, T. Naka, S. Ohara, Y. Hatakeyama and T. Adschiri, J. Nanopart. Res., 2011, 13, 3991–3999 CrossRef CAS.
- S. Laurent, D. Forge, M. Port, A. Roch, C. Robic, L. Vander Elst and R. N. Muller, Chem. Rev., 2009, 110, 2574 CrossRef.
- S. Takami, T. Sato, T. Mousavand, S. Ohara, M. Umetsu and T. Adschiri, Mater. Lett., 2007, 61, 4769–4772 CrossRef CAS PubMed.
- M. D. de Tercero, C. Röder, U. Fehrenbacher, U. Teipel and M. Türk, J. Nanopart. Res., 2014, 16(2350), 1–27 Search PubMed.
- L. Maurizi, F. Bouyer, J. Paris, F. Demoisson, L. Saviot and N. Millot, Chem. Commun., 2011, 47, 11706–11708 RSC.
- L. Maurizi, F. Bouyer, M. Ariane, R. Chassagnon and N. Millot, RSC Adv., 2014, 4, 45673–45678 RSC.
- M. D. de Tercero, M. Bruns, I. G. Martínez, M. Türk, U. Fehrenbacher, S. Jennewein and L. Barner, Part. Part. Syst. Charact., 2013, 30, 229–234 CrossRef PubMed.
- G. Liu, J. Gao, H. Ai and X. Chen, Small, 2013, 9, 1533–1545 CrossRef CAS PubMed.
- N. Mizutani, T. Iwasaki, S. Watano, T. Yanagida, H. Tanaka and T. Kawai, Bull. Mater. Sci., 2008, 31, 713–717 CrossRef CAS.
- J. Santoyo Salazar, L. Perez, O. de Abril, L. Truong Phuoc, D. Ihiawakrim, M. Vazquez, J.-M. Greneche, S. Begin-Colin and G. Pourroy, Chem. Mater., 2011, 23, 1379–1386 CrossRef CAS.
- O. Horner, S. Neveu, S. Montredon, J.-M. Siaugue and V. Cabuil, J. Nanopart. Res., 2009, 11, 1247–1250 CrossRef CAS.
- N. Lee, D. R. Hummer, D. A. Sverjensky, T. Rajh, R. M. Hazen, A. Steele and G. D. Cody, Langmuir, 2012, 28, 17322–17330 CrossRef CAS PubMed.
- M. Chen, J. Kim, J. P. Liu, H. Fan and S. Sun, J. Am. Chem. Soc., 2006, 128, 7132–7133 CrossRef CAS PubMed.
- M. Daschner de Tercero, I. Gonzáles Martínez, M. Herrmann, M. Bruns, C. Kübel, S. Jennewein, U. Fehrenbacher, L. Barner and M. Türk, J. Supercrit. Fluids, 2013, 82, 83–95 CrossRef CAS PubMed.
- D. Aymes, M. Ariane, F. Bernard, H. Muhr and F. Demoisson, WO patent, 2011010056 A1, 2011.
- A. Aimable, B. Xin, N. Millot and D. Aymes, J. Solid State Chem., 2008, 181, 183–189 CrossRef CAS PubMed.
- W. Byszewska and M. Kanska, J. Radioanal. Nucl. Chem., 2014, 299, 1373–1378 CrossRef CAS PubMed.
- D. E. Fullenkamp, D. G. Barrett, D. R. Miller, J. W. Kurutz and P. Messersmith, RSC Adv., 2014, 4, 25127–25134 RSC.
- W. J. Barreto, S. Ponzoni and P. Sassi, Spectrochim. Acta, Part A, 1999, 55, 65–72 CrossRef.
- E. Herlinger, R. F. Jameson and W. Linert, J. Chem. Soc., Perkin Trans. 2, 1995, 259–263 RSC.
- G. Robinson and M. Smyth, Analyst, 1997, 122, 797–802 RSC.
- P. Poix, Bull. Soc. Chim. Fr., 1965, 4, 1085–1087 Search PubMed.
- Y. Cudennec and A. Lecerf, J. Solid State Chem., 2006, 179, 716–722 CrossRef CAS PubMed.
- T. Belin, N. Millot, N. Bovet and M. Gailhanou, J. Solid State Chem., 2007, 180, 2377–2385 CrossRef CAS PubMed.
- S. Das, M. J. Hendry and J. Essilfie-Dughan, Environ. Sci. Technol., 2011, 45, 268–275 CrossRef CAS PubMed.
- E. Amstad, A. U. Gehring, H. Fischer, V. V. Nagaiyanallur, G. Hahner, M. Textor and E. Reimhult, J. Phys. Chem. C, 2011, 115, 683–691 CAS.
- Y. Sugii, M. Inada, H. Yano, Y. Obora, Y. Iwasaki, R. Arakawa and H. Kawasaki, J. Nanopart. Res., 2013, 15(1379), 1–8 Search PubMed.
- J. C. Park, D. Kim, C. S. Lee and D. K. Kim, Bull. Korean Chem. Soc., 1999, 20, 1005–1009 CAS.
- X. L. Yu, Z. Y. Jiang, D. J. Yang, D. B. Wei and Q. Yang, Adv. Mater. Res., 2012, 572, 249–254 CrossRef CAS.
- M. D. Shultz, J. U. Reveles, S. N. Khanna and E. E. Carpenter, J. Am. Chem. Soc., 2007, 129, 2482–2487 CrossRef CAS PubMed.
- S. J. Hurst, H. C. Fry, D. J. Gosztola and T. Rajh, J. Phys. Chem. C, 2010, 115, 620–630 Search PubMed.
- M. L. McGlashen, K. L. Davis and M. D. Morris, AIP Conf. Proc., 1989, 191, 707–712 CrossRef PubMed.
- A. K. L. Yuen, G. A. Hutton, A. F. Masters and T. Maschmeyer, Dalton Trans., 2012, 41, 2545–2559 RSC.
- S. A. Siddiqui, A. K. Pandey, A. Dwivedi, S. Jain and N. Misra, J. Chem. Pharm. Res., 2010, 2, 835–850 CAS.
- J. Lahaye, G. Nansé, A. Bagreev and V. Strelko, Carbon, 1999, 37, 585–590 CrossRef CAS.
- X. Zhang, X. Chen, S. Dong, Z. Liu, X. Zhou, J. Yao, S. Pang, H. Xu, Z. Zhang, L. Li and G. Cui, J. Mater. Chem., 2012, 22, 6067–6071 RSC.
- H. Schmiers, J. Friebel, P. Streubel, R. Hesse and R. Köpsel, Carbon, 1999, 37, 1965–1978 CrossRef CAS.
- A. Schiffrin, A. Riemann, W. Auwarter, Y. Pennec, A. Weber-Bargioni, D. Cvetko, A. Cossaro, A. Morgante and J. V. Barth, Proc. Natl. Acad. Sci. U. S. A., 2007, 104, 5279–5284 CrossRef CAS PubMed.
- T. Belin, N. Millot, F. Villiéras, O. Bertrand and J. P. Bellat, J. Phys. Chem. B, 2004, 108, 5333–5340 CrossRef CAS.
- T. Yamashita and P. Hayes, Appl. Surf. Sci., 2008, 254, 2441–2449 CrossRef CAS PubMed.
- P. Perriat, E. Fries, N. Millot and B. Domenichini, Solid State Ionics, 1999, 117, 175–184 CrossRef CAS.
- N. Millot and P. Perriat, J. Solid State Chem., 2011, 184, 2776–2784 CrossRef CAS PubMed.
- T. Belin, N. Guigue-Millot, T. Caillot, D. Aymes and J. C. Niepce, J. Solid State Chem., 2002, 163, 459–465 CrossRef CAS.
- P. Hugounenq, M. Levy, D. Alloyeau, L. Lartigue, E. Dubois, V. Cabuil, C. Ricolleau, S. Roux, C. Wilhelm, F. Gazeau and R. Bazzi, J. Phys. Chem. C, 2012, 116, 15702–15712 CAS.
- M. Weinhold, S. Soubatch, R. Temirov, M. Rohlfing, B. Jastorff, F. S. Tautz and C. Doose, J. Phys. Chem. B, 2006, 110, 23756–23769 CrossRef CAS PubMed.
Footnote |
† Electronic supplementary information (ESI) available: Figures not included for brevity, Raman, TEM and XPS measurements. See DOI: 10.1039/c5ra17452j |
|
This journal is © The Royal Society of Chemistry 2015 |
Click here to see how this site uses Cookies. View our privacy policy here.