Preparation of a reduced graphene oxide/zirconia nanocomposite and its application as a novel lubricant oil additive

Qi Zhou a, Jingxia Huang a, Jinqing Wang *b, Zhigang Yang b, Sheng Liu c, Zhaofeng Wang *b and Shengrong Yang b
aCollege of Materials Science and Engineering, Lanzhou University of Technology, Lanzhou, 730050, P. R. China
bState Key Laboratory of Solid Lubrication, Lanzhou Institute of Chemical Physics, Chinese Academy of Sciences, Lanzhou, 730000, P. R. China. E-mail: jqwang@licp.cas.cn; zhfwang@licp.cas.cn; Fax: +86 931 4968076; Tel: +86 931 4968076
cThe Technical Center of Zibo Entry-exit Inspection and Quarantine Bureau, Zibo 255031, P. R. China

Received 28th August 2015 , Accepted 9th October 2015

First published on 12th October 2015


Abstract

Nanocomposites consisting of zirconia (ZrO2) nanoparticles and reduced graphene oxide (rGO) nanosheets were successfully fabricated by a one-pot hydrothermal method. By regulating the proportion of the precursors of the GO colloidal suspension and zirconium oxychloride (ZrOCl2) solution, ZrO2 nanoparticles with a diameter of about 5 nm were uniformly anchored onto the rGO nanosheets. The combination mechanism of ZrO2 nanoparticles fully bonded onto rGO nanosheets is the formation of the monodentate or bidentate composites between the oxygen-containing groups of GO and Zr(IV) complex ions from hydrolysis of the ZrOCl2 solution. The dispersibility and tribological properties of the prepared composites were investigated as novel lubricant additives in paraffin oil. The results suggested that the oil with a small amount of nanocomposite (0.06 wt%) exhibits good dispersibility, excellent friction-reduction and anti-wear properties as well as a high load-bearing capacity caused by the synergistic effect of the rGO nanosheets and ZrO2 nanoparticles.

1. Introduction

In recent years, nanostructured carbon materials, such as carbon fiber, carbon nanotubes, fullerenes, etc., have gained rapid development and widespread application due to their high load-bearing capacity and chemical stability, low surface energy, and weak intermolecular and strong intramolecular bonding. Moreover, these materials showed good tribological properties when they were used as lubricating materials. For instance, Hao et al.1 reported that multi-walled carbon nanotubes (MWCNTs) grafted with polyacrylamide as an additive in water exhibited good anti-wear and friction-reducing properties as well as a high load-carrying capacity. However, the desirable results were only achieved when the surface functionalization of the CNTs was performed by tedious and appropriate post-growth. In addition, Campbell et al.2 observed the tribological properties of C60 molecules dissolved in dry toluene, and the result showed that they had a good load-bearing capacity attributed to the fact that the spherical fullerenes behaved as nanoscale ball bearings, but the effect was not obvious by comparison with macroscopic friction measurements.

Graphene, a two-dimensional carbon structure arranged in a honeycomb lattice, has attracted great attention of scientists since its discovery in 2004,3 owing to its remarkable electronic, optical, mechanical, and thermal properties, high surface area and low density as well as its ease of functionalization.4,5 These features of graphene materials led to a broad range of potential applications in many areas, such as reinforced materials, hydrogen storage materials, nanoscale electronic devices, field-effect transistors and the electrochemistry field.6 In particular, graphene also has formidable mechanical properties, with a high Young’s modulus up to 1 TPa and a breaking strength of 130 GPa,7 and it also exhibited high-efficiency anti-wear and friction-reducing performances when used as a novel lubricating material.8,9 Therefore, the tribological properties of graphene are also of interest for application in a micro/nano-electromechanical system in addition to its excellent electronic and mechanical properties.10 For instance, Elomaa et al.11 investigated the friction and wear performances of water as a lubricant solvent containing 1 wt% of graphene oxide (GO) under a normal load of 10 N and the results showed that the friction coefficient decreased by 57% compared to pure water. Berman et al.12 demonstrated that graphene dispersed in ethanol could reduce friction greatly but was instantly removed from the sliding surface under an applied load of 5 N.

It is well known that graphene has outstanding tribological properties, but its high surface energy induces easy agglomeration, resulting in poor dispersibility. It’s fortunate that the situation can be improved by surface modification of graphene, but most methods are organic-grafted. Mungse et al.13 synthesized dual-layer alkylated graphene and used it as a lubricant additive; the result suggested that the lube oils containing the alkylated graphene (0.02 mg mL−1) exhibited long-term dispersion stability, as well as the low friction and wear characteristics under sliding contact between steel tribo-pairs. However, organics usually are not environmentally friendly. Moreover, the lower hardness of graphene in the horizontal direction, and inevitable presence of defects and grain boundaries in macroscopic samples14 has a significant effect on the widespread applications of graphene in the tribological field.

Zirconia (ZrO2) is one of the most important ceramic materials in industry and has potential applications to the tribological field, due to its high mechanical strength, good chemical durability and thermal stability, and prominent tribological properties as well as corrosion resistance and non-toxicity.15–17 Over the past few years, researchers have prepared graphene/ZrO2 composites through different means; however these composites were mainly used in other fields, for example, Shon et al.18 demonstrated that graphene is an effective reinforcing agent to improve the mechanical properties of ZrO2 composites. Rao et al.19 synthesized a surface modified graphene/ZrO2 nanocomposite, which displayed excellent removal efficiency towards 4-chlorophenol from aqueous solution when used as the adsorbent. Salimi et al.20 manifested that the reduced GO(rGO)/ZrO2 nanocomposite exhibited high performance as a novel architecture application to electrochemical sensing and biosensing platforms. Besides, Zheng et al.21 synthesized graphene/ZrO2 composite coatings using a plasma spraying technique and the results of a wear test indicated that the composite coatings exhibited excellent wear resistance and a low friction coefficient. Therefore, preparation of a composite consisting of ZrO2 nanoparticles and rGO nanosheets can not only satisfy these requirements of good lubricating properties and a high load-bearing capacity, but also improve the dispersibility by anchoring ZrO2 nanoparticles onto the surface of graphene to prevent the exfoliated rGO nanosheets from re-stacking.

Herein we introduce a simple and effective route to prepare the composite of rGO nanosheets homogeneously covered with ZrO2 nanoparticles through adjusting the volume ratios of the GO and zirconium oxychloride (ZrOCl2) solutions; meanwhile, a possible mechanism for coating the rGO nanosheets with ZrO2 nanoparticles is also presented. Furthermore, the application of the prepared composite as a lubricant additive has been investigated, and the results indicated that the tribological properties of the base oil of liquid paraffin could be improved by the addition of the composite under proper conditions. Moreover, the possible friction-reduction and anti-wear mechanisms have also been discussed. To the best of our knowledge, no systematic studies have been done about the rGO/ZrO2 nanocomposite as a lubricant additive even though graphene and its composites have been studied extensively in recent years.

2. Experimental section

2.1 Materials

All chemicals and reagents used in the experimental process are analytical grade, including graphite powder (≤30 μm), potassium persulfate (K2S2O8, ≥99.5%), phosphorus pentoxide (P2O5, ≥98.0%), sulfuric acid (H2SO4, 98%), potassium permanganate (KMnO4, ≥99.5%), H2O2 (30 wt% in water), hydrochloric acid (HCl, 36–38%), zirconium oxychloride octahydrate (ZrOCl2·8H2O, ≥99.0%) and hydrazine hydrate (N2H4·H2O, ≥80.0%). Besides, ultrapure water (>18 MΩ cm) is used for preparation and rinsing.

2.2 Preparation of rGO/ZrO2 composites

Expansible graphite powders were oxidized to graphite oxides using a modified Hummers method.22 Subsequently, the as-prepared graphite oxides were exfoliated ultrasonically for 2 h to obtain the stable GO colloidal suspension. Then, the rGO/ZrO2 composites were synthesized by a simplified and high-efficiency hydrothermal method similar to that described in the literature,20 in which the GO colloidal suspension, ZrOCl2 solution and N2H4·H2O acted as the rGO precursor, ZrO2 precursor and reducing agent, respectively. In order to optimize the morphology of the composites, a series of experiments was conducted by setting the mixed solutions of GO and ZrOCl2 with different volume ratios (5[thin space (1/6-em)]:[thin space (1/6-em)]1, 3[thin space (1/6-em)]:[thin space (1/6-em)]1, 2[thin space (1/6-em)]:[thin space (1/6-em)]1, 1[thin space (1/6-em)]:[thin space (1/6-em)]1, and 1[thin space (1/6-em)]:[thin space (1/6-em)]2). Firstly, the GO colloidal suspension (2.33 mg mL−1) and ZrOCl2 solution (10 mM) were separately prepared and then mixed. After being sonicated for 30 min, 1 mL N2H4·H2O was added to the mixture (60 mL) of the two solutions and sealed in a 100 mL autoclave and maintained at 180 °C for 18 h. The obtained black products were separated by centrifuging and washed with ultrapure water repeatedly, and freeze-dried for 12 h. For comparison, pure rGO and ZrO2 were also prepared in the same way without the addition of ZrOCl2 or GO and N2H4·H2O.

2.3 Characterization

The gross structural information and composition of the samples were characterized by X-ray diffraction (XRD) analyses using a Rigaku D/max-2400 X-ray diffractometer with Cu-Kα radiation (λ = 0.154 nm) at 40 kV and 150 mA in the range of 2θ = 5–90°. The crystallite sizes were estimated using the Debye–Scherrer formula. Furthermore, the detailed microstructure, crystalline nature, and morphology characterizations of the as-synthesized samples were performed by transmission electron microscopy (TEM, FEI TECNAI G2 TF20) and high-resolution transmission electron microscopy (HRTEM), operated at 200 kV. Fourier transform infrared (FTIR) spectra for all the samples were recorded on a Nicolet 380 FTIR spectrometer with a resolution of 0.125 cm−1. Each sample in a known quantity was mixed with potassium bromide (KBr) and prepared into pellets for their FTIR measurements. All X-ray photoelectron spectroscopy (XPS) measurements were carried out on a PHI-5702 photoelectron spectrometer using an Al-Kα line as the X-ray source. Peak fitting of the C 1s and Zr 3d spectra for both samples was separately conducted using a Gaussian–Lorentzian function after performing a Shirley background correction.

2.4 Dispersible stability of the rGO/ZrO2 composite in paraffin

To evaluate the dispersion stability of the rGO/ZrO2 composite in a base oil of liquid paraffin, the composite was ultrasonically dispersed in paraffin (with a density of about 0.8375 g mL−1 at 25 °C and a viscosity of 12.45 mm2 s−1 at 40 °C and 3.52 mm2 s−1 at 100 °C, respectively) for 1 h and then a homogeneous lubricant was obtained. For comparison, control samples including oil separately mixed with pure ZrO2, graphite and rGO, have also been prepared in the same way. The concentration of these additives in paraffin was set as 0.06 wt% according to the results of the friction test for the pure oil mixed with various concentrations of the rGO/ZrO2 composite. The dispersion stability of the composite and control samples in oil was investigated by means of absorbance measurements. Absorbance is measured using an ultraviolet-visible (UV-vis) spectrophotometer (UV-2600 spectrophotometer) at set intervals. According to the Bouguer–Lambert–Beer law, the absorbance is directly proportional to the concentration of solid particles in pure oil, which means that a higher absorbance is associated with a better dispersion stability of the sample in the base oil. Moreover, photographs of the pure oil containing different additives were taken with different settling times for comparison.

2.5 Tribological properties of the rGO/ZrO2 nanocomposite as an additive of paraffin oil

The tribological properties of the composites as a lubricant additive were investigated at an ambient temperature of around 25 °C and a relative humidity of 25 ± 5% using an SRV-4 reciprocating friction and wear tester (Optimal, Germany) with the testing method of ASTM D6425-05. The experiments were performed at loads of 50–450 N and a sliding speed of 6 cm s−1, and with a test duration of 30 min. The parameters were chosen to ensure a boundary lubrication regime and to simulate high load contact situations in components such as gears and bearings. The friction pairs were GCr15 bearing steel balls (φ = 10 mm, Ra = 20 nm) and GCr15 bearing steel discs (24 mm × 8 mm). The hardness of the polished steel discs measured by an MH-5-VM microhardness tester was 790–820 HV and the roughness of them determined by a 3D profilometer (NanoMap-D dual mode) was about 50 nm. To remove the surface organic contaminants of the friction pairs, they were cleaned by ultrasonication in petroleum ether before testing. The volume of the lubricant used in the tribological tests was 0.2 mL. The lubricant was added to the contact surface of the friction pairs as droplets with a pipette to form a continuous lubricating layer covering the entire wear track area. The coefficient of friction (COF) versus sliding time curves were recorded automatically and timely, and at least three repeated measurements for each test condition were conducted.

The friction properties of the lubricant mixed with the rGO/ZrO2 composite were strongly influenced by its concentration. The experiments for determining the optimum concentration have been tested with a constant load of 50 N for 30 min to obtain the best lubricating performance. For comparison, the pure oil and oil separately mixed with natural graphite powders, ZrO2 nanoparticles, rGO nanosheets and commercial zinc dialkyl dithiophosphate (ZDDP) at the optimum concentration was also studied under the same conditions. After performing the friction testing using various materials as lubricant additives, the resulting wear tracks were observed by scanning electron microscopy (SEM) using a JSM-5600LV scanning electron microscope. Wear scars of the ball were measured by an Olympus STM6 microscope (Japan). The wear volume and the height profile of the tracks were obtained with a non-contact 3D surface profiler (model MicroMAXTM, ADE, USA). The wear rate (K) of the discs was calculated according to the formula below:

image file: c5ra17440f-t1.tif
where V (μm3) is the volume loss, which can be measured with a MicroMAXTM non-contact 3D surface profiler, F (N) represents the loading force which is a constant load of 50 N while d (m) represents the sliding distance which is also a constant of 1 mm under our experimental conditions.

3. Results and discussion

3.1 Characterization of the as-prepared rGO/ZrO2 nanocomposites

To obtain the best distributed sample, TEM images of the prepared rGO/ZrO2 nanocomposites obtained from various volume ratios of GO to ZrOCl2 solutions are compared in Fig. 1. As shown in Fig. 1a–g, the morphology of the composites is an uneven distribution when the proportion of ZrOCl2 solution in the mixture is too high or too low. In particular, the pure rGO nanosheets are highly wrinkled (Fig. 1a) and the ZrO2 nanoparticles are also severely agglomerated (Fig. 1g), and the as-prepared rGO nanosheets are thin with a clearly corrugated structure in good agreement with the atomic force microscopy (AFM) observation in the ESI Fig. S1, which further confirms that the large sheets of rGO are a stack of a few layers. The reason is that the rGO nanosheets gradually aggregated and formed the stacked graphite structure due to their high specific surface area in the process of their dispersion.23 However, when the volume ratio of the GO to ZrOCl2 solution was set as 2[thin space (1/6-em)]:[thin space (1/6-em)]1, the ZrO2 nanoparticles anchored onto rGO are homogeneous and moderate, meanwhile, the rGO nanosheets remain flat and no obviously curled sheets are observed (Fig. 1d). Moreover, the lattice spacing of 0.296 nm displayed in the HRTEM image (Fig. 1h) is consistent with the (111) plane of the tetragonal structure of ZrO2, in which the size of about 5 nm is in accordance with the calculated value based on the XRD results shown in Fig. 2a. Besides, the selected area electron diffraction (SAED) pattern displays that the positions of detectable rings are equivalent to the lattice positions from the standard tetragonal ZrO2 (JCPDS PDF no. 49-1642). The well dispersed structure of the composite suggested that the ZrO2 nanoparticles could act as spacers preventing the rGO from re-stacking and reducing the surface energy of each other, and thus increased by the stability of the exfoliated rGO nanosheets24 and the agglomeration phenomenon was effectively prevented.25 Therefore, the optimal composite sample (GO to ZrOCl2/(v[thin space (1/6-em)]:[thin space (1/6-em)]v) = 2[thin space (1/6-em)]:[thin space (1/6-em)]1) was chosen for the following characterizations.
image file: c5ra17440f-f1.tif
Fig. 1 TEM images of rGO/ZrO2 nanocomposites obtained from various volume ratios of GO to ZrOCl2 solutions: (a) 1[thin space (1/6-em)]:[thin space (1/6-em)]0, (b) 5[thin space (1/6-em)]:[thin space (1/6-em)]1, (c) 3[thin space (1/6-em)]:[thin space (1/6-em)]1, (d) 2[thin space (1/6-em)]:[thin space (1/6-em)]1, (e) 1[thin space (1/6-em)]:[thin space (1/6-em)]1, (f) 1[thin space (1/6-em)]:[thin space (1/6-em)]2, and (g) 0[thin space (1/6-em)]:[thin space (1/6-em)]1. (h) HRTEM image of (d). The inset in (h) provides the SAED pattern of the composite.

image file: c5ra17440f-f2.tif
Fig. 2 (a) XRD patterns of synthetic rGO, ZrO2 and the rGO/ZrO2 nanocomposite. (b) FTIR spectra of synthetic ZrO2, GO, rGO, and the rGO/ZrO2 nanocomposite.

Fig. 2a presents the XRD patterns of the prepared rGO/ZrO2 nanocomposite and the control samples. Obviously, the pattern of rGO presents a broad diffraction peak at 22.4° (d ≈ 0.386 nm), suggesting that the hydrothermal reduction allowed the rGO nanosheets to tightly pack.26 The crystal structure of the ZrO2 nanoparticles exists as tetragonal and monoclinic, in good agreement with the standard cards (JCPDS PDF no. 49-1642 and JCPDS PDF no. 37-1484, respectively), but the peak of the former has the dominant position of the relative intensity and the quantity. Moreover, the average size of the ZrO2 nanoparticles calculated by the Debye–Scherrer formula is about 5 nm. The rGO/ZrO2 nanocomposite shows characteristic peaks of rGO (002) and ZrO2 of a tetragonal structure, indicating the presence of ZrO2 nanoparticles over the rGO nanosheets.

The FTIR spectra of ZrO2, GO, rGO and the rGO/ZrO2 nanocomposite are shown in Fig. 2b. Obviously, a broad peak at ∼3405 cm−1 attributed to the O–H stretching vibration of adsorbed water molecules appears in all samples. The FTIR spectrum of ZrO2 displays some peaks at 1635 cm−1 (O–H bending vibration of water molecules), 750 cm−1, 590 cm−1 and 505 cm−1 (Zr–O stretching vibrations).27,28 The spectrum of GO presents the typical peaks at 1729 cm−1 (C[double bond, length as m-dash]O stretching vibration of –COOH and C[double bond, length as m-dash]O), 1629 cm−1 (C[double bond, length as m-dash]C skeleton stretching vibration and O–H bending vibration of water molecules), 1420 cm−1 (O–H bending vibration of –COOH and C–OH), 1281 cm−1 (C–O stretching vibration of phenols, ethers and epoxy groups), 1121 cm−1 (C–O–C stretching vibration), and 1072 cm−1 (C–O stretching vibration of –OH).29,30 For rGO, the peaks of the oxygen-containing groups corresponding to GO are mostly weakened and have slightly disappeared, indicating that GO was reduced incompletely. However, for the rGO/ZrO2 nanocomposite, the characteristic peak of the C[double bond, length as m-dash]O stretching vibration is shifted from 1729 to 1746 cm−1, which is attributed to the influence of coordination between O and Zr on the surface of the ZrO2 nanoparticles,38 and the relative intensity decreases significantly. Furthermore, the broad peak at 1420 cm−1 has separated into two small peaks at 1460 and 1398 cm−1, which can be assigned to the formation of either a monodentate complex or bidentate complex between the oxygen-containing groups of GO and Zr(IV) from the hydrolysis of the ZrOCl2 solution.31,32 So, it can be concluded that the ZrO2 nanoparticles are fully bonded onto the surface of the rGO nanosheets.

Fig. 3 provides the XPS analyses of GO and the rGO/ZrO2 nanocomposite to confirm the chemical changes. As shown in Fig. 3a, the C 1s XPS spectrum of GO unambiguously indicates a considerable degree of oxidation with four kinds of carbon atoms coming from the different functional groups: the non-oxygenated ring C (C[double bond, length as m-dash]C/C–C, 284.5 eV), the C in C–O bonds (285.3 eV), the C in O–C–O/C–OH (286.5 eV), and the C in HO–C[double bond, length as m-dash]O (287.8 eV).33 In Fig. 3b, the C 1s XPS spectrum of rGO/ZrO2 also exhibits the same oxygen functionalities corresponding to the GO nanosheets, but the peak intensities of these components are much weaker than those in GO, proving considerable deoxygenation by the reduction process. In addition, the presence of an additional component at 285.6 eV corresponding to the C in the C[double bond, length as m-dash]N bond of hydrazine34 is in good agreement with the XPS survey spectrum of the rGO/ZrO2 nanocomposite shown in Fig. 3d. These observations suggest that GO was deoxygenated by the hydrothermal process and nitrogen incorporation. In Fig. 3c, the binding energies of Zr 3d5/2 and Zr 3d3/2 are 183.5 and 185.7 eV, respectively, indicating that zirconium was oxidized into the Zr4+ state.35


image file: c5ra17440f-f3.tif
Fig. 3 (a) XPS spectrum of C 1s for the GO nanosheets, (b) the C 1s spectrum and (c) the Zr 3d spectrum for the rGO/ZrO2 nanocomposite. (d) The corresponding XPS survey spectrum.

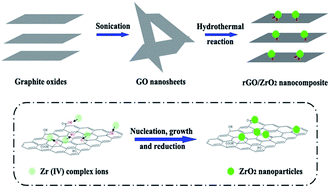
All characterizations clearly confirmed that ZrO2 nanoparticles have been successfully anchored onto the rGO sheets. The synthesis process of the rGO/ZrO2 nanocomposite is schematically illustrated in Fig. 4. When the ZrOCl2 solution was mixed with GO, the wealthy negative charges and the abundant oxygen-containing functional groups at the surface and edges of the GO nanosheets can attract and strongly bond with Zr(IV) complex ions coming from the hydrolysis of the ZrOCl2 precursor, such as [Zr(OH)2·4H2O]48+ and [Zr(OH)2+x·(4 − x)H2O]4(8−4x)+,36,37 which might be physically or chemically adsorbed onto the GO nanosheets. Subsequently, as the whole reaction is carried out, Zr(IV) complex ions transformed into stable ZrO2 nanoparticles by nucleation and further growth, meanwhile, the GO nanosheets were reduced into rGO under the experimental conditions of high temperature and pressure as well as the presence of hydrazine hydrate with excessive alkali. Finally, the ZrO2 nanoparticles were grown uniformly onto the rGO nanosheets to form the composites.


image file: c5ra17440f-f4.tif
Fig. 4 A sketch showing the preparation process of the rGO/ZrO2 nanocomposite. The inset shows the specific integrating process occurring in the hydrothermal reaction.

3.2 Dispersible stability of the rGO/ZrO2 nanocomposite in paraffin oil

In Fig. 5, the dispersion stability of ZrO2, graphite, rGO and the rGO/ZrO2 nanocomposite in paraffin oil is evaluated and compared using the same method. According to the sedimentation curves of different samples ultrasonically dispersed in pure oil (Fig. 5a), the sedimentation rate at which the relative concentration of the samples in oil changes with the settled time is obvious, in particular, the sedimentation of ZrO2 and graphite is remarkably fast. Furthermore, after a long period of settling time (240 min), the relative concentration of the composite is maintained at ∼0.93, which is much higher than the relative concentration of ∼0.76 for rGO. As shown in Fig. 5b, the change is consistent with the optical signal of different samples dispersed in the pure oil at different settling times. At first, the different samples were well dispersed in the pure oil after sonication. After being settled for 48 h, the lubricants containing additives except the rGO/ZrO2 nanocomposite showed obvious precipitation, in other words, the rGO/ZrO2 nanocomposite was still homogeneously dispersed in the oil. Therefore, the photos and sedimentation curves of the different samples illustrate that the dispersion stability of graphene in paraffin oil could be improved by surface modification with inorganic nanoparticles and the method is effective; similarly, the effectiveness was confirmed by the modification of graphene using cerium oxide.38
image file: c5ra17440f-f5.tif
Fig. 5 (a) Dispersion stabilities of the pure oil containing ZrO2, graphite, rGO and rGO/ZrO2 determined by UV-vis spectrophotometry. (b) Optical photos of the above samples dispersed in pure oil at different settling times.

3.3 Tribological properties of the rGO/ZrO2 nanocomposite as a lubricant additive

To study the concentration influence of rGO/ZrO2 on the lubricating properties of paraffin oil, several concentrations of oil mixed with the prepared composite were tested at a constant load of 50 N for 30 min. As shown in Fig. 6a, the COF rose suddenly after about 6 min under the test with the pure oil, which could be ascribed to the fracture of the oil film. However, the stability time of the COF for the base oil had a significant improvement after mixing with a small amount of the nanocomposite (0.01 wt% and 0.03 wt%). Obviously, it can be seen that the effective concentration presented a wider range of 0.06–0.2 wt% with the same average friction coefficient (AFC) value of about 0.118 (in Fig. 6b), which is far below the AFC value of 0.263 for the pure oil. Furthermore, the stability time of the COF for the base oil mixed with the composite was shortened when its concentration in paraffin oil increased up to over 0.2 wt%, indicating that the dispersions were not completely stable throughout the test due to the inhomogeneous lubricant caused by agglomeration.39 It can be concluded that the lubricating property of oil containing the right amount of the rGO/ZrO2 nanocomposite does not decrease, and the lubricating oil film formed on a friction surface is strong enough to support the sliding shear stress. Based on the COF observations of various concentrations of the rGO/ZrO2 nanocomposite in pure oil, the effective concentration of 0.06 wt% was chosen for the following testing.
image file: c5ra17440f-f6.tif
Fig. 6 (a) COF of oil containing different concentrations of the rGO/ZrO2 nanocomposite as a function of time and (b) the corresponding average friction coefficient (AFC) as a function of concentration.

For comparison, Fig. 7 presents the COF and the corresponding AFC as well as the wear volumes of wear tracks on the discs for pure oil, oil containing rGO/ZrO2 and the control samples at the same concentration of 0.06 wt%. Moreover, the corresponding mean area of wear scars for the steel ball, and the wear rates of wear tracks on the discs were calculated and are summarized in Table 1. As shown in Fig. 7a, the stability property of the COF for oil containing the rGO/ZrO2 nanocomposite and rGO nanosheets was similar, and it was smaller and more stable than the pure oil, oil with graphite, ZrO2 and ZDDP (the commercial and frequently used additive). In Fig. 7b, the AFC value of the pure oil is about 0.263, which is much higher than that of the others. In all testing samples, the AFC value of 0.118 for the oil mixed with the rGO/ZrO2 nanocomposite is lowest and is also closer to the AFC value of 0.119 for the oil mixed with rGO nanosheets. In Fig. 7c, the wear volume (1.820 × 105 μm3) and wear rate (33.70 μm3 N−1 m−1) as in Table 1 are the maximum for the test of the pure oil. Moreover, the addition of the ZrO2 nanoparticles has no obvious effect on the reduction of the COF for the pure oil, but it can increase the micro-hardness of the oil film formed between the friction pairs and thus improve the wear resistance of the oil film.40 Obviously, the wear volume of 0.116 × 105 μm3 and the wear rate of 2.15 μm3 N−1 m−1 for the oil containing the rGO/ZrO2 nanocomposite are lower than the values of the wear volume of 0.177 × 105 μm3 and the wear rate of 3.28 μm3 N−1 m−1 for the oil containing rGO nanosheets, and are also the lowest in all the testing samples.


image file: c5ra17440f-f7.tif
Fig. 7 COF of the rGO/ZrO2 nanocomposite and the control samples dispersed in pure oil (0.06 wt%) (a) as a function of time, and the corresponding (b) AFC and (c) the wear volumes of wear tracks on the disc.
Table 1 The mean area of wear scars of the steel balls, wear volumes and wear rates of the discs for all six cases
Test conditions The mean area of wear scars on balls (μm2) Wear volumes on discs (μm3) Wear rates on discs (μm3 N−1 m−1)
Pure oil 1.922 × 10⁵ 1.820 × 10⁵ 33.70
Oil with graphite 1.627 × 10⁵ 0.935 × 10⁵ 17.31
Oil with ZrO2 1.339 × 10⁵ 0.487 × 10⁵ 9.02
Oil with rGO/ZrO2 0.452 × 10⁵ 0.116 × 10⁵ 2.15
Oil with rGO 0.461 × 10⁵ 0.177 × 10⁵ 3.28
Oil with ZDDP 0.565 × 10⁵ 0.214 × 10⁵ 3.96


By comparison, it can be concluded that the lubricant containing various additives can reduce the wear to different degrees. Therein, the oil containing the rGO/ZrO2 nanocomposite presents the optimal tribological properties; namely, the AFC reduced from 0.263 to 0.118 and the wear rate reduced to 6.4% of the pure oil, which can be attributed to the fact that the unique layered structure and small size of the rGO/ZrO2 nanocomposite are convenient for entering the interfaces of the friction pairs, and also the easy shearing under the tribo-stressed zone due to the weak van der Waals interactions between their coordinated lamellas. Besides, the oil containing the rGO/ZrO2 nanocomposite has a high load-bearing capacity preventing the oil film from fracture, and the good dispersion stability of the composite in oil ensures their continuous supply on the tribological interfaces during the test.

After friction testing, the micrographs and wear depths of the different worn tracks characterized by the measurements of OM, SEM and the 3D surface profiler are displayed in Fig. 8. As shown in Fig. 8a1–a3, for the test performed with pure oil alone, the worn surfaces are the roughest with severe scuffing signs as well as wide and deep grooves, and the mean area of the worn scar on the ball is also the largest (1.922 × 105 μm2) in Table 1, which indicates that the boundary lubricating film at the contact surfaces has poor strength. By contrast, all additives used in our experiments can reduce wear to some extent, but the anti-wear ability is different. The additives of ZrO2 and graphite have a poor wear resistance so that the worn tracks are rough and the mean area of the worn scars on the ball are large, although they are lower than that of the pure oil. It is attributed to the fact that the agglomerate blocks of the ZrO2 nanoparticles act as abrasive particles and increase the roughness of the oil film, while the lubricating oil film containing graphite fractures and loses efficacy eventually. For the test performed with ZDDP, the tribological properties are better than the above two kinds of additives, which is attributed to the good lubricating property and load-bearing capacity. Apparently, the worn surfaces seem to be uniform and smooth, and the mean area of the worn scar on the ball is the minimum (0.452 × 105 μm2) in all testing samples for the oil containing the rGO/ZrO2 nanocomposite (in Fig. 8d1–d3). The results suggested that a good surface protective film formed on the frictional interfaces, which is in agreement with the low COF for the oil mixed with the composite. Furthermore, the rGO is also effective in reducing wear but is inferior to the as-prepared composite.


image file: c5ra17440f-f8.tif
Fig. 8 Optical images of the wear surfaces on the balls, SEM micrographs and height profile measurements of the tracks on the counter discs after the friction test for 30 min at 50 N. Lubricated with pure oil (a), graphite (b), ZrO2 (c), rGO/ZrO2 (d), rGO (e) and ZDDP (f) dispersed in pure oil (0.06 wt%), respectively.

To further testify whether the tribological properties of the oil mixed with the prepared composite are better than those of the oil mixed with the rGO nanosheets, two experiments were performed under a high load as shown in Fig. 9. In Fig. 9a, the results display that the COF in sequence rose for the pure oil and oil containing rGO nanosheets after being tested for about 4 and 7 min under a constant load of 100 N, respectively. However, the COF for the oil containing the rGO/ZrO2 nanocomposite is stable and low in the whole test process. Furthermore, the maximum load-bearing capacity of the oil containing the composite could be elevated up to 450 N, although the COF gradually increased after being tested for 15 min at this load (Fig. 9b).


image file: c5ra17440f-f9.tif
Fig. 9 Variations of friction coefficients with time for the oil mixed with the rGO/ZrO2 nanocomposite and the control samples at a concentration of 0.06 wt% (a) under a constant load of 100 N and (b) under a series of constant high loads.

Based on the above research, the excellent tribological properties of the as-prepared rGO/ZrO2 nanocomposite acting as a novel additive in paraffin have been proven. The tribological model of the rGO/ZrO2 nanocomposite in paraffin oil is vividly depicted in Fig. 10. The possible lubricating mechanism can be described as follows: firstly, the ZrO2 nanoparticles anchored onto rGO nanosheets cover up the nanogaps of the rubbing surfaces, which prevents direct contact from friction pairs under contact stress. Moreover, the lamellar structure of the rGO nanosheets forms a conformal protective film between the contact interfaces under the friction stress, and it can provide low resistance for shear which thus results in the reductions of friction and wear.41 Similarly, such a finding was also supported by a formation of a MoS2 transfer film in the contact area, because the structure of MoS2 is similar to that of the graphene.42 In addition, the presence of ZrO2 nanoparticles on the surface of rGO nanosheets acts as a bearing, which contributes to the wear resistance and improves the load-bearing capacity of the lubricant.43 The excellent lubricating properties support the fact that the as-prepared composite is a kind of potential candidate as a lubricant additive in tribology.


image file: c5ra17440f-f10.tif
Fig. 10 The tribological model of the rGO/ZrO2 nanocomposite in paraffin oil.

4. Conclusions

By a one-pot hydrothermal method, we have successfully synthesized the uniformly distributed rGO/ZrO2 nanocomposite by adjusting the precursor proportion of the GO colloidal suspension and ZrOCl2 solution. The combination process of the ZrO2 nanoparticles with rGO nanosheets might be described as follows: the positively charged Zr(IV) complex ions coming from the hydrolysis of the ZrOCl2 solution are adsorbed onto the surface of the negatively charged GO nanosheets by electrostatic attraction, then through nucleation, further growth and reduction during the hydrothermal reaction, finally the nanocomposite of rGO/ZrO2 is formed. As a novel lubricant additive, the as-prepared rGO/ZrO2 nanocomposite has a good dispersion stability in paraffin oil, but also presents excellent friction-reduction and anti-wear properties, which can be attributed to the fact that ZrO2 nanoparticles act as spacers and avoid the re-stacking of rGO nanosheets, as well as the synergetic effect of the lubricating properties from the lamellar structure of rGO and the bearing property of ZrO2. From the test with the oil containing the composite with a concentration of 0.06 wt%, the results showed excellent tribological properties, namely that the AFC reduced from 0.263 to 0.118 and the wear rate reduced to 6.4% of pure oil as well as the load-bearing capacity improving tremendously up to 450 N. The above results suggest that the prepared rGO/ZrO2 nanocomposite is a potential candidate for lubricant additives to improve the tribological properties of oil-based lubricants.

Acknowledgements

This work has been supported by the National Natural Science Foundation of China (Grant No. 51205385 and 51375474), the “Funds for Young Scientists of Gansu Province (145RJYA280)”, and the open foundation of the State Key Laboratory of Solid Lubrication at LICP (LSL-1209).

Notes and references

  1. X. W. Pei, L. T. Hu, W. M. Liu and J. C. Hao, Eur. Polym. J., 2008, 44, 2458–2464 CrossRef CAS PubMed.
  2. S. E. Campbell, G. Luengo, V. I. Srdanov, F. Wudi and J. N. Israelachvili, Nature, 1996, 382, 520–522 CrossRef CAS PubMed.
  3. K. S. Novoselov, A. K. Geim, S. V. Morozov, D. Jiang, Y. Zhang, S. V. Dubonos, I. V. Grigorieva and A. A. Firsov, Science, 2004, 306, 666–669 CrossRef CAS PubMed.
  4. A. K. Geim, Science, 2009, 324, 1530–1534 CrossRef CAS PubMed.
  5. Y. Zhu, S. Murali, W. Cai, X. Li, J. W. Suk, J. R. Potts and R. S. Ruoff, Adv. Mater., 2010, 22, 3906–3924 CrossRef CAS PubMed.
  6. J. Robertson, Mater. Today, 2004, 7, 46–52 CrossRef CAS.
  7. Y. W. Gao and P. Hao, Phys. E, 2009, 41, 1561–1566 CrossRef CAS PubMed.
  8. V. Eswaraiah, V. Sankaranarayanan and S. Ramaprabhu, ACS Appl. Mater. Interfaces, 2011, 3, 4221–4227 CAS.
  9. L. Y. Lin, D. E. Kim, W. K. Kim and S. C. Jun, Surf. Coat. Technol., 2011, 205, 4864–4869 CrossRef CAS PubMed.
  10. M. D. Stoller, S. Park, Y. Zhu, J. An and R. S. Ruoff, Nano Lett., 2008, 8, 3498–3502 CrossRef CAS PubMed.
  11. O. Elomaa, V. K. Singh, A. Lyer, T. J. Hakala and J. Koskinen, Diamond Relat. Mater., 2015, 52, 43–48 CrossRef CAS PubMed.
  12. D. Berman, A. Erdemir and A. V. Sumant, Carbon, 2013, 59, 167–175 CrossRef CAS PubMed.
  13. H. P. Mungse, N. Kumar and O. P. Khatri, RSC Adv., 2015, 5, 25565–25571 RSC.
  14. C. Lee, X. Wei, J. W. Kysar and J. Hone, Science, 2008, 321, 385–388 CrossRef CAS PubMed.
  15. J. H. Ouyang and S. Sasaki, Ceram. Int., 2001, 27, 251–260 CrossRef CAS.
  16. S. C. Moulzolf, R. J. Lad and P. J. Blau, Thin Solid Films, 1999, 347, 220–225 CrossRef CAS.
  17. J. Wang, S. Yang, X. Liu, S. Ren, F. Guan and M. Chen, Appl. Surf. Sci., 2004, 221, 272–280 CrossRef CAS.
  18. S. M. Kwon, S. J. Lee and I. J. Shon, Ceram. Int., 2015, 41, 835–842 CrossRef CAS PubMed.
  19. P. A. K. Rao, S. Singh, B. R. Singh, W. Khan and A. H. Naqvi, J. Environ. Chem. Eng., 2014, 2, 199–210 CrossRef PubMed.
  20. H. Teymourian, A. Salimi, S. Firoozi, A. Korani and S. Soltanian, Electrochim. Acta, 2014, 143, 196–206 CrossRef CAS PubMed.
  21. H. Q. Li, Y. T. Xie, K. Li, L. P. Wang and X. B. Zheng, et al. , Ceram. Int., 2014, 40, 12821–12829 CrossRef CAS PubMed.
  22. Y. Xu, H. Bai, G. Lu, C. Li and G. Shi, J. Am. Chem. Soc., 2008, 130, 5856–5857 CrossRef CAS PubMed.
  23. H. J. Song, X. H. Jia, N. Li, X. F. Yang and H. Tang, J. Mater. Chem., 2012, 22, 895–902 RSC.
  24. Z. S. Wu, D. W. Wang, W. C. Ren, J. P. Zhao, G. G. Zhou, F. Li and H. M. Cheng, Adv. Funct. Mater., 2010, 20, 3595–3602 CrossRef CAS PubMed.
  25. Y. Zhang, H. Tang, X. R. Ji, C. S. Li, L. Chen, D. Zhang, X. F. Yang and H. T. Zhang, RSC Adv., 2013, 3, 26086–26093 RSC.
  26. S. Park, J. An, I. Jung, R. D. Piner, S. J. An, X. Li, A. Velamakanni and R. S. Ruoff, Nano Lett., 2009, 9, 1593–1597 CrossRef CAS PubMed.
  27. S. K. Maity, M. S. Rana, B. N. Srinivas, S. K. Bej, G. M. Dhar and T. S. R. Prasada Rao, J. Mol. Catal. A: Chem., 2000, 153, 121–127 CrossRef CAS.
  28. S. F. Wang, F. Gu, M. K. Lü, Z. S. Yang, G. J. Zhou, H. P. Zhang, Y. Y. Zhou and S. M. Wang, Opt. Mater., 2006, 28, 1222–1226 CrossRef CAS PubMed.
  29. M. Acik, G. Lee, C. Mattevi, A. Pirkle, R. M. Wallace, M. Chhowalla, K. Cho and Y. Chabal, J. Phys. Chem. C, 2011, 115, 19761–19781 CAS.
  30. H. P. Mungse and O. P. Khatri, J. Phys. Chem. C, 2014, 118, 14394–14402 CAS.
  31. Q. Huang and L. Gao, J. Mater. Chem., 2003, 13, 1517–1519 RSC.
  32. H. J. Song, X. H. Jia, N. Li, X. F. Yang and H. Tang, J. Mater. Chem., 2012, 22, 895–902 RSC.
  33. S. Stankovich, R. D. Piner, X. Q. Chen, N. Q. Wu, S. B. T. Nguyen and R. S. Ruoff, J. Mater. Chem., 2006, 16, 155–158 RSC.
  34. R. J. Waltman, J. Pacansky and C. W. Bates Jr, Chem. Mater., 1993, 5, 1799–1804 CrossRef CAS.
  35. XPS Handbook of the Elements and Native Oxides, XPS International Inc., 1999, http://www.xpsdata.com/PDF/zr-no.pdf Search PubMed.
  36. K. Matsui and M. Ohgai, J. Am. Ceram. Soc., 2001, 84, 2303–2312 CrossRef CAS PubMed.
  37. K. Matsui and M. Ohgai, J. Am. Ceram. Soc., 2000, 83, 1386–1392 CrossRef CAS PubMed.
  38. G. Y. Bai, J. Q. Wang, Z. G. Yang, H. G. Wang, Z. F. Wang and S. R. Yang, RSC Adv., 2014, 4, 47096–47105 RSC.
  39. V. K. Singh, O. Elomaa, L. S. Johansson, S. P. Hannula and J. Koskinen, Carbon, 2014, 79, 227–235 CrossRef CAS PubMed.
  40. S. Sharma, Int. J. Adv. Des. Manuf. Technol., 2012, 61, 889–900 CrossRef.
  41. D. Berman, A. Erdemir and A. V. Sumant, Carbon, 2013, 54, 454–459 CrossRef CAS PubMed.
  42. M. Praveena, C. D. Bain, V. Jayaram and S. K. Biswas, RSC Adv., 2013, 3, 5401–5411 RSC.
  43. V. K. Singh, O. Elomaa, L. S. Johansson, S. P. Hannula and J. Koskinen, Carbon, 2014, 79, 227–235 CrossRef CAS PubMed.

Footnote

Electronic supplementary information (ESI) available. See DOI: 10.1039/c5ra17440f

This journal is © The Royal Society of Chemistry 2015
Click here to see how this site uses Cookies. View our privacy policy here.