Anatase TiO2 nanoparticles with controllable crystallinity as a substrate for SERS: improved charge-transfer contribution

Mengdi Gong a, Xin Jianga, Juan Dua, Xiuling Lia, Xiaoxia Hanb, Libin Yang*a and Bing Zhao*b
aCollege of Pharmacy, Jiamusi University, Jiamusi 154007, People's Republic of China. E-mail: ylb76@163.com
bState Key Laboratory of Supramolecular Structure and Materials, Jilin University, Changchun 130012, People's Republic of China. E-mail: zhaob@mail.jlu.edu.cn

Received 25th August 2015 , Accepted 17th September 2015

First published on 17th September 2015


Abstract

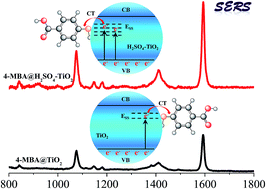
In this paper, TiO2 nanoparticles (NPs) in the anatase phase were synthesized by a very simple sol-hydrothermal method with the assistance of H2SO4. And importantly, the crystallinity and the surface defects (surface state) of anatase TiO2 NPs can be regulated and controlled by this means for improving their SERS performances. The 4-MBA molecule adsorbed on 0.14 mL-H2SO4–TiO2 NPs exhibits the highest SERS enhancement, as compared with the native enhancement on unmodified TiO2 NPs. The introduction of H2SO4 not only enriches the surface defects of anatase TiO2 and the adsorption site, but also improves the separation efficiency of photo-generated carriers, which all can promote the TiO2-to-molecule charge transfer and are mainly responsible for the improved SERS performances.


1. Introduction

As a highly sensitive and reliable analytical tool, surface-enhanced Raman scattering (SERS) has attracted increasing attention and exhibited broad application prospects in various fields, since its discovery in 1974.1 At present, SERS-active substrates have been extended into the semiconductor material field, especially wide band gap semiconductor materials (ZnO,2 ZnS3 and TiO2 (ref. 4–12) etc.), which previously have been restricted to noble metals and transition metals.13–16 SERS research based on semiconductors is worthy and meaningful, despite the fact that the enhancement capacity of semiconductor SERS substrates is weaker than that of metals. This undertaking not only can develop SERS theory and novel SERS-active substrates, but also can broaden the application area of SERS. But right now, semiconductor-based SERS research is still in its primary stage, the further deep explores on the diversiform style high active substrates and their enhancement mechanism need yet to be developed urgently.

Titanium dioxide (TiO2), a typical wide band gap semiconductor, is one of the most prominent oxide materials owing to its excellent physical and chemical performances,17 which is widely applied to environmental cleanup, photocatalysis, and solar cells fields etc. TiO2 has three naturally occurring crystalline forms of anatase, rutile, and brookite due to the different connection types of TiO6 octahedron. Among the three crystal structures, although anatase is metastable crystalline phase, anatase phase is found to be the most active crystal phase and has caused the extensive concern.18 In the past few years, SERS from molecules adsorbed on surfaces of wide-band-gap semiconductor TiO2 nanoparticles (NPs), in particular the anatase TiO2 NPs, has attracted increasing attention due to its extensive applications in many important fields. Our group studied the Raman scattering of molecules adsorbed on anatase TiO2 NPs for the first time and discovered that the semiconductor (TiO2)-to-molecule charge transfer (CT) mechanism related to the surface state energy level of TiO2 NPs is the main contribution of SERS enhancement.4,5 Rajh et al.8,9 and Mujica et al.10–12 studied SERS spectra of enediol molecules adsorbed on the surface of anatase TiO2 NPs by extensive experimental and computational method, respectively. Xue et al.19 studied the size-dependent SERS effect of anatase TiO2 NPs. In our recent publications on SERS of different phase structure TiO2 NPs, it is demonstrated that anatase phase structure TiO2 possessed relatively high surface defect and subsequently brought about higher SERS enhancement for adsorbed molecules.20,21 These show that both the crystal structure (crystallinity) and the surface properties of TiO2 NPs are crucial important for their SERS property. Actually, in the past other studies, the researchers have paid great attention to improving the crystallinity and the surface states of anatase TiO2 for their higher photophysical and photochemical performances by the various modified methods.22–28

Herein, thermally stable TiO2 NPs in anatase phase have been synthesized by a very simple sol-hydrothermal method with the assistance of H2SO4 additive, the highest thermally stable temperature of anatase TiO2 NPs can be maintained up to 700 °C. More importantly, the crystallinity and the surface defect (surface state) of the anatase TiO2 NPs can be regulated and controlled by this means for improving their SERS property. This work is expected to be valuable for not only controllable synthesis of anatase TiO2 NPs but also improving SERS performances of TiO2 SERS-active substrate and its practical application.

2. Experimental section

2.1 Chemicals

4-Mercaptobenzoic acid (4-MBA) was purchased from Acros Organics Chemical Co. and used as received without further purification. The other chemicals were all analytical grade without further purification, too. Triply distilled water was used in all experiments.

2.2 Sample preparation

The sol-hydrothermal procedure is a typical, frequently-used method for preparation of TiO2 nanomaterials due to its simple, convenient, low-cost advantages. In this work, TiO2 NPs were synthesized by employing a simple improved sol-hydrothermal method with the assistance of H2SO4 additive. First, a mixed solution of 15 mL of tetrabutyl titanate and 15 mL of anhydrous ethanol was added dropwise into another mixed solution, consisting of 60 mL of anhydrous ethanol, 15 mL of water, 3 mL of 70% nitric acid, and a certain amount of sulfuric acid (H2SO4, 98%), at room temperature under rough stirring to carry out hydrolysis. The amount of H2SO4 was 0.06, 0.08, 0.10, 0.12, 0.14, 0.16 and 0.18 mL, respectively (the maximum allowed additive amount of H2SO4 is 0.18 mL, when the H2SO4 amount is more than 0.18 mL, i.e. 0.2 mL, the solution will quickly turn into white precipitates). Subsequently, the yellowish transparent sol was obtained by continuously stirring for 1 h. The as-prepared sol was kept at 160 °C for 6 h in a stainless-steel vessel, and then cooled to room temperature. The sol-hydrothermal production was dried at 80 °C for 24 h. Finally, the pure TiO2 NPs and different amount H2SO4-modified TiO2 (H2SO4–TiO2) NPs were obtained by calcining the sol-hydrothermal production at different temperature points (400, 450, 500, 550, 600, 650, 700 and 750 °C) for 2 h.

TiO2 nanocrystals surface-modified by 4-MBA molecules were obtained as follows: firstly, the pure TiO2 and different H2SO4–TiO2 NPs were rinsed with triply distilled water twice and then anhydrous ethanol once more, and dried at room temperature. Secondly, 20 mg of as-prepared TiO2 NPs were dissolved in 10 mL of 4-MBA (1 × 10⁻³ M) ethanol solution, and the mixture was stirred for 2 h. Finally, the precipitates were centrifuged, rinsed with anhydrous ethanol once more, and dried under vacuum. In this way, different TiO2 NPs surface-modified by 4-MBA molecules were obtained.

2.3 Sample characterization

The crystal structure of TiO2 samples were determined by X-ray diffraction (XRD) using a Siemens D5005 X-ray powder diffractometer with a Cu Kα radiation source at 40 kV and 30 mA. The element composition and chemical state of samples were analyzed by X-ray photoelectron spectroscopy (XPS) with a VG ESCALAB MK II X-ray photoelectron energy spectrometer. The surface morphology of the sample was measured on a JEM-2100 transmission electron microscope (TEM) operated at an acceleration voltage of 200 kV. The UV-vis diffuse reflectance spectra (UV-vis DRS) were recorded on a Lambda UV-950 UV-vis spectrometer; the absorbance (α) was obtained by the equation α = 100 − R, herein R is the reflectance. Raman spectra were obtained by using a LabRam Aramis Raman Microscope system (Horiba-Jobin Yvon) equipped with a multichannel air cooled charge-coupled device (CCD) detector and a temperature controlled charged coupled device detector (∼70 °C). The 633 nm radiation from a HeNe narrow bandwidth laser (Melles Griot) was used as exciting source. The exposure time for each measurement was 15 s with two times accumulation.

3. Results and discussion

3.1 The characterization of anatase TiO2 NPs with controllable crystallinity and their synthesis mechanism

XRD was used to investigate the crystal phase structure, thermal stability and crystallinity of the as-prepared TiO2 NPs. Usually, the XRD peaks at 2θ = 25.3° (101) (JCPDS, no. 21-1272) and 2θ = 27.4° (110) (JCPDS, no. 21-1272) are identified as the characteristic diffraction peaks of anatase and rutile crystal phase of TiO2, respectively. Fig. 1A reveals that the pure TiO2 sample (i.e. the sample without H2SO4 addition) exhibited a pure anatase phase when the calcination temperature was 400 and 450 °C. However, there was a small amount of rutile phase appearing when the calcination temperature raised to 500 °C, indicating that the phase of some TiO2 particles has transformed from anatase to rutile at this point. Very interestingly, the anatase phase exhibited a higher thermal stability once the small amount of H2SO4 was added into the sample in the process of preparation. For the sample with 0.06 mL of H2SO4 addition (the 0.06 mL-H2SO4–TiO2), it can be seen from Fig. 1B that the sample still exhibited a pure anatase phase when the calcination temperature was 600 °C. Only when the calcination temperature was 650 °C, there was a considerable amount of rutile phase appearing in the sample. It means that the temperature of TiO2 phase transfer from anatase to rutile has been raised, which indicates that the addition of H2SO4 can inhibit the phase transfer of TiO2. And, with the increase of addition amount of H2SO4, the temperature of TiO2 phase transfer also increased gradually (Fig. 1C and D). When the addition amount of H2SO4 reached to maximum allowed volume (0.18 mL), the thermally stable temperature of anatase phase could be maintained up to 700 °C (Fig. 1D). Furthermore, it can also be seen from Fig. 1 that, the (101) diffraction peaks of anatase TiO2 increase in intensity and narrow in width with the increase of calcination temperature for all samples, indicating that the crystallinity of anatase TiO2 also increases gradually. So, it is feasible and practical to achieve the anatase phase TiO2 NPs with high crystallinity by this means. In addition, it can also be found from Fig. 1 that the characteristic diffraction peaks of H2SO4–TiO2 show slight shift toward lower 2θ diffraction angle compared with the pure TiO2 sample, and the shift degree increases gradually. This should be ascribed to the addition of H2SO4 so that the SO42− ions maybe entered into the crystal lattice of TiO2 to substitute for O2− ions, which leaded to lattice distortion of TiO2 NPs. It can be further confirmed by following XPS measurement. The peak shift toward lower 2θ diffraction angle should be from the increase in the interplanar distance according to the Bragg equation (2d[thin space (1/6-em)]sin[thin space (1/6-em)]θ = ), due to the larger radius of SO42− ion than that of O ion.
image file: c5ra17176h-f1.tif
Fig. 1 XRD patterns of pure TiO2 and different H2SO4–TiO2 nanoparticles ((A): the pure TiO2; (B): the 0.06 mL-H2SO4–TiO2; (C): the 0.14 mL-H2SO4–TiO2; (D): the 0.18 mL-H2SO4–TiO2) calcined at different temperatures.

Fig. 2 shows the XPS spectra of pure TiO2 and 0.14 mL-H2SO4–TiO2 samples calcined at 450 °C. In the XPS spectrum of S2p, H2SO4–TiO2 sample shows a single doublet at 169.1 and 170.3 eV, with a splitting spacing of 1.2 eV, which is attributed to the S6+, indicating that the S element in H2SO4–TiO2 is present in the form of SO42−.29 This can be verified by the O1s spectrum, in which H2SO4–TiO2 shows two contributions at 529.5 and 531.2 eV. The peak at 529.5 eV can be ascribed to lattice oxygen in TiO2, while the signal at ca. 531.2 eV can be assigned to oxygen in sulfate group.29 The XPS spectra of Ti2p show that the Ti2p3/2 and Ti2p1/2 binding energy peaks of H2SO4–TiO2 occur at 458.6 and 464.4 eV, respectively, attributed to Ti4+ ion, which slightly shift to lower binding energy compared with that of pure TiO2 sample (458.9 and 464.6 eV). This shift reveals that the chemical environment of Ti in TiO2 lattice has changed due to the loading of SO42−. In our opinion, the SO42− group might coordinate to Ti4+ ion by substituting for some lattice O2− in H2SO4–TiO2 sample, which could lead to the increase in the outer electron cloud density of Ti due to the lower electronegativity of SO42− than O2− and subsequent decrease in the binding energy. Just due to the loading of SO42−, the slight lattice distortion in H2SO4–TiO2 has happened and results in the shift of diffraction peaks as shown in XRD measurement.


image file: c5ra17176h-f2.tif
Fig. 2 XPS spectra of pure TiO2 and H2SO4–TiO2 samples calcined at 450 °C ((A): S2p; (B): O1s; and (C): Ti2p).

TEM and HRTEM images of pure TiO2 and different H2SO4–TiO2 calcined at 700 °C are shown Fig. 3. All samples are spherical and dispersed homogeneously. The HRTEM demonstrate that the pure TiO2 sample calcined at 700 °C exhibits a pure rutile phase, the 0.06 mL-H2SO4–TiO2 and 0.14 mL-H2SO4–TiO2 samples exhibit a mixed crystal phase structure of anatase and rutile, whereas the 0.18 mL-H2SO4–TiO2 sample calcined at 700 °C exhibits a pure anatase phase, due to the (101) plane of anatase (d = 0.35 nm) and the (110) plane of rutile (d = 0.32 nm). For H2SO4–TiO2 samples, the anatase phase exhibits a higher thermal stability. With the increase of addition amount of H2SO4, the temperature of TiO2 phase transfer from anatase to rutile also increases gradually. The observations of HRTEM are consistent with the XRD results.


image file: c5ra17176h-f3.tif
Fig. 3 TEM and HRTEM images of pure TiO2 and different H2SO4–TiO2 ((A): the pure TiO2; (B): the 0.06 mL-H2SO4–TiO2; (C): the 0.14 mL-H2SO4–TiO2; (D): the 0.18 mL-H2SO4–TiO2) calcined at 700 °C.

Why the H2SO4–TiO2 samples show a higher thermal stability in the anatase phase? What is the synthesis mechanism? Combining the above test results, the following several aspects should be considered to explain it. We know that in the sol-hydrothermal procedure without H2SO4 addition, the tetrabutyl titanate used as Ti source is hydrolyzed and polymerized to form a spatial network structure by the combination of Ti4+ and OH (Fig. 4). As a result of H2SO4 addition in the sol-hydrothermal procedure, however, the sulfate radical (SO42−) could serve as a like bidentate ligand to bond to some Ti4+ ions by substituting for some OH. Accordingly, the connection mode between Ti and O by Ti–O–Ti was partly turned into Ti–O–S–O–Ti mode (Fig. 4). It means that the added SO42− entered into the crystal lattice of TiO2 to substitute for some O2− ions. The loading of SO42− effectively inhibited the phase transfer of TiO2 from anatase to rutile due to the steric hindrance effect of SO42− so that the anatase phase showed a higher thermal stability. Similar study has previously been reported.30 Zhang et al.30 synthesized nanosized TiO2 with the different crystal phase structure by TiCl4 hydrolysis, in which the (NH4)2SO4 was employed to avoid the presence of rutile phase for preparation of pure anatase.


image file: c5ra17176h-f4.tif
Fig. 4 Scheme for sulfate effect on formation of anatase TiO2.

Since the addition of H2SO4 can greatly inhibit the phase transfer of TiO2, we think whether the addition of H2SO4 can also regulate the surface performance (surface defect) of anatase by the control of its crystallinity. Fig. 5 shows the XRD patterns of pure TiO2 and different H2SO4–TiO2 samples calcined at 450 °C. All samples exhibit an pure anatase phase. Compared with the pure TiO2, the (101) diffraction peaks of all H2SO4–TiO2 NPs decrease in the intensity and broaden in the width. And, this changing degree enhances gradually with the increase of addition amount of H2SO4, indicating that the crystallinity of anatase TiO2 decreases and the crystalline size also decreases {the crystallite size D can be determined from the half band width (β) of the (101) peak by the Scherrer formula: D = /(β[thin space (1/6-em)]cos[thin space (1/6-em)]θ) (ref. 30)}. It means that the content of surface defect of anatase TiO2 as well as its surface area increases gradually. This can be ascribed to the slight inhibition effect of loaded SO42− on the growth of TiO2 crystal during the thermal treatment process. The results of XRD can be further verified by measurement of UV-vis DRS. Fig. 6 shows the UV-vis DRS spectra of pure TiO2 and different H2SO4–TiO2 samples calcined at 450 °C. All samples exhibit a wide optical absorption in the range below 410 nm, which is attributed to the band–band electron transition of the anatase TiO2 nanocrystals according to its band gap energy ca. 3.2 eV. It can be seen that the photoabsorption thresholds of band–band transition of all H2SO4–TiO2 samples exhibit a blue shift as compared with pure TiO2 without H2SO4 addition. And, the blue-shifted degree also increases gradually with the increase of addition amount of H2SO4. This can be attributed to the quantum size effect, i.e., with the increase of H2SO4, the crystalline size of H2SO4–TiO2 samples decreases, the effective band gap of TiO2 nanocrystals increases, which can result in a blue shift of the band–band photoabsorption threshold.31


image file: c5ra17176h-f5.tif
Fig. 5 XRD patterns of pure TiO2 and different H2SO4–TiO2 nanoparticles calcined at 450 °C.

image file: c5ra17176h-f6.tif
Fig. 6 UV-vis DRS spectra of pure TiO2 and different H2SO4–TiO2 samples calcined at 450 °C (the inset is the magnified UV-vis DRS spectra between 370 and 413 nm).

Such is the case that, by the simple sol-hydrothermal method with the assistance of H2SO4, not only highly thermal stable and highly crystalline anatase TiO2 NPs can be synthesized, but also the crystallinity and the surface defect (surface state) of anatase TiO2 NPs can be regulated and controlled by simply controlling addition amount of H2SO4.

3.2 SERS spectra of 4-MBA adsorbed on different TiO2 NPs and their enhancement mechanism

Fig. 7 shows SERS spectra of 4-MBA adsorbed on pure TiO2 NPs without H2SO4 addition calcined at different temperatures. All Raman peaks are characteristic SERS signals of 4-MBA molecules on the TiO2 substrates. The strong bands at about 1594 and 1078 cm−1 are assigned to ν8a (a1) and ν12 (a1) aromatic ring characteristic vibrations, respectively. The weak bands at about 1148 (ν15, b2) and 1182 cm−1 (ν9, a1) are attributed to the C–H deformation modes. They are consistent with those previous reports,4,5 which have been attributed to the dominant contribution of the TiO2-to-molecule CT mechanism (electrons in valence band of TiO2 are excited to surface state energy levels by the incident light with the sub-band-gap energy and then inject into the LUMO of the adsorbed molecules). Interestingly, it can be observed in Fig. 7 that 4-MBA adsorbed on TiO2 NPs calcined at 450 °C exhibits the maximum SERS enhancement, which is obviously higher than those adsorbed on the substrates calcined at 400 and 500 °C. The XRD results (Fig. 1A) show that the crystallinity and the particle size of TiO2 NPs increase with the increase of calcination temperature, which can bring on a decrease in the surface defect content and the surface area of TiO2 NPs.19 For TiO2 NPs substrate, the surface area has a less effect on the SERS enhancement of surface-adsorbed molecules.4 Thus, the crystallinity (surface defect content) of TiO2 NPs may well play a key role for SERS enhancement of surface-adsorbed 4-MBA molecules. TiO2 NPs calcined at 400 °C are the anatase phase, forming from the transformation of brookite phase, which possess the lower crystallinity. So, it is not favorable to SERS enhancement of the adsorbed molecules. When the calcination temperature increases to 500 °C, however, the anatase TiO2 NPs start to transform into the rutile phase (Fig. 1A). At this temperature point, the surface defect content of TiO2 NPs starts to decrease obviously. According to the TiO2-to-molecule CT mechanism, the lower surface defect content is also not favorable to SERS enhancement of the adsorbed molecules. So, the appropriate anatase crystallinity and the abundant surface defect content are all crucial important for SERS enhancement of anatase TiO2 NPs.
image file: c5ra17176h-f7.tif
Fig. 7 SERS spectra of 4-MBA adsorbed on pure TiO2 nanoparticles calcined at different temperatures.

Since such is the case, the H2SO4–TiO2 NPs with controllable crystallinity should be able to be served as substrates for further improvement of their SERS property. Fig. 8 shows SERS spectra of 4-MBA adsorbed on different TiO2 NPs calcined at 450 °C. Very encouragingly, compared with the native SERS enhancement on the pure TiO2 NPs, the SERS signals of 4-MBA adsorbed on all H2SO4–TiO2 substrates exhibit a higher enhancement. In order to observe the H2SO4-dependent tendency more clearly, the plot of the characteristic SERS signal intensity of 4-MBA at 1594 cm−1 versus the addition amount of H2SO4 is shown in Fig. 9. It can be found from Fig. 8 and 9 that the SERS signal intensities of 4-MBA increase firstly and then decrease with the increase of H2SO4. The maximum SERS enhancement of 4-MBA can be received when the addition amount of H2SO4 is 0.14 mL (the particle size is about 6.33 nm).


image file: c5ra17176h-f8.tif
Fig. 8 SERS spectra of 4-MBA adsorbed on different H2SO4–TiO2 nanoparticles calcined at 450 °C.

image file: c5ra17176h-f9.tif
Fig. 9 The plot of the SERS signal intensity of 4-MBA at 1594 cm−1 versus the addition amount of H2SO4 (each point represents an average value from three measurements and the error bars indicate standard deviation).

It can be known from the XRD measurements (Fig. 5) that the content of surface defect of anatase TiO2 as well as its surface area increases with the increase of addition amount of H2SO4. The increase of surface defect content of anatase is mainly responsible for the higher SERS property of H2SO4–TiO2 according to the TiO2-to-molecule CT mechanism. The improved SERS property cannot be attributed to the increase of their surface area, because the 0.16 mL-H2SO4–TiO2 and 0.18 mL-H2SO4–TiO2 possess larger surface area but exhibit lower SERS enhancement than the 0.14 mL-H2SO4–TiO2. And, it is also concluded from Fig. 8 and 9 that the crystallinity (the surface defect content) of anatase TiO2, for SERS enhancement of the surface-adsorbed molecules, is a “double-edged sword”. It is vitally important for SERS enhancement that the anatase TiO2 NPs are provided with well crystallinity and simultaneously higher surface defect content, which can be achieved by controlling a suitable addition amount of H2SO4 (0.14 mL) in the present study. When the addition amount of H2SO4 increases continually to exceed 0.14 mL (i.e. 0.16 and 0.18 mL), even if the substrates possess higher surface defect content, they still exhibit lower SERS enhancement than the 0.14 mL-H2SO4–TiO2 due to the excessive decrease in their crystallinity. In previous report about the size-dependent SERS effect for ZnO NPs, Sun et al.2 discovered that the ZnO NPs with the moderate particle size (27.7 nm) could exhibit the most powerful enhancement effect on the surface-adsorbed molecules. In their work, the moderate particle size (27.7 nm) is likely similar to the “double-edged sword” role of the crystallinity (the surface defect content) of anatase TiO2 in this work.

Moreover, it is worthy to note that, as a result of H2SO4 addition, the Brønsted acidic sites and the Lewis acidic sites can be formed on the surface of anatase TiO2 NPs (as shown in Fig. 10). The Lewis acidic sites can be attributed to the coordination between SO42− and Ti4+ in the network, in which the existence of S[double bond, length as m-dash]O covalent bonds is the important source for generating the Lewis acidic sites.32–34 On the one hand, these acidic sites are beneficial for the adsorption of 4-MBA molecules on substrate surface due to the electrostatic attraction interaction, since the 4-MBA molecules bond to the TiO2 by their mercapto groups.4,5 On the other hand, these acidic sites serve as the photo-induced electron capturer to improve the effective separation of photo-generated carriers,35,36 which can promote the TiO2-to-molecule CT due to the stronger electron-attracting ability of carboxyl group (4-MBA) para to the mercapto group bonded with the TiO2 surface. All these can provide an additional TiO2-to-molecule CT besides the intrinsic TiO2 (anatase)-to-molecule CT, which is also responsible for those additional SERS enhancement in present system.


image file: c5ra17176h-f10.tif
Fig. 10 Schematic representation of the Brønsted and Lewis acid sites present in the H2SO4–TiO2.

4. Conclusion

In this work, highly thermal stable TiO2 NPs in anatase phase have been synthesized by a very simple sol-hydrothermal method with the assistance of H2SO4, the highest thermal stable temperature of anatase TiO2 NPs can be maintained up to 700 °C. This is attributed to the inhibition effect of the loaded SO42− in TiO2 crystal lattice on the phase transfer of TiO2 from anatase to rutile. And, the crystallinity and the surface defect (surface state) of anatase TiO2 NPs can be regulated and controlled by this means. SERS performances of anatase TiO2 NPs can be significantly improved by addition of H2SO4. The 4-MBA molecules adsorbed on 0.14 mL-H2SO4–TiO2 NPs exhibit the highest SERS enhancement, as compared with the native enhancement of 4-MBA adsorbed on unmodified TiO2 NPs. The introduction of H2SO4 not only enriches the surface defect (surface state) of anatase TiO2 and the adsorption site, but also improves the separation efficiency of photo-generated carriers, which all can promote the TiO2-to-molecule CT and are mainly responsible for the improved SERS performances.

Acknowledgements

The research was supported by National Natural Science Foundation of China (21473078, 21273091, 21327803), Natural Science Foundation of Heilongjiang Province of China (B201418), Program for New Century Excellent Talents in Heilongjiang Provincial University (1253-NCET-023), Postdoctoral Science Foundation of China (2015M570268), National Undergraduate Training Programs for Innovation and Entrepreneurship (201410222021), Postgraduate Scientific Research Innovation Project of Jiamusi University (LM2014_067).

References

  1. M. Fleischman, P. J. Hendra and A. McQuillan, Chem. Phys. Lett., 1974, 26, 163–166 CrossRef.
  2. Z. H. Sun, B. Zhao and J. R. Lombardi, Appl. Phys. Lett., 2007, 91, 221106 CrossRef PubMed.
  3. Y. F. Wang, Z. H. Sun, H. L. Hu, S. Y. Jing, B. Zhao, W. Q. Xu, C. Zhao and J. R. Lombardi, J. Raman Spectrosc., 2007, 38, 34–38 CrossRef CAS PubMed.
  4. L. B. Yang, X. Jiang, W. D. Ruan, B. Zhao, W. Q. Xu and J. R. Lombardi, J. Phys. Chem. C, 2008, 112, 20095–20098 CAS.
  5. L. B. Yang, X. Jiang, W. D. Ruan, B. Zhao, W. Q. Xu and J. R. Lombardi, J. Raman Spectrosc., 2009, 40, 2004–2008 CrossRef CAS PubMed.
  6. L. B. Yang, X. Jiang and M. Yang, Appl. Phys. Lett., 2011, 99, 111114 CrossRef PubMed.
  7. L. B. Yang, X. Y. Qin, M. D. Gong, X. Jiang, M. Yang, X. L. Li and G. Z. Li, Spectrochim. Acta, Part A, 2014, 123, 224–229 CrossRef CAS PubMed.
  8. A. Musumeci, D. Gosztola, T. Schiller, N. M. Dimitrijevic, V. Mujica, D. Martin and T. Rajh, J. Am. Chem. Soc., 2009, 131, 6040–6041 CrossRef CAS PubMed.
  9. S. J. Hurst, H. Christopher Fry, D. J. Gosztola and T. Rajh, J. Phys. Chem. C, 2011, 115, 620–630 CAS.
  10. P. Tarakeshwar, D. Finkelstein-Shapiro, S. J. Hurst, T. Rajh and V. Mujica, J. Phys. Chem. C, 2011, 115, 8994–9004 CAS.
  11. D. Finkelstein-Shapiro, P. Tarakeshwar, T. Rajh and V. Mujica, J. Phys. Chem. B, 2010, 114, 14642–14645 CrossRef CAS PubMed.
  12. P. Tarakeshwar, D. Finkelstein-Shapiro, T. Rajh and V. Mujica, Int. J. Quantum Chem., 2011, 111, 1659–1670 CrossRef CAS PubMed.
  13. B. Ren, X. F. Lin, Z. L. Yang, G. K. Liu, R. F. Aroca, B. W. Mao and Z. Q. Tian, J. Am. Chem. Soc., 2003, 125, 9598–9599 CrossRef CAS PubMed.
  14. A. V. Whitney, B. D. Myers and R. P. van Duyne, Nano Lett., 2004, 4, 1507–1511 CrossRef CAS.
  15. C. L. Haynes and R. P. van Duyne, Nano Lett., 2003, 3, 939–943 CrossRef CAS.
  16. Z. Q. Tian, B. Ren, J. F. Li and Z. L. Yang, Chem. Commun., 2007, 3514–3534 RSC.
  17. Y. Xie, G. Ali, S. H. Yoo and S. O. Cho, ACS Appl. Mater. Interfaces, 2010, 10, 2910–2914 Search PubMed.
  18. M. Kapilashrami, Y. Zhang, Y. Liu, A. Hagfeldt and J. Guo, Chem. Rev., 2014, 114, 9662–9707 CrossRef CAS PubMed.
  19. X. X. Xue, W. Ji, Z. Mao, H. J. Mao, Y. Wang, X. Wang, W. D. Ruan, B. Zhao and J. R. Lombardi, J. Phys. Chem. C, 2012, 116, 8792–8797 CAS.
  20. L. B. Yang, M. D. Gong, X. Jiang, D. Yin, X. Y. Qin, B. Zhao and W. D. Ruan, J. Raman Spectrosc., 2015, 46, 287–292 CrossRef CAS PubMed.
  21. L. B. Yang, X. Y. Qin, X. Jiang, M. D. Gong, D. Yin, Y. J. Zhang and B. Zhao, Phys. Chem. Chem. Phys., 2015, 17, 17809–17815 RSC.
  22. K. N. P. Kumar, K. Keizer, A. J. Burggraaf, T. Okubo, H. Nagamoto and S. Morooka, Nature, 1992, 358, 48–51 CrossRef CAS PubMed.
  23. J. G. Li, T. Ishigaki and X. D. Sun, J. Phys. Chem. C, 2007, 111, 4969–4976 CAS.
  24. R. L. Penn and J. F. Banfield, Am. Mineral., 1998, 83, 1077–1082 CAS.
  25. K. Tanaka, M. F. V. Capule and T. Hisanaga, Chem. Phys. Lett., 1991, 187, 73–76 CrossRef CAS.
  26. G. H. Tian, H. G. Fu, L. Q. Jing, B. F. Xin and K. Pan, J. Phys. Chem. C, 2008, 112, 3083–3089 CAS.
  27. R. Zhang, B. To and D. Zhao, Chem.–Eur. J., 2010, 16, 9977–9981 CrossRef CAS PubMed.
  28. W. Zhou, F. F. Sun, K. Pan, G. H. Tian, B. J. Jiang, Z. Y. Ren, C. G. Tian and H. G. Fu, Adv. Funct. Mater., 2011, 21, 1922–1930 CrossRef CAS PubMed.
  29. G. Colon, M. C. Hidalgo, G. Munuera, I. Ferino, M. G. Cutrufello and J. A. Navio, Appl. Catal., B, 2006, 63, 45–59 CrossRef CAS PubMed.
  30. Q. H. Zhang, L. Gao and J. K. Guo, Appl. Catal., B, 2000, 26, 207–215 CrossRef CAS.
  31. J. Ma, J. Chu, L. Q. Qiang and J. Q. Xue, Int. J. Photoenergy, 2013, 2013, 875456 Search PubMed.
  32. H. X. Li, G. S. Li, J. Zhu and Y. Wan, J. Mol. Catal. A: Chem., 2005, 226, 93–100 CrossRef CAS PubMed.
  33. T. Jin, M. Machida, T. Yamaguchi and K. Tanabe, Inorg. Chem., 1984, 23, 4396–4398 CrossRef CAS.
  34. L. D. Zhang and C. M. Mou, Nanostruct. Mater., 1995, 6, 831–834 CrossRef.
  35. S. Yamazaki, N. Fujinaga and K. Araki, Appl. Catal., A, 2003, 210, 97–102 CrossRef.
  36. R. A. Young and P. Desai, Arch. Nauki Mater., 1989, 10, 71–90 Search PubMed.

Footnote

These authors made equal contributions to this work.

This journal is © The Royal Society of Chemistry 2015