Optical temperature sensing of rare-earth ion doped phosphors
Xiangfu Wang
*ab,
Qing Liu
a,
Yanyan Bu
a,
Chun-Sheng Liu
ab,
Tao Liu
a and
Xiaohong Yan
*abc
aCollege of Electronic Science and Engineering, Nanjing University of Posts and Telecommunications, Nanjing, 210046, People’s Republic of China. E-mail: xfwang@njupt.edu.cn; yanxh@njupt.edu.cn
bKey Laboratory of Radio Frequency and Micro-Nano Electronics of Jiangsu Province, Nanjing 210046, Jiangsu, China
cCollege of Science, Nanjing University of Aeronautics and Astronautics, Nanjing 210046, People’s Republic of China
First published on 28th September 2015
Abstract
Accurate and reliable temperature measurement of many special inaccessible objects is a challenging task. Optical temperature sensing is a promising method to achieve it. The current status of optical thermometry of rare-earth ion doped phosphors is reviewed in detail. Based on the mechanisms of optical temperature sensing of different phosphors, temperature dependent luminescence spectra, the fluorescence intensity ratio technique in the data fitting process, and errors of the energy difference between thermally coupled levels, we describe the recent developments in the use of optical thermometry materials. The most important results obtained in each case are summarized, and the main challenges that we need to overcome are discussed. Research in the field of phosphor sensors has shown that they have significant advantages compared to conventional sensors in terms of their properties like greater sensitivity, freedom from electromagnetic interference, long path monitoring, and independence of compatibility with electronic devices.
1. Introduction
Temperature is a key parameter to induce some changes of cellular events, physical and chemical properties of functional nanomaterials, functional degradation of microcircuits, and so on. Contact temperature measurement, just like a thermometer, is an ideal method to study some phenomena that change with temperature. However, especially at the sub-micron scale, for temperature fluctuations of microcircuits and intracellular liquids, the conventional thermometer is not able to make measurements.1–3 Brites and Jaque reported some examples of luminescent and non-luminescent thermometers working at the nanometric scale.4,5 Even so, it is difficult to measure directly the temperatures of inaccessible objects, such as high-voltage power stations, coal mines, and volcanic and corrosive circumstances.6–9 Therefore, the ability to glean the temperature of the above objects could have valuable repercussions leading to novel insight about their properties induced by a temperature change.Optical temperature sensing, in contrast to other thermometers, is a promising method to achieve contactless measurement and large-scale imaging. Optical temperature sensing is based on monitoring the emission intensity change of luminescent materials induced by temperature when they interact with physical systems. Phosphors with an intense emission intensity are used as temperature detectors to convert the measured spectrum to temperature. It is easy to calibrate and calculate the temperature change range only through the main parameters of luminescence including intensity, effective bandwidth, spectrum shape, spectral shift and lifetime.
Recently, CdSe and CdTe semiconducting quantum dots were used as optical temperature nanoprobes in the low temperature range, since the peak position of the emission wavelength changes as a function of temperature.10,11 Organic compounds, such as Rhodamine B, the Ru–phen complex, DPTB dissolved in MOE, and so on, were used for dye-based intensity luminescence nanothermometry, due to their the spectral properties depending on many factors, such as the solvent, concentration, pH and temperature.5,11,12 These quantum dot nanocrystals and organic compounds are easily oxidized at high temperature, and are only available in the low temperature range. To overcome this, rare-earth ion doped oxide crystals, glass, core–shell heterojunction nanoparticles, and transparent glass ceramics containing fluoride nanocrystals were fabricated and used as optical temperature sensors. The present review aims to describe the latest progress of optical thermometry based on the luminescence of rare-earth ion doped phosphors. It contains fundamental principles, different rare-earth ion doped phosphors for optical thermometry, a conclusion and the main challenges.
2. Fundamental principles of optical temperature sensing
Phosphor thermometry is a non-contact technique that uses luminescence signals to measure temperature remotely. As shown in Fig. 1, phosphors are composed of a host and some luminescent ions, and will emit visible, infrared, or ultraviolet radiation upon excitation from an external light source. The intensity, wavelength, and lifetime of the emission bands are used to determine the temperature of a surface. Thus, the choice of luminescent ions is important to measure the temperature change around phosphors. Among the metal ions used as luminescence centers, the trivalent rare-earth ions are especially attractive, due to abundant energy levels located at a wide wavelength range from ultraviolet to infrared.13 Possessing real intermediate energy levels, trivalent rare-earth ions can give out desired emissions via various energies, due to abundant energy levels of 4f configurations. Inheriting their native intra-configurational transitions, trivalent rare-earth ion activated luminescent materials have received consistent attention due to large Stokes/anti-Stokes shifts, long luminescence lifetimes, and sharp band emissions.14 Additionally, some trivalent rare-earth ions own a couple of adjacent levels with a very small energy gap (ΔE) of about 100–2000 cm−1, such as Er3+: 2H11/2 and 4S3/2; Tm3+: 3F2,3 and 3H4; Ho3+: 5S2 and 5F4; Nd3+: 4F5/2 and 4F3/2; Dy3+: 4I15/2 and 4F9/2; Eu3+: 5D1 and 5D0, and so on. As shown in Fig. 1, in the photoluminescence process, these adjacent energy levels, the upper level and lower level, can be thermally populated and depopulated through changing the environmental temperature around the phosphors. The two adjacent energy levels were called thermally coupled energy levels (TCL). The luminescence intensity ratio between IU and IL will change regularly with the temperature increase. A function relation between the luminescence intensity ratio and temperature can be determined through fitting some data points at different temperatures.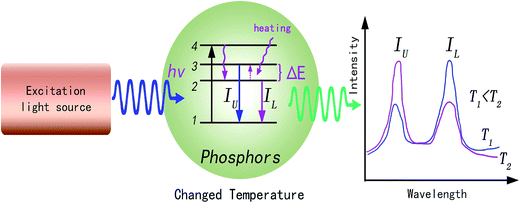 | ||
| Fig. 1 Schematic illustration of the basic mechanism of the optical thermometry process in rare-earth ion doped phosphors. | ||
The luminescence intensity of an emission band can be expressed as:
| Iij = hvAijNi | (1) |
The term v is expressed as:
 | (2) |
In conclusion, Iij can be expressed as:
 | (3) |
The ratio of the luminescence from each thermally coupled level of active ions is modified as:
 | (4) |
Thus, the term R can be given as the following:
 | (5) |
The terms AUj, ALj, NU, and NL are dependent on the temperature. The population process of the NU and NL levels obeys the Boltzmann distributing law.16 Thus, R can be expressed as:
 | (6) |
 | (7) |
The sensitivity is a key parameter to value the possibility of practical applications. The sensitivity of optical thermometry is the rate of change of R in response to the variation of temperature.17,19,20 To allow comparison between the sensitivities obtained from different thermally coupled levels, the relative sensitivity SR and the absolute sensitivity SA are defined as:
 | (8) |
 | (9) |
The terms SR and SA are dependent on ΔEf. If ΔEf agrees well with the experimental energy difference ΔEm, the values of SR and SA are accurate. The error δ between ΔEf and ΔEm is expressed as:
 | (10) |
3. Rare-earth ion doped phosphors for optical thermometry
Phosphors are composed of inorganic oxides and ceramic materials which means that phosphors are resistant to oxidation in high temperature environments and are non-reactive with harsh chemicals. To obtain excellent optical temperature sensors, trivalent lanthanide ion doped phosphors were synthesized widely.21–80 At present, trivalent lanthanide ions, such as Er3+, Tm3+, Ho3+, Nd3+, Dy3+, and Eu3+, have been used as luminescence centers (or activators) in the process of optical thermometry, as shown in Fig. 2. Host materials used for optical thermometry involve nanorods,60 spherical and tetragonal nanoparticles,59 core–shell particles,61 hollow nanoparticles, glass ceramics containing fluoride nanocrystals,23,68,71 fibers,17 and oxide bulks.34,39–54,58 Phosphors are excited with a light source, and the emitted luminescence can be in the ultraviolet, visible, or even in the infrared region.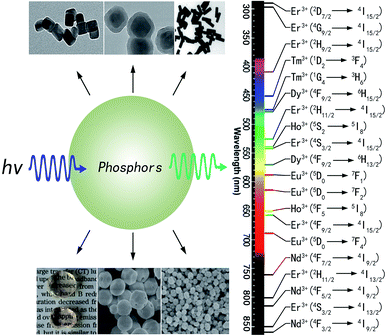 | ||
| Fig. 2 Different types and luminescence transitions of rare-earth ion doped phosphors used for optical thermometry. Data are summarized according to ref. 21–80. | ||
For optical temperature sensors, the TCL should satisfy some conditions that depend strongly on the host matrix into which the rare-earth ions are doped. The factors affecting the TCL of the rare-earth ions are as follows:
1. The separation between the TCL should be more than 200 cm−1 to avoid strong overlapping of the two fluorescence wavelengths, and be less than 2000 cm−1 to avoid too small a population in the upper level for the temperature range of interest.
2. In order to achieve a sufficient fluorescence intensity from the upper level transition, the radiative transitions from the upper level should dominate its non-radiative transitions.
TCL proven by experiment are listed as follows: Er3+: 2H11/2/4S3/2, and 4D7/2/4G9/2; Tm3+: 3F2,3/3H4, and 1G4(a)/1G4(b); Ho3+: 5S2/5F4, 5F2,3/3K8, and 5G6/5F1; Nd3+: 4F5/2/4F3/2, 4F7/2/4F3/2, and 4F7/2/4F5/2; Dy3+: 4I5/2 and 4F9/2; and Eu3+: 5D1/5D0. The TCL are populated by the up-conversion and down-conversion processes of the above trivalent rare-earth ions. Optical thermometry has been achieved by analyzing the temperature dependent luminescence properties originating from the transitions from the TCL to the other levels.
3.1 Optical thermometry based on Er3+ doped phosphors
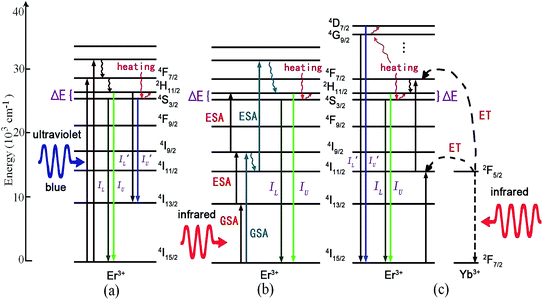
Trivalent erbium Er3+ has a 4f11 electronic configuration and dense energy levels located at a wide wavelength range from ultraviolet to infrared, which is suitable to absorb and emit ultraviolet, visible and infrared luminescence. The Er3+ ion has two couples of adjacent TCL, 2H11/2 and 4S3/2, and 4D7/2 and 4G9/2, whose relative emission intensities are strongly temperature dependent. Among the different rare-earth ions capable of single-center phosphors, Er3+ is probably the most used one, due to its very intense two green emission bands originating from the 2H11/2 and 4S3/2 TCL. As shown in Fig. 3, the mechanism of optical thermometry based on Er3+ doped phosphors can be summarized as follows:(1) Down-conversion of Er3+ ions under ultraviolet (or blue) excitation:21–26 under ultraviolet (or blue) excitation, Er3+ ions are excited directly to the higher excited states by ground state absorption (GSA), as shown in Fig. 3(a). Some ions in the excited states relax to the next lower energy levels 2H11/2 and 4S3/2 through the process of non-radiative relaxation, making the 2H11/2 and 4S3/2 levels populated. Er3+ ions in the 2H11/2 and 4S3/2 levels radiatively relax to the 4I15/2 level, giving two green emissions with the intensity of IU and IL. Er3+ ions in the 2H11/2 and 4S3/2 levels radiatively relax to the 4I13/2 level, giving two green emission bands with the intensity of I′U and I′L. The luminescence intensity ratios, IU/IL and I′U/I′L, change with the temperature of the phosphors. These temperature dependent fluorescence intensity ratios are used as the precise evaluation scale of optical temperature sensing.
Recently, based on down-conversion luminescence emissions centered at 524 nm (2H11/2 → 4I15/2) and 547 nm (4S3/2 → 4I15/2) of Er3+ ions, as shown in Fig. 4, optical temperature sensing in the range from 313 K to 713 K was studied by Sui et al. through analyzing the temperature dependent term R in Er3+ doped Te–Ge–Zn–Na glass under 379 nm excitation.21 A maximum sensitivity of 0.0085 K−1 at 596 K was obtained in the Te40Ge40Zn9.5Na10 glass. Under 406 nm excitation, the intensity ratio of green emissions at 523 nm and 545 nm was studied by González et al. in Er3+ doped fluoroindate glass with a maximum sensitivity of 0.0028 K−1 for 425 K.22 Under 488 nm excitation, the thermalized levels 4S3/2 and 2H11/2 were studied in Er3+ doped NaYF4 nanocrystalline glass ceramic with a maximum sensitivity of 66 × 10−4 K−1 for 570 K.23 Similarly, the maximum sensitivity of 79 × 10−4 K−1 for 630 K was obtained in Er3+ doped zinc fluorophosphate glass, and 79 × 10−4 K−1 for 541 K was obtained in Er3+ doped fluorotellurite glass.24,25 Under 532 nm excitation, González et al. demonstrated novel optical temperature thermometry based on infrared emissions centered at 800 nm (2H11/2 → 4I13/2) and 850 nm (4S3/2 → 4I13/2) in Er3+ doped Sr–Ba–Nb–B glass ceramic.26 A maximum sensitivity of 0.0017 K−1 for 600 K was obtained. The hosts, excitation wavelength (λex), emission wavelength (λem), the involved transitions, SR and SA values, and the temperature range for phosphors doped with Er3+ ions are summarized in Table 1.
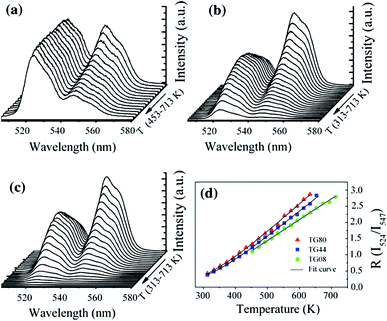 | ||
| Fig. 4 Temperature dependent Er3+ green emission spectra of 0.5 mol% Er3+ doped (a) Te80Zn9.5Na10 (TG08) glass, (b) Te40Ge40Zn9.5Na10 (TG44) glass, (c) Ge80Zn9.5Na10 (TG80) glass, and (d) temperature dependent R values of the two green emissions of Er3+. Reprinted from ref. 21 with permission of Springer. | ||
| Rare-earth ions | Host | λex (nm) | λem (nm) | Transitions | Temperature range (K) | SR (maximum) | SA | Ref. |
|---|---|---|---|---|---|---|---|---|
| Er3+ | Tellurite glass | 379 | 524, 547 | 2H11/2, 4S3/2 → 4I15/2 | 313–713 | 0.0085 K−1 (596 K) | 1108.3/T2 | 21 |
| Er3+ | In–Zn–Sr–Ba glass | 406 | 523, 545 | 2H11/2, 4S3/2 → 4I15/2 | 125–425 | 0.0028 K−1 (425 K) | 1167.6/T2 | 22 |
| Er3+ | α-NaYF4 glass ceramics | 488 | 525, 550 | 2H11/2, 4S3/2 → 4I15/2 | 300–720 | 0.0024 K−1 (540 K) | 1051.51/T2 | 23 |
| Er3+ | PKAZLF glass | 488 | 524, 550 | 2H11/2, 4S3/2 → 4I15/2 | 298–773 | 0.0079 K−1 (630 K) | 1238.8/T2 | 24 |
| Er3+ | Te–Pb–Al glass | 488 | 530, 550 | 2H11/2, 4S3/2 → 4I15/2 | 100–573 | 0.0079 K−1 (541 K) | 1149.43/T2 | 25 |
| Er3+ | Sr–Ba–Nb–B glass | 532 | 800, 850 | 2H11/2, 4S3/2 → 4I13/2 | 300–700 | 0.0017 K−1 (600 K) | 1255.14/T2 | 26 |
| Er3+ | Te–Pb–Al glass | 800 | 530, 550 | 2H11/2, 4S3/2 → 4I15/2 | 300–550 | 0.0054 K−1 (540 K) | 1085.57/T2 | 27 |
| Er3+ | ZBLALiP glass | 805 | 522, 546 | 2H11/2, 4S3/2 → 4I15/2 | 150–850 | 0.0023 K−1 (495 K) | 981/T2 | 28 |
| Er3+ | Ba(Zr,Ca)TiO3 ceramics | 980 | 525, 550 | 2H11/2, 4S3/2 → 4I15/2 | 200–443 | 0.0044 K−1 (443 K) | 1135.5/T2 | 29 |
| Er3+ | Si–B–Ba–Na glass | 978 | 534, 549 | 2H11/2, 4S3/2 → 4I15/2 | 296–673 | 0.0023 K−1 (296 K) | 335/T2 | 30 |
| Er3+ | BaTiO3 nanocrystals | 980 | 526, 547 | 2H11/2, 4S3/2 → 4I15/2 | 322–466 | 1200 K−1 | 940/T2 | 31 |
| Er3+ | PLZT ceramics | 980 | 534, 565 | 2H11/2, 4S3/2 → 4I15/2 | 310–883 | 0.004 °C−1 (610 °C) | 1096.92/T2 | 32 |
| Er3+, Mo6+ | YbAG | 976 | 522, 546 | 2H11/2, 4S3/2 → 4I15/2 | 295–973 | 0.0048 K−1 (467 K) | 900.8/T2 | 33 |
| Er3+ | ZnO | 978 | 536, 553 | 2H11/2, 4S3/2 → 4I15/2 | 353–973 | 0.0062 °C−1 (170 °C) | 880.11/T2 | 34 |
| Er3+ | Chalcogenide glass | 1540 | 530, 555 | 2H11/2, 4S3/2 → 4I15/2 | 293–493 | 0.0102 °C−1 | 1135.23/T2 | 35 |
| Er3+ | Na0.82Ca0.08Er0.16Y0.853F4 | 1540 | 523, 542 | 2H11/2, 4S3/2 → 4I15/2 | 5–300 | 0.0022 K−1 (338 K) | 958.28/T2 | 36 |
| Er3+, Yb3+ | α-NaYF4 | 980 | 525, 545 | 2H11/2, 4S3/2 → 4I15/2 | 298–318 | 0.0030 K−1 (515 K) | 1028/T2 | 37 |
| Er3+, Yb3+ | β-NaLuF4 | 980 | 256, 276 | 4D7/2, 4G9/2 → 4I15/2 | 303–523 | 0.0052 K−1 (303 K) | 384/T2 | 38 |
| Er3+, Yb3+, Eu3+ | Y2O3 | 980 | 523, 551 | 2H11/2, 4S3/2 → 4I15/2 | 303–593 | 0.0103 K−1 (593 K) | 1062.50/T2 | 39 |
| Er3+, Yb3+ | Y2O3 | 978 | 539, 564 | 2H11/2, 4S3/2 → 4I15/2 | 150–300 | 0.0528 K−1 (150 K) | 1173.39/T2 | 40 |
| Er3+, Yb3+ | Y2O3 | 980 | 528, 556 | 2H11/2, 4S3/2 → 4I15/2 | 93–613 | 0.0044 K−1 (427 K) | 886.08/T2 | 41 |
| Er3+, Yb3+, Eu3+ | Y2O3 | 980 | 523, 551 | 2H11/2, 4S3/2 → 4I15/2 | 301–403 | 0.0008 K−1 (327 K) | 682.6/T2 | 42 |
| Er3+, Yb3+ | Al2O3 | 978 | 523, 545 | 2H11/2, 4S3/2 → 4I15/2 | 295–973 | 0.0051 K−1 (495 K) | 964.1/T2 | 43 |
| Er3+, Yb3+ | BaMoO4 | 980 | 531, 552 | 2H11/2, 4S3/2 → 4I15/2 | 303–523 | 0.0206 K−1 (463 K) | 873.38/T2 | 44 |
| Er3+, Yb3+ | Y2SiO5 pulsed | 975 | 530, 550 | 2H11/2, 4S3/2 → 4I15/2 | 300–600 | 0.0070 K−1 (600 K) | 1226/T2 | 45 |
| Er3+, Yb3+, Nd3+ | Y2SiO5 | 808 | 528, 556 | 2H11/2, 4S3/2 → 4I15/2 | 298–753 | 0.00095 K−1(439 K) | 710.87/T2 | 46 |
| Er3+, Yb3+ | SrWO4 | 980 | 525, 547 | 2H11/2, 4S3/2 → 4I15/2 | 300–518 | 0.01498 K−1 (403 K) | 866.17/T2 | 47 |
| Er3+, Yb3+ | YVO4 | 980 | 524, 554 | 2H11/2, 4S3/2 → 4I15/2 | 300–485 | 0.01169 K−1 (380 K) | 774.1/T2 | 48 |
| Er3+, Yb3+ | CaWO4 | 980 | 384, 408 | 4G11/2, 2H9/2 → 4I15/2 | 303–873 | 0.0073 K−1 (873 K) | 2109.31/T2 | 51 |
| Er3+, Mo6+ | Yb2Ti2O7 | 976 | 532, 546 | 2H11/2, 4S3/2 → 4I15/2 | 290–610 | 0.0074 K−1 (340 K) | 679.2/T2 | 52 |
| Er3+, Yb3+ | LiNbO3 | 980 | 530, 550 | 2H11/2, 4S3/2 → 4I15/2 | 285–453 | 0.0075 K−1 (310 K) | 1250/T2 | 54 |
| Er3+, Yb3+ | Na0.5Bi0.5TiO3 ceramics | 980 | 525, 550 | 2H11/2, 4S3/2 → 4I15/2 | 173–553 | 0.0035 K−1 (493 K) | 1017.12/T2 | 49 |
| Er3+, Yb3+ | NaBiTiO3 ceramics | 980 | 525, 550 | 2H11/2, 4S3/2 → 4I15/2 | 163–613 | 0.0031 K−1 (400 K) | 827.26/T2 | 50 |
| Er3+, Yb3+ | Bi7Ti4NbO21 | 980 | 547, 670 | 4S3/2, 4F9/2 → 4I15/2 | 153–553 | 0.0044 K−1 | 53 | |
| Er3+, Yb3+ | TeO2–WO3 glass | 980 | 527, 551 | 2H11/2, 4S3/2 → 4I15/2 | 300–690 | 0.0029 K−1 (690 K) | 976.75/T2 | 55 |
(2) Up-conversion of Er3+ ions under infrared excitation: under infrared excitation, the excited states of Er3+ ions are populated by the GSA and successive excited state absorption (ESA),27–36 as shown in Fig. 3(b). It needs three 1540 nm infrared photons and two 800 nm (or 980 nm) infrared photons to populate the thermally coupled 2H11/2 and 4S3/2 energy levels. The energy transfer between Er3+ ions is thought of as the main up-conversion mechanism, only when the Er3+ concentration of the optically active center is high enough.13 The ions in the high energy excited states relax to the next lower energy levels 2H11/2 and 4S3/2 through non-radiative relaxation, giving two green emissions with the intensities of IU and IL. The temperature dependent fluorescence intensity ratio, IU/IL, is used as the precise evaluation scale of optical temperature sensing.
Based on the up-conversion luminescence emissions centered at 524 nm (2H11/2 → 4I15/2) and 547 nm (4S3/2 → 4I15/2) of Er3+ ions, the optical temperature thermometry was studied by Luis et al. in a fluorotellurite glass under 800 nm excitation.27 A better behaviour as a temperature sensor has been obtained for the less Er3+ concentrated glass with a maximum sensitivity of 54 × 10−4 K−1 at 540 K. Based on the thermalization effects between the upper levels responsible for green fluorescence at 522 nm and 546 nm under 805 nm laser excitation, new optical temperature sensing using the micrometer sized ZBLALiP spherical cavity was explored by Cai et al.28 Using a diode laser emitting at about 980 nm as the excitation source, the optical temperature sensing properties based on green emissions of Er3+ ions were studies in BZT-BCT ferroelectric ceramics, silicate glass, BaTiO3 nanocrystals, PLZT transparent ceramics, Yb3Al5O12 nanocrystals, and ZnO nanocrystals, respectively.29–34 The maximum sensitivity of 48 × 10−4 K−1 for 467 K was obtained in Er3+ doped Yb3Al5O12 nanocrystals. Under 1540 nm infrared excitation, based on green luminescence emissions of Er3+ ions, the optical temperature sensing properties were studied in Ga2S3–La2O3 chalcogenide glass, and the Na0.82Ca0.08Er0.16Y0.853F4 phosphor.35,36 The corresponding results are summarized in Table 1.
(3) Yb3+–Er3+ energy transfer under infrared excitation: at high temperature, fluorescence quenching of emission bands of Er3+ ions induced by the temperature was obvious at 423 K.21–35 It is necessary to enhance the emission intensity of phosphors in the process research of optical temperature sensing.
Among the rare-earth ions, the Yb3+ ion consists of only two levels, and has only one electronic excited state, 2F5/2, that is located in the near infrared region at about 980 nm.13 Moreover, high power InGaAs diode lasers are available to directly pump the Yb3+ absorption band around 980 nm. Fluorescent materials with Yb3+ as a sensitizer can convert short infrared into visible/ultraviolet light via energy transfer between lanthanide ions. As reported, the doping content of Yb3+ was usually kept at 18% or higher, because the large energy gap between the excited state 2F5/2 and ground state 2F7/2 blocks multiphoton cross-relaxation.14 Thus, in order to enlarge the photo-absorption cross section of 980 nm infrared light, the Yb3+ ion is chosen to be a sensitizer for the Er3+ ion. Under 980 nm excitation, the two successive energy transfers from Yb3+ to Er3+ can induce the population of the thermally coupled 2H11/2 and 4S3/2 levels of Er3+,37,39–50 and five successive energy transfers from Yb3+ to Er3+ can induce the population of the thermally coupled 4D7/2 and 4G9/2 levels of Er3+,38 as shown in Fig. 3(c). The temperature dependent fluorescence intensity ratios, IU/IL and I′U/I′L, are used to evaluate the optical temperature sensing properties.
Recently, in the low temperature range, based on green luminescence emissions of Er3+–Yb3+ co-doped NaYF4 nanoparticles, Vetrone et al. demonstrated the optical temperature sensing properties in the internal temperature of the living HeLa cervical cancer cell from 25 °C to 45 °C.37 Notably, the temperature dependence of the five-photon 256 nm (4D7/2 → 4I15/2) and 276 nm (4G9/2 → 4I15/2) ultraviolet up-conversion luminescence in Yb3+–Er3+ co-doped β-NaLuF4 nanocrystals was studied firstly by Zheng et al. from 303 K to 523 K with a maximum sensitivity of 0.0052 K−1 at 303 K,38 as shown in Fig. 5.
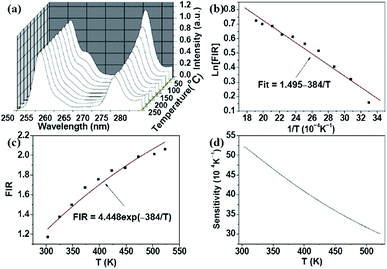 | ||
| Fig. 5 Temperature dependent (a) spectrum of Er3+ ions from 4D7/2 and 4G9/2 levels; (b) log plot of the FIR; (c) FIR relative to the temperature; and (d) sensor sensitivity under 980 nm excitation. Reprinted from ref. 38 with permission of Optical Society of America. | ||
In the high temperature range, special phosphors are needed with high thermal stability and high solubility between hosts and lanthanide ions. Among the oxide materials, Y2O3 is a good candidate host, due to its wide bandgap, high melting point, high solubility between Y3+ and Er3+, and good transparency from ultraviolet to infrared. Recently, in Er3+–Yb3+ co-doped Y2O3 nanoparticles, optical temperature sensing properties were studied in the temperature range from 93 K to 613 K through analyzing the temperature dependent fluorescence intensity ratio of the two green emissions.39–42 A maximum sensitivity of 528 × 10−4 K−1 for 150 K was obtained in the Y1.97Yb0.02Er0.01O3 nanophosphors.40 The fluorescence intensity ratio of the green up-conversion emissions at 523 nm and 545 nm in Er3+–Yb3+ co-doped Al2O3 was studied by Dong et al. as a function of temperature with a maximum sensitivity of 0.0051 K−1 at 495 K.43 Additionally, oxide salts, such as BaMoO4, Y2SiO5, MWO4 (M = Ca, Sr), YVO4, BaTiO3, Yb2Ti2O7, Bi7Ti4NbO21, and LiNbO3, were doped with Er3+ and Yb3+ ions, and were studied as optical temperature sensors by the temperature dependent fluorescence intensity ratio of the two green emissions.43–54 From Table 1, one can find that the maximum SR, 0.0528 K−1, is obtained at 150 K in Er3+–Yb3+ co-doped Y2O3 phosphors under 978 nm excitation, and the maximum SA, 2109.31/T2, is obtained in Er3+–Yb3+ co-doped CaWO3 phosphors under 978 nm excitation.
The term δ is a key parameter used to judge the calculation accuracy of the fluorescence intensity ratio technique in the data fitting process. ΔEf and ΔEm between the TCL of Er3+ ions and the corresponding δ values are calculated and summarized in Table 2 through analyzing ref. 21–55. In Table 2, we can see that most of the Er3+ doped phosphors have a δ value of more than 5%, and the maximum δ value is about 53.89% for the Er3+ doped Si–B–Ba–Na glass. The δ values less than 5% are obtained in Er3+ doped tellurite glass, Na0.82Ca0.08Er0.16Y0.853F4 bulks, PKAZLF glass, and ZBLALiP glass, respectively. The small δ values for tellurite, PKAZLF, and ZBLALiP glass materials can be explained as follows: the successive excited state absorption overcomes the energy transfer between the thermally coupled levels and other levels, due to the abnormal local ligand fields around the Er3+ sites in the tellurite, PKAZLF, and ZBLALiP glass hosts.14,17 The population of the TCL of Er3+ ions at high temperature obeys the Boltzmann distribution. As shown in Table 2, most of the Er3+–Yb3+ co-doped phosphors have a value of δ of more than 10%, and the maximum δ value is about 90% for the Er3+–Yb3+ co-doped β-NaLuF4 nanocrystals. Values of δ of less than 5% are observed in Er3+–Yb3+ co-doped Y2O3, and Er3+–Mo6+ co-doped Yb2Ti2O7. The large δ value may be ascribed to the actual deviation of eqn (6) induced by energy transfer from the TCL to the other excited states.14
| Samples | ΔEf (cm−1) | ΔEm (cm−1) | δ (%) | Ref. |
|---|---|---|---|---|
| Er3+ doped tellurite glass | 781 | 802 | 2.62 | 21 |
| Er3+ doped In–Zn–Sr–Ba glass | 861 | 771.8 | 11.55 | 22 |
| Er3+ doped α-NaYF4 glass ceramics | 741 | 865.8 | 14.41 | 23 |
| Er3+ doped PKAZLF glass | 873 | 902.2 | 3.24 | 24 |
| Er3+ doped Te–Pb–Al glass | 810 | 686 | 18.1 | 25 |
| Er3+ doped Sr–Ba–Nb–B glass | 872.3 | 748 | 16.62 | 26 |
| Er3+ doped Te–Pb–Al glass | 765 | 810 | 5.56 | 27 |
| Er3+ doped ZBLALiP glass | 681 | 700 | 2.72 | 28 |
| Er3+ doped Ba(Zr,Ca)TiO3 ceramics | 789 | 850 | 7.18 | 29 |
| Er3+ doped Si–B–Ba–Na glass | 236 | 511.7 | 53.89 | 30 |
| Er3+ doped BaTiO3 nanocrystals | 662.4 | 729.9 | 9.25 | 31 |
| Er3+ doped PLZT ceramics | 773 | 1027.5 | 24.77 | 32 |
| Er3+, Mo6+ co-doped YbAG | 634.8 | 842.1 | 24.62 | 33 |
| Er3+ doped ZnO | 611 | 573.5 | 6.54 | 34 |
| Er3+ doped chalcogenide glass | 800 | 849.9 | 5.87 | 35 |
| Na0.82Ca0.08Er0.16Y0.853F4 | 675.3 | 670.27 | 0.75 | 36 |
| Er3+, Yb3+ co-doped α-NaYF4 | 724.4 | 766.1 | 5.44 | 37 |
| Er3+, Yb3+ co-doped β-NaLuF4 | 270.6 | 2830.6 | 90.44 | 38 |
| Er3+, Yb3+, Eu3+ tri-doped Y2O3 | 738.54 | 800 | 7.68 | 39 |
| Er3+, Yb3+ co-doped Y2O3 | 826.9 | 810.6 | 2.01 | 40 |
| Er3+, Yb3+ co-doped Y2O3 | 615.7 | 800 | 23.0 | 41 |
| Er3+, Yb3+, Eu3+ tri-doped Y2O3 | 474.9 | 971 | 51.09 | 42 |
| Er3+, Yb3+ co-doped Al2O3 | 679.4 | 771.8 | 11.97 | 43 |
| Er3+, Yb3+ co-doped BaMoO4 | 607 | 716 | 15.22 | 44 |
| Er3+, Yb3+ co-doped Y2SiO5 | 781 | 686.1 | 13.83 | 45 |
| Er3+, Yb3+, Nd3+ tri-doped Y2SiO5 | 498 | 601.7 | 17.23 | 46 |
| Er3+, Yb3+ co-doped SrWO4 | 602 | 766.1 | 21.42 | 47 |
| Er3+, Yb3+ co-doped YVO4 | 538 | 693 | 22.36 | 48 |
| Er3+, Yb3+ co-doped Na0.5Bi0.5TiO3 | 706.8 | 800 | 11.65 | 49 |
| Er3+, Yb3+ co-doped NaBiTiO3 | 574.8 | 800 | 28.15 | 50 |
| Er3+, Yb3+ co-doped CaWO4 | 1455 | 1530 | 4.90 | 51 |
| Er3+, Mo6+ co-doped Yb2Ti2O7 | 478.6 | 482 | 0.71 | 52 |
| Er3+, Yb3+ co-doped Bi7Ti4NbO21 | 775 | 820.7 | 5.57 | 53 |
| Er3+, Yb3+ co-doped LiNbO3 | 860 | 686.2 | 25.33 | 54 |
| Er3+, Yb3+ co-doped TeO2–WO3 glass | 678.94 | 826.5 | 17.85 | 55 |
3.2 Optical thermometry based on Yb3+–Tm3+ co-doped phosphors
The trivalent Tm3+ ion has a 4f12 electronic configuration, and is reported as one of the most efficient blue luminescence center ions. It has two couples of adjacent thermally coupled levels, such as 3F2,3 and 3H4, and 1G4(a) and 1G4(b), whose relative emission intensity is strongly temperature dependent. As shown in Fig. 6, the energy transfer (ET) from Yb3+ to Tm3+ is the main population mechanism of optical thermometry based on up-conversion luminescence of the Tm3+ ion.60 Under 980 nm infrared excitation, the thermally coupled levels 1G4(a) and 1G4(b) are populated by three successive ETs from Yb3+ to Tm3+. The thermally coupled levels 3F2,3 and 3H4 are populated by two successive ETs from Yb3+ to Tm3+. The ions in the high energy excited states, such as 1G4(a) and 1G4(b), 3F2,3 and 3H4, relax to the next lower energy levels through non-radiative relaxation, giving two blue emissions with the intensities IU and IL, and two infrared emissions with the intensities I′U and I′L. The temperature dependent fluorescence intensity ratios, IU/IL and I′U/I′L, are used to evaluate the optical temperature sensing properties.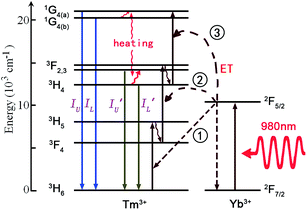 | ||
| Fig. 6 The mechanism of optical thermal sensing through Yb3+–Tm3+ energy transfer under 980 nm infrared excitation. | ||
The spectral properties of the Tm3+ luminescence band at 480 nm from the 1G4 → 3H6 transition in Tm3+ and Yb3+ co-doped NaNbO3 nanocrystals were analyzed in the biophysical temperature range from 297 K to 353 K with a 980 nm excitation source.56 Novel TCL, 1G4(a) and 1G4(b), were observed firstly by Pereira et al. Experiments proved that the population re-distribution among the thermally coupled stark levels could be successfully used for ratiometric thermal sensing. By analyzing the R value between the 700 nm and 800 nm up-conversion emissions, the optical temperature sensing properties of the Tm3+/Yb3+ co-doped oxyfluoride PbF2 glass ceramic were studied by Xu et al. in the temperature range of 293–703 K.57 The optical temperature sensing properties of Tm3+ were studied in Tm3+–Yb3+ co-doped Y2O3 bulk and Y2O3 sub-micronic spherical particles.58,59 The SA and SB values obtained from the Tm3+–Yb3+ co-doped Y2O3 sub-micronic spherical particles are larger than those from the Tm3+–Yb3+ co-doped Y2O3 bulk.
Recently, trivalent rare-earth ion doped fluoride nanocrystals were reported as the most efficient up-conversion materials.13,14 Based on ultraviolet up-conversion emissions from the 6P5/2/8S7/2 and 6P7/2/8S7/2 TCL, Zheng et al. demonstrated firstly the optical temperature sensing properties in Tm3+–Yb3+–Gd3+ tri-doped NaLuF4 microcrystals in the range of 298–523 K,60 as shown in Fig. 7. The maximum sensor sensitivity of about 0.0029 K−1 was found at 298 K. The maximum sensor sensitivities were found to be about 0.0004 K−1 (333 K) and 0.0029 K−1 (298 K) by analyzing the ultraviolet emissions from the 6P5/2/8S7/2 and 6P7/2/8S7/2 levels, respectively. To our knowledge, fluoride nanocrystals are easily oxidized at high temperature. To overcome it, NaYbF4:Tm3+@SiO2 core–shell materials were synthesized, and their optical temperature sensing properties based on the 3F2/3H4 TCL of the Tm3+ ion were studied by Wang et al. in a wide temperature range from 100 K to 700 K.61 A better behavior as a low temperature sensor has been obtained with a minimum sensitivity of 5.4 × 10⁻⁴ K−1 at 430 K.
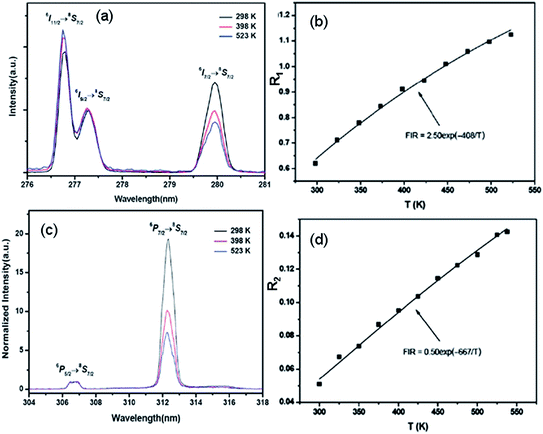 | ||
| Fig. 7 Temperature dependent (a) ultraviolet spectra in the range of 276–281 nm, and (b) R1 of the emissions from the transitions of 6I9/2/8S7/2 and 6I7/2/8S7/2 of NaLuF4:Yb3+, Tm3+, Gd3+ microcrystals. Temperature dependent (c) ultraviolet spectra in the range of 304–318 nm, and (d) R2 of the emissions from the transitions of 6P5/2/8S7/2 and 6P7/2/8S7/2 of NaLuF4:Yb3+, Tm3+, Gd3+ microcrystals. Reproduced from ref. 60 with permission of the Royal Society of Chemistry. | ||
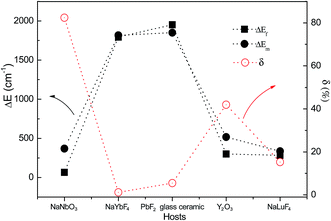
In Table 3 we summarize, for the sake of comparison, the different performance parameters of sensitivities and the involved transitions of Tm3+ doped phosphors. The maximum value of SR, 0.078 K−1, is obtained in Tm3+–Yb3+ co-doped Y2O3 sub-micronic spherical particles. The maximum value of SA, 2829.5/T2, is obtained in Tm3+/Yb3+ co-doped oxyfluoride PbF2 glass ceramic. To study the feasibility evaluation in application, ΔEf, ΔEm, and δ are studied in Tm3+–Yb3+ co-doped NaNbO3 nanocrystals, oxyfluoride PbF2 glass ceramic, Y2O3, NaLuF4 microcrystals, and NaYbF4 under 980 nm excitation, as shown in Fig. 8. A large δ value of more than 80% is observed in Tm3+–Yb3+ co-doped NaNbO3 nanocrystals. The large δ value may be ascribed to the actual deviation of eqn (6) induced by energy transfer from the TCL to the other excited states.14 It is accurate to use NaYbF4:Tm3+@SiO2 core–shell materials and Tm3+/Yb3+ co-doped oxyfluoride Si–Pb glass ceramic to evaluate the scale of optical temperature sensing.
| Rare-earth ions | Host | λex (nm) | λem (nm) | Transitions | Temperature range (K) | SR (maximum) | SA | Ref. |
|---|---|---|---|---|---|---|---|---|
| Tm3+, Yb3+ | NaNbO3 | 976 | 480, 486 | 1G4, 3F2,3, 3H4 → 3H6 | 293–353 | 0.0008 °C−1 (25 °C) | 93.53/T2 | 56 |
| Tm3+, Yb3+ | PbF2 glass ceramics | 980 | 700, 800 | 3F2,3, 3H4 → 3H6 | 293–703 | 0.0006 K−1 (1360 K) | 2829.5/T2 | 57 |
| Tm3+, Yb3+ | Y2O3 | 976 | 476, 488 | 1G4(a), 1G4(b) → 3H6 | 303–753 | 0.0035 K−1 (303 K) | 452.51/T2 | 58 |
| Tm3+, Yb3+ | Y2O3 | 978 | 454, 815 | 1D2 → 3F4, 3H4 → 3H6 | 10–300 | 0.078 K−1 (270 K) | 566.91/T2 | 59 |
| Tm3+, Yb3+, Gd3+ | NaLuF4 | 980 | 307, 312.4 | 6P5/2, 6P7/2 → 8S7/2 | 298–523 | 0.0004 K−1 (333 K) | 667/T2 | 60 |
| 980 | 277.3, 279.9 | 6I9/2, 6I7/2 → 8S7/2 | 298–523 | 0.0029 K−1 (298 K) | 408/T−2 | 60 | ||
| Tm3+ | NaYbF4@SiO2 | 980 | 697, 798 | 3F2,3, 3H4 → 3H6 | 100–700 | 0.00054 K−1 (100 K) | 2677.39/T2 | 61 |
3.3 Optical thermometry based on Ho3+ doped phosphors
The trivalent Ho3+ ion has a 4f10 electronic configuration, and is reported as one of the most efficient green luminescence center ions, due to the intermediate 5S2 level with a long fluorescence lifetime.13,14 It has three couples of adjacent TCL, such as 5F4/5S2, 5F2,3/3K8, and 5G6/5F1. As shown in Fig. 9, the two-step up-conversion of Ho3+ and successive energy transfer from Yb3+ to Ho3+ are the main mechanisms of optical thermometry based on Ho3+ doped phosphors.60–68 In the case of a low doping concentration (<1%), the ESA process refers to a sequential absorption of two pump infrared photons at 890 nm by a single Ho3+ ion. Upon 980 nm laser irradiation, Yb3+ absorbs infrared photons with the generation of 2F7/2 → 2F5/2 upward transitions. Subsequently, it donates the energy to the adjacent Ho3+ through a phonon assisted energy transfer, with Yb3+ dropping back to its 2F7/2 ground state. This promotes the Ho3+ ions to their excited states, such as 5I6, 5S2, and 5G5. The thermally coupled 5F4/5S2, 5F2,3/3K8, and 5G6/5F1 energy levels are populated by the process of non-radiative relaxation. The fluorescence intensity ratios, IU/IL, I′U/I′L, and I′′U/I′′L, are dependent strongly on temperature, and are used to study the optical temperature sensing properties.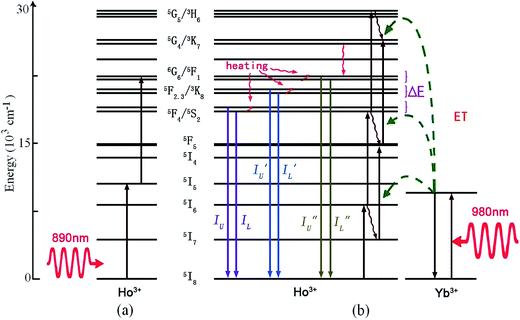 | ||
| Fig. 9 The mechanism of optical thermal sensing through (a) up-conversion of the Ho3+ ion under 890 nm infrared excitation, and (b) Yb3+–Ho3+ energy transfer under 980 nm infrared excitation. | ||
It was reported that there were two formulas used to fit ΔEf of the Ho3+ ions, due to the two different transitions, such as from the TCL to the other excited state, and from the TCL to the ground state. One formula is eqn (6), which is suitable to fit ΔEf corresponding to transitions from 5F4/5S2, 5F2,3/3K8, and 5G6/5F1 to the 5I8 ground state. Using eqn (6) as a fitting formula, the temperature dependent fluorescence intensity ratios were studied in Ho3+ doped TeO2 glass and LiTeO2 glass under 890 nm excitation,62,63 and Ho3+–Yb3+ co-doped CaMoO4, CaWO4, and PbF2 glass ceramic under 980 nm excitation.66–68 A maximum SR of 0.098 K−1 for 130 K was obtained in Ho3+ doped TeO2 glass, and a maximum SA of 2191.9/T2 was obtained in Ho3+–Yb3+ co-doped glass ceramic.
The other formula is as follows:
 | (11) |
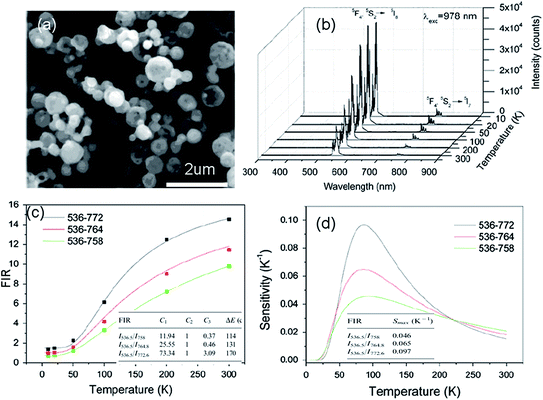 | ||
| Fig. 10 (a) SEM image, (b) up-conversion spectra under 978 nm excitation, (c) FIR of emission at 536 nm relative to 758 nm, 764 nm and 772 nm emissions, and (d) the temperature dependence of sensitivity of Y2O3:Yb3+, Ho3+ particles. Reproduced from ref. 59 with permission of Elsevier. | ||
In Table 4 we summarize, for the sake of comparison, the different performance parameters of Ho3+ doped and Ho3+–Yb3+ co-doped phosphors. The maximum value of SR, 0.0098 K−1, is obtained in Ho3+–Yb3+ co-doped TeO2 glass. The maximum value of SA, 2191.9/T2, is obtained in the Tm3+/Yb3+ co-doped oxyfluoride PbF2 glass ceramic.
| Rare-earth ions | Host | λex (nm) | λem (nm) | Transitions | Temperature range (K) | SR (maximum) | SA | Ref. |
|---|---|---|---|---|---|---|---|---|
| Ho3+ | In–Zn–Sr–Ba glass | 473 | 545, 750 | 5F4/5S2 → 5I8, 5I7 | 20–300 | 0.0036 K−1 (59 K) | 181.64/T2 | 22 |
| Ho3+ | TeO2 glass | 890 | 538, 545 | 5F4, 5S2 → 5I8 | 265–440 | 0.0098 K−1 (130 K) | 255/T2 | 62 |
| Ho3+ | LiTeO2 glass | 890 | 538, 543 | 5F4, 5S2 → 5I8 | 265–383 | 0.0063 K−1 (265 K) | 255/T2 | 63 |
| Ho3+, Yb3+ | Y2O3 | 978 | 536.5, 772.6 | 5F4/5S2 → 5I8, 5I7 | 10–300 | 0.0097 K−1 (85 K) | 241.2/T2 | 60 |
| Ho3+, Yb3+ | Ba0.77Ca0.23TiO3 | 980 | 546, 754 | 5F4/5S2 → 5I8, 5I7 | 93–300 | 0.0053 K−1 (93 K) | 182.3/T2 | 64 |
| Ho3+, Yb3+ | Ca12Al14O33 | 980 | 467, 492, 542, 552 | 5G4/5G5, 5F4/5S2 → 5I8 | 298–500 | 65 | ||
| Ho3+, Yb3+ | CaMoO4 | 980 | 460, 489 | 5F3, 3K8 → 5I8 | 303–543 | 0.0066 K−1 (353 K) | 648.5/T2 | 66 |
| Ho3+, Yb3+ | CaWO4 | 980 | 460, 487 | 5G6/5F1, 5F2,3/3K8 → 5I8 | 303–923 | 0.0050 K−1 (923 K) | 1890/T2 | 67 |
| Ho3+, Yb3+ | PbF2 glass ceramic | 980 | 445, 485 | 5G6/5F1, 5F2,3/3K8 → 5I8 | 303–643 | 0.00102 K−1 (1119 K) | 2191.9/T2 | 68 |
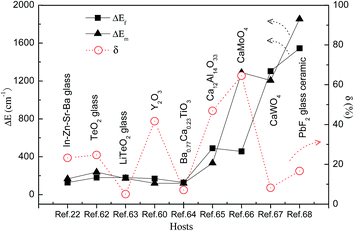
To value the fitting accuracy, ΔEf and ΔEm between the TCL of the Ho3+ ions and the corresponding δ values are calculated in Fig. 11 through analyzing ref. 22, 60 and 62–68. The thermally coupled 5F4/5S2 energy levels were studied as a temperature function in ref. 22, 60 and 62–65. The minimum δ value of 5.09% is obtained in Ho3+ doped LiTeO2 glass. The thermally coupled 5F2,3/3K8 energy levels were studied as a temperature function in ref. 66. A large δ value of 64.6% was obtained in Ho3+–Yb3+ co-doped CaMoO4. The thermally coupled 5G6/5F1 energy levels were studied in ref. 67 and 68. A small δ value of 8.2% was obtained in Ho3+–Yb3+ co-doped CaWO4. The large δ value may be ascribed to the lack of correction on eqn (11). If eqn (11) is used directly to fit ΔEf, energy transfers from the TCL to the other excited states will be neglected. In fact, when the Ho3+ concentration is high enough, the cross-relaxation process, 5S2 + 5I8 → 5I4 + 5I7, occurs frequently among Ho3+ ions.13
3.4 Optical thermometry based on Nd3+ doped phosphors
Among the rare-earth ions, Nd3+ has a 4f3 electronic configuration, and is reported as one of the most efficient activated ions to obtain laser emissions. It is significant work to study the optical thermal sensing of Nd3+ doped phosphors, since the temperature of the laser crystals can be monitored through analyzing the temperature dependent spectrum of Nd3+. Nd3+ has three couples of adjacent thermally coupled levels, 4F5/2/4F3/2 (TCL1), 4F7/2/4F3/2 (TCL2), and 4F7/2/4F5/2 (TCL3). As shown in Fig. 12, the mechanism of optical thermometry of Nd3+ doped phosphors is up-conversion and energy transfer from Yb3+ to Nd3+ assisted with phonons.69–71 It needs one 532 nm green photon to populate the thermally coupled 4F5/2 and 4F3/2 energy levels through non-radiative relaxation. Upon 980 nm laser irradiation, Yb3+ absorbs infrared photons with the generation of 2F7/2 → 2F5/2 upward transitions. Subsequently, it donates the energy to the adjacent Nd3+ through a phonon assisted energy transfer, with Yb3+ dropping back to its 2F7/2 ground state. This promotes the Nd3+ ions to their excited state, 4F3/2. The 4F5/2 energy level is populated by thermal excitation. The fluorescence intensity ratio, IU/IL, is dependent strongly on temperature, and is used to study the optical temperature sensing properties.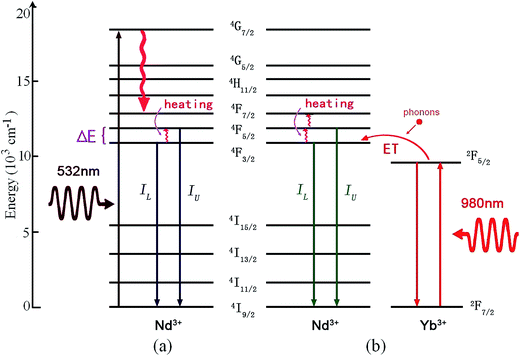 | ||
| Fig. 12 The mechanism of optical thermal sensing through (1) down-conversion of the Nd3+ ion under 532 nm green excitation, and (2) Yb3+–Nd3+ energy transfer under 980 nm infrared excitation. | ||
Recently, based on down-conversion luminescence emissions centered at 810 nm and 880 nm of Nd3+ ions, optical temperature sensing in the temperature range from 300 K to 850 K was studied by Rodríguez et al. in Nd3+ doped phosphate glass under 532 nm excitation.69 Using a 980 nm diode laser as an excitation source, the temperature sensing properties based on the infrared luminescence emissions at 755 nm, 805 nm, and 872 nm of Nd3+/Yb3+ co-doped CaWO4 powders has been discussed by Xu et al. in the temperature range from 303 K to 873 K,70 as shown in Fig. 13(a). Three TCL, such as TCL1, TCL2, and TCL3, were proven by using the fluorescence intensity ratio technique, as shown in Fig. 13(b). Similarly, the temperature sensing properties based on near infrared emissions from TCL1, TCL2, and TCL3 of Nd3+/Yb3+ co-doped oxyfluoride glass ceramic containing PbF2 nanocrystals were studied by Xu et al. as a function of temperature in the range of 303–623 K,71 as shown in Fig. 13(c) and (d). In Table 5 we summarize, for the sake of comparison, the different performance parameters of Nd3+ doped and Nd3+–Yb3+ co-doped phosphors.
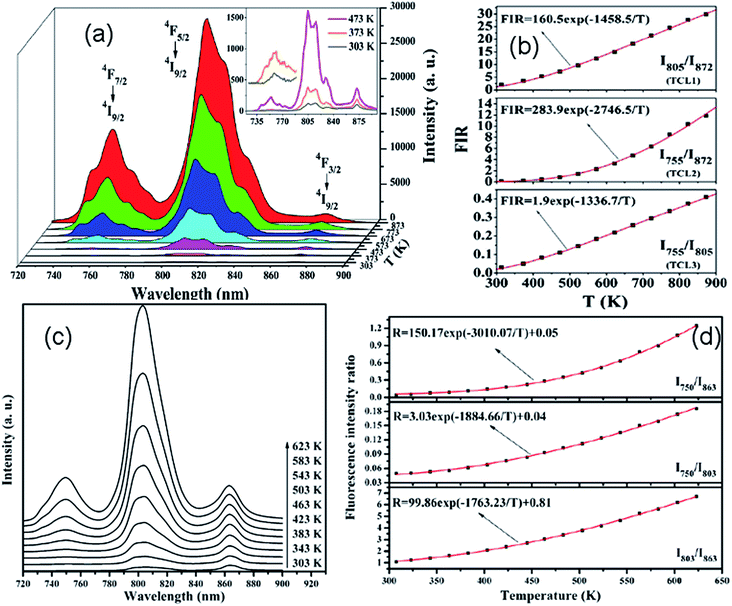 | ||
| Fig. 13 Temperature dependent (a) near infrared emission spectra and (b) fluorescence intensity ratio (FIR) in Nd3+/Yb3+ co-doped CaWO4 phosphors excited by a 980 nm laser. Temperature dependent (c) near infrared emission spectra and (d) FIR in Nd3+/Yb3+ co-doped oxyfluoride glass ceramic containing PbF2 nanocrystals excited by a 980 nm laser. Reproduced from ref. 70 and 71 with permission of Optical Society of America and Elsevier. | ||
| Rare-earth ions | Host | λex (nm) | λem (nm) | Transitions | Temperature range (K) | SR (maximum) | SA | Ref. |
|---|---|---|---|---|---|---|---|---|
| Nd3+ | P–K–Ba–Al glass | 532 | 810, 880 | 4F5/2, 4F3/2 → 4I9/2 | 300–850 | 0.0153 K−1 (300 K) | 1306.47/T2 | 69 |
| Nd3+, Yb3+ | CaWO4 | 980 | 755, 872 | 4F7/2, 4F3/2 → 4I9/2 | 303–873 | 2746.5/T2 | 70 | |
| 805, 872 | 4F5/2, 4F3/2 → 4I9/2 | 1458.5/T2 | ||||||
| 755, 805 | 4F7/2, 4F5/2 → 4I9/2 | 1336.7/T2 | ||||||
| Nd3+, Yb3+ | PbF2 glass | 980 | 750, 863 | 4F7/2/4S3/2, 4F3/2 → 4I9/2 | 303–623 | 3010.07/T2 | 71 | |
| Ceramic | 750, 803 | 4F7/2/4S3/2, 2H9/2/4F5/2 → 4I9/2 | 1884.66/T2 | |||||
| 803, 863 | F5/2/2H9/2, 4F3/2 → 4I9/2 | 1763.23/T2 |
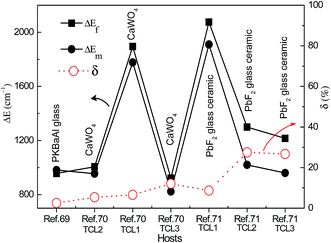
The ΔEf and ΔEm values between the TCL of Nd3+ ions and the corresponding δ values are calculated in Fig. 14 through analyzing ref. 69–71. The temperature dependent emissions at 810 nm and 880 nm from TCL1 were studied in Nd3+ doped phosphate glass (ref. 69), and a small δ value of 2.55% was obtained. The temperature dependent emissions at 755 nm, 805 nm, and 872 nm from TCL1, TCL2, and TCL3 were studied in the Nd3+–Yb3+ co-doped CaWO4 powders (ref. 70). The δ values corresponding to TCL1, TCL2 and TCL3 are calculated to be 6.58%, 5.34%, and 12.03%. The temperature dependent emissions at 750 nm, 803 nm, and 863 nm from TCL1, TCL2, and TCL3 were studied in the Nd3+–Yb3+ co-doped oxyfluoride glass ceramic (ref. 71). The corresponding δ values are calculated to be 8.69%, 27.45%, and 26.67%. If TCL1 and TCL3 are used to study the optical temperature sensing properties, we can get small and large δ values, respectively. It may be ascribed to the actual deviation of eqn (6) induced by the cross-relaxation process between the Nd3+ ions, 4F7/2 + 4I9/2 → 4F3/2 + 4I11/2.13
3.5 Optical thermometry based on Dy3+ doped phosphors
The Dy3+ ion with a 4f9 electronic configuration has a couple of adjacent TCL, 4I5/2 and 4F9/2. As shown in Fig. 15, the mechanism of optical thermometry based on luminescence of Dy3+ ions is down-conversion induced by ultraviolet excitation.72,73 Under ultraviolet excitation, Dy3+ ions are excited directly to the higher excited states by the GSA transition. The ions in the excited states relax to the next lower energy level, 4I5/2 and 4F9/2, through non-radiative relaxation. Three emissions with the intensities IU, IL, and I′L occur by the radiative transitions from 4I5/2/4F9/2 to 6H13/2 and 6H15/2. The luminescence intensity ratios, IU/IL and IU/I′L, change with temperature, and are the precise evaluation scale of optical temperature sensing.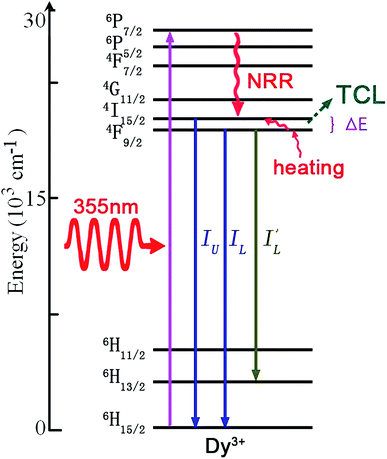 | ||
| Fig. 15 The mechanism of optical thermal sensing through down-conversion of the Dy3+ ion under 355 nm ultraviolet excitation. | ||
Optical temperature sensing of the Dy3+ doped BaYF5 nanoparticles was studied by Cao et al. in the temperature range from 293 K to 773 K.72 The temperature dependent fluorescence spectra of Dy3+ ions under excitation of a 355 nm laser in Fig. 16(a) show that the intensity of the 455 nm emission increased with a temperature increase, and the intensity of the 478 nm emission was independent of temperature. The temperature dependent luminescence intensity ratio of the 455 nm and 478 nm emissions was fitted in Fig. 16(b), in which the line fitted very well with the experimental data at a temperature higher than 380 K. By analyzing the temperature dependent 455 nm and 481 nm blue emissions, Boruc et al. demonstrated optical temperature sensing of Dy3+ doped Y4Al2O9 crystals.73 Temperature dependent emission spectra in Fig. 16(c) show that the intensity of the 455 nm emission increased with a temperature increase, and the intensity of the 481 nm emission decreased with a temperature increase. Temperature dependent luminescence intensity ratios of two blue emissions in Fig. 16(d) show different sensitivity values in two temperature ranges, such as 296 K < T < 573 K and 573 K < T < 973 K. The performance parameters of Dy3+ doped BaYF5 and Y4Al2O9 are summarized in Table 6. To value the fitting accuracy, ΔEf and ΔEm between the TCL of Dy3+ ions and the corresponding δ values are calculated through analyzing ref. 72 and 73. The δ value for the Dy3+ doped BaYF5 nanoparticles is 1.09%. For the Dy3+ doped Y4Al2O9 crystals, the δ value is 18.8% at the temperature range 296 K < T < 573 K, and it is 11.8% at the temperature range 573 K < T < 973 K. It is accurate to use the Dy3+ doped BaYF5 nanoparticles to evaluate the scale of optical temperature sensing.
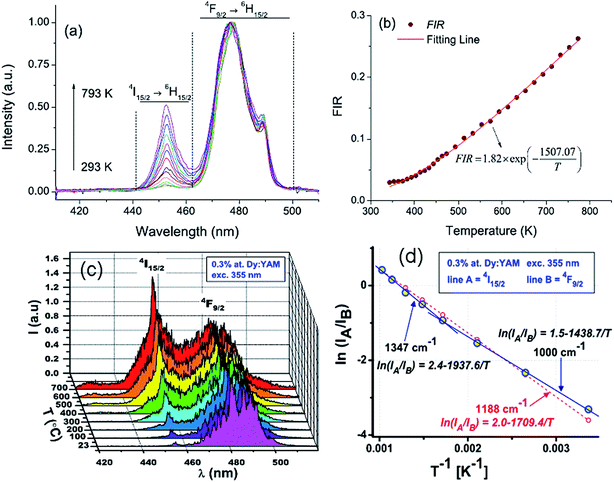 | ||
| Fig. 16 Temperature dependent (a) emission spectra and (b) fluorescence intensity ratio (FIR) between the 455 nm and 478 nm emissions for the BaYF5:2%Dy3+ sample. Temperature dependent (c) emission spectra and (d) Arrhenius plot of the intensity ratio for Dy3+ doped Y4Al2O9 crystals. Reproduced from ref. 72 and 73 with permission of Optical Society of America and Elsevier. | ||
3.6 Optical thermometry based on Eu3+ doped phosphors
Among the rare-earth ions, Eu3+ has a 4f6 electronic configuration, and is reported as one of the most efficient activated ions to realize red emission in light emitting diodes (LEDs).74–76 It is very significant to study optical thermal sensing of Eu3+ doped phosphors, since the temperature of LEDs can be monitored through analyzing the temperature dependent spectrum of Eu3+. Eu3+ has a couple of adjacent thermally coupled levels, 5D1 and 5D0. As shown in Fig. 17, the mechanism of optical thermometry based on luminescence of the Eu3+ ion is down-conversion induced by ultraviolet excitation.77–80 Under ultraviolet excitation, Eu3+ ions are excited directly to the higher excited states by the GSA transition, and then relax to the next lower energy levels, 5D1 and 5D0, through non-radiative relaxation. Two emissions with the intensity of IU and IL occur by the radiative transitions from 5D1/5D0 to 7FJ (J = 0, 1, 2, 3, 4, 5, 6). At high temperature, for high Eu3+ concentration doped phosphors, the increase in the 5D1 emissions may be attributed to a thermally assisted cross-relaxation (CR) process with the involvement of two Eu3+ ions initially in the excited 5D0 and the 7F3 state.77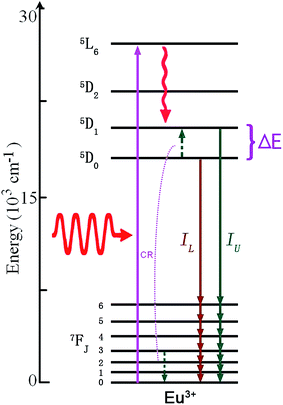 | ||
| Fig. 17 The mechanism of optical thermal sensing through down-conversion of the Eu3+ ion under infrared excitation. | ||
Meert et al. reported that the luminescence intensity ratios of the 5D1 to 5D0 emissions of the Eu3+ doped CaEu2(WO4)4 scheelites changed in an exponential form with a temperature increase,77 as shown in Fig. 18(a). The temperature dependent luminescence of spherical NaEuF4 phosphors with different particle sizes was studied by Tian et al.78 Fig. 18(b) shows the temperature dependent emission spectra of the NaEuF4 spheres of 300 nm under 394 nm excitation. ΔEf was calculated by fitting the temperature dependent emission intensity ratios of the 5D1/5D0 emissions. The sensitivity values of the spherical NaEuF4 phosphors decreased with the size increase from 100 nm to 700 nm, and a sensitivity up to 0.43% K−1 was achieved when the particle size was 100 nm. The temperature dependent luminescence spectrum of Sr2CeO4:Eu3+ was studied by Shi et al., as shown in Fig. 18(c). The integrated luminescence total intensity of the 5D0 emissions at 591 nm, 616 nm, and 654 nm showed a line change relation in the temperature range from 373 K to 573 K.79 Luminescence temperature sensing was studied by Nikolić et al. in Eu3+ doped TiO2 nanoparticles over a temperature range of 307–533 K.80 The 438 nm blue emission associated with the trap emission of the TiO2 host and the emission peak of the Eu3+ ions at 613 nm are observed in Fig. 18(d) under continuous excitation at a wavelength of 360 nm. The temperature dependent luminescence intensity ratio of the 438 nm and 613 nm emissions was suitable to be used for temperature sensing. In Table 7 we summarize, for the sake of comparison, the different performance parameters of Eu3+ doped phosphors.
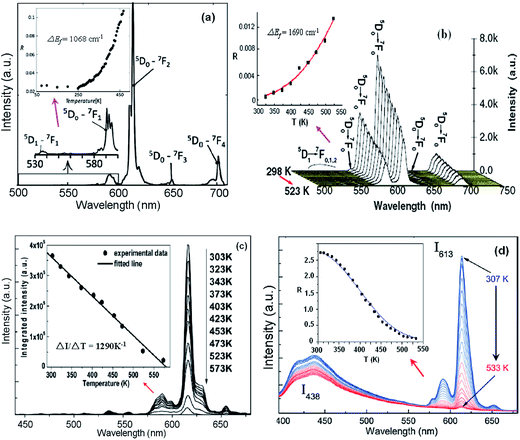 | ||
| Fig. 18 (a) Emission spectrum of CaGd1.8Eu0.2(WO4)4 upon excitation at 395 nm. The inset is the integrated intensity ratio of the 5D1 to 5D0 emissions. (b) Temperature dependent emission spectra of NaEuF4 spheres under 394 nm excitation. The inset is the emission intensity ratio of the 5D1 to 5D0 emissions with temperature. (c) Temperature dependent emission spectra of Sr2CeO4:Eu3+ under 365 nm excitation. The inset shows the integrated emission total intensity of 591 nm, 616 nm, and 654 nm at different temperatures. (d) Temperature dependent emission spectra of TiO2:Eu3+ nanopowder. The inset is the emission intensity ratio of the 438 nm and 613 nm emissions with temperature. Reproduced from ref. 74–77 with permission of Optical Society of America and Elsevier. | ||
| Rare-earth ions | Host | λex (nm) | λem (nm) | Transitions | Temperature range (K) | SR (maximum) | SA | Ref. |
|---|---|---|---|---|---|---|---|---|
| Eu3+ | CaEu2(WO4)4 scheelite | 395 | 535, 590 | 5D1, 5D0 → 7F1 | 300–500 | 0.014 K−1 (300 K) | 1515.5/T2 | 77 |
| Eu3+ | NaEuF4 phosphor | 394 | 500–560, 560–720 | 5D1, 5D0 → 7F1 | 298–523 | 0.0043 K−1 | 2398.2/T2 | 78 |
| Eu3+ | Sr2CeO4 | 365 | 591, 616, 654 | 5D0 → 7F1/2/3 | 303–573 | 1290 K−1 | 79 | |
| Eu3+ | TiO2 nanoparticles | 360 | 438, 613 | Host trap, 5D0 → 7F2 | 307–533 | 0.0243 K−1 (533 K) | 80 |
To value the fitting accuracy, ΔEf and ΔEm between the TCL of the Eu3+ ions and the corresponding δ values are calculated through analyzing ref. 77 and 78. The δ value for the Eu3+ doped CaEu2(WO4)4 scheelites is 38.7%, and the δ value for the spherical NaEuF4 phosphors is 2.5%. As for the Eu3+ doped TiO2 and Sr2CeO4, the values of δ are difficult to give, due to the incomplete data in ref. 76 and 77.
4. Conclusion and challenges
In summary, we have presented a detailed review of the Er3+, Tm3+, Ho3+, Nd3+, Dy3+, and Eu3+ doped phosphors to date for the achievement of optical temperature sensing from the analysis of temperature dependent spectra. It has been shown that many phosphors with small δ values can be used as basic light emitting materials for optical thermometry. In the case of Er3+, Tm3+, Ho3+, Nd3+, and Dy3+ doped phosphors (ΔEm ≤ 900 cm−1) thermal equilibrium can be assumed because the population of the thermally coupled levels follows a Boltzmann distribution. Beyond this limit changes in the emission intensities are due to the effect of “coupling/decoupling” at higher or lower temperatures. As in the case of the Eu3+ doped phosphors, the 5D1 and 5D0 levels (ΔEf ∼ 1725 cm−1) are thermally decoupled at lower temperatures, with thermalization at higher temperatures. With the significant fundamental scientific and technological knowledge already accumulated by past research, optical thermometry represents an encouraging prospect in the development of new temperature sensors. However, from the point of view of application, many challenges remain in the areas of materials science and physical mechanisms.One related challenge is the issue of trying to find novel phosphor materials that can be used as temperature sensors at temperatures greater than 500 °C (773 K). Luminescence of rare-earth ion doped phosphors mentioned in this review is very weak at temperatures greater than 773 K, due to intense thermal quenching. It is difficult to measure temperature change in the range of more than 500 °C through the conventional optical temperature sensing technology. New phosphors with low thermal quenching rates and high luminescence efficiency should be synthesized cheaply. Instead of rare-earth ions, new luminescence centers with high luminescence intensity at high temperature (>773 K) may be excellent candidate activated ions in novel fluorescence sensors.
Another main challenge facing the field of optical thermometry is the lack of understanding of the physical mechanisms determining the transitions between the electronic levels of both the host lattice and the rare-earth ions. A theoretical model describing thermal population between the TCL in eqn (6) is suitable to be used in the data fitting process only in the cases without energy transfer. In fact, energy transfer between the host and the rare-earth ions becomes active at high temperature, and energy transfer among the rare-earth ions becomes active at a high doping concentration. Thus, the error values of ΔEf for some phosphors mentioned in this review are large at more than 10%. In order to improve the calculation accuracy, a theoretical model describing the thermal population between the TCL in eqn (6) should be corrected for different phosphors. Additionally, the thermal affection of the excitation source should be considered in eqn (6).
Finally, we also believe that phosphor thermometry will be widely used in the future, not only for temperature detection in special environments, but also for some medical therapeutic equipment. In this sense, the development of phosphors with high thermal sensitivity and low thermal quenching of fluorescence will yield significant advances in the design of new optical temperature sensors. Colloidal phosphors with a random flightchain with biological tissues will be the target of innovation for disease diagnoses through the technology of optical temperature sensing.
Acknowledgements
This work was supported by National Natural Science Foundation of China (11404171, 11374162), Natural Science Youth Foundation of Jiangsu Province (BK20130865), the Six Categories of Summit Talents of Jiangsu Province of China (2014-XCL-021), and the Natural Science Foundation of the Jiangsu Higher Education Institutions of China (14KJB430020).References
- F. Vetrone, R. Naccache, A. Zamarrón, A. J. de la Fuente, F. S. Rodríguez, L. M. Maestro, E. M. Rodriguez, D. Jaque, J. Solé and J. A. Capobianco, ACS Nano, 2010, 4, 3254–3258 CrossRef CAS PubMed.
- C. Gunawan, M. Lim, C. P. Marquis and R. Amal, J. Mater. Chem. B, 2014, 2, 2060–2083 RSC.
- W. J. Liu and B. Z. Yang, Sens. Rev., 2007, 27, 298–309 CrossRef.
- D. Jaque and F. Vetrone, Nanoscale, 2012, 4, 4301–4326 RSC.
- C. D. S. Brites, P. P. Lima, N. J. O. Silva, A. M. An, V. S. Amaral, F. Palacio and L. D. Carlos, Nanoscale, 2012, 4, 4799–4829 RSC.
- N. Armaroli and V. Balzani, Energy Environ. Sci., 2011, 4, 3193–3222 Search PubMed.
- E. D. Larson, G. Fiorese, G. J. Liu, R. H. Williams, T. G. Kreutz and S. Consonni, Energy Environ. Sci., 2010, 3, 28–42 CAS.
- M. E. Borges, M. C. A. Galván, P. Esparza, E. Medina, P. M. Zarza and J. L. G. Fierro, Energy Environ. Sci., 2008, 1, 364–369 CAS.
- L. Guo, W. P. Dong and S. T. Zhang, RSC Adv., 2014, 4, 41956–41967 RSC.
- L. M. Maestro, C. Jacinto, U. R. Silva, F. Vetrone, J. A. Capobianco, D. Jaque and J. G. Solé, Small, 2011, 7, 1774–1778 CrossRef CAS PubMed.
- J. R. Lakowicz, I. Gryczynski, V. Bogdanov and J. Kusba, J. Phys. Chem., 1994, 98, 334–342 CrossRef CAS.
- P. Löw, B. Kim, N. Takama and C. Bergaud, Small, 2008, 4, 908–914 CrossRef PubMed.
- H. Dong, L.-D. Sun and C.-H. Yan, Chem. Soc. Rev., 2015, 44, 1608–1634 RSC.
- F. Wang and X. G. Liu, Chem. Soc. Rev., 2009, 38, 976–989 RSC.
- S. G. Xiao, X. L. Yang, Z. W. Liu and X. H. Yan, J. Appl. Phys., 2004, 96, 1360 CrossRef CAS PubMed.
- M. D. Shinn, W. A. Sibley, M. G. Drexhage and R. N. Brown, Phys. Rev. B: Condens. Matter Mater. Phys., 1983, 27, 6635–6648 CrossRef CAS.
- S. A. Wade, S. F. Collins and G. W. Baxter, J. Appl. Phys., 2003, 94, 4743–4756 CrossRef CAS PubMed.
- M. Quintanilla, E. Cantelar, F. Cusso, M. Villegas and A. C. Caballero, Appl. Phys. Express, 2001, 4, 022601 CrossRef.
- V. K. Rai, Appl. Phys. B: Lasers Opt., 2007, 88, 297–303 CrossRef CAS.
- S. F. L. Luis, U. R. R. Mendoza, E. Lalla and V. Lavín, Sens. Actuators, B, 2011, 158, 208–213 CrossRef PubMed.
- G. Z. Sui, X. P. Li, L. H. Cheng, J. S. Zhang, J. S. Sun, H. Y. Zhong, Y. Tian, S. B. Fu and B. J. Chen, Appl. Phys. B: Lasers Opt., 2013, 110, 471–476 CrossRef CAS.
- P. H. González, S. F. L. Luis, S. G. Pérez and I. R. Martín, Mater. Res. Bull., 2011, 46, 1051–1054 CrossRef PubMed.
- S. F. L. Luis, U. R. R. Mendoza, P. H. González, I. R. Martín and V. Lavín, Sens. Actuators, B, 2012, 174, 176–186 CrossRef PubMed.
- N. Vijaya, P. Babu, V. Venkatramu, C. K. Jayasankar, S. F. L. Luis, U. R. R. Mendoza, I. R. Martín and V. Lavín, Sens. Actuators, B, 2013, 186, 156–164 CrossRef CAS PubMed.
- S. F. L. Luis, U. R. R. Mendoza, I. R. Martín, E. Lalla and V. Lavín, Sens. Actuators, B, 2013, 176, 1167–1175 CrossRef PubMed.
- P. H. González, I. R. Martín, L. L. Martín, S. F. L. Luis, C. P. Rodríguez and V. Lavín, Opt. Mater., 2011, 33, 742–745 CrossRef PubMed.
- S. F. L. Luis, U. R. R. Mendoza, E. Lalla and V. Lavín, Sens. Actuators, B, 2011, 158, 208–213 CrossRef PubMed.
- Z. P. Cai and H. Y. Xu, Sens. Actuators, A, 2003, 108, 187–192 CrossRef CAS PubMed.
- P. Du, L. H. Luo, W. P. Li, Q. Y. Yue and H. B. Chen, Appl. Phys. Lett., 2014, 104, 152902 CrossRef PubMed.
- C. R. Li, B. Dong, C. G. Ming and M. K. Lei, Sensors, 2007, 7, 2652–2659 CrossRef CAS PubMed.
- M. A. R. C. Alencar, G. S. Maciel and C. B. de Araújo, Appl. Phys. Lett., 2004, 84, 4753–4755 CrossRef CAS PubMed.
- A. S. S. de Camargo, J. F. Possatto, L. A. O. Nunes, E. R. Botero, E. R. M. Andreeta, D. Garcia and J. A. Eiras, Solid State Commun., 2006, 137, 1–5 CrossRef CAS PubMed.
- B. Dong, B. S. Cao, Y. Y. He, Z. Liu, Z. P. Li and Z. Q. Feng, Adv. Mater., 2012, 24, 1987–1993 CrossRef CAS PubMed.
- X. Wang, X. G. Kong, Y. Yu, Y. J. Sun and H. Zhang, J. Phys. Chem. C, 2007, 111, 15119–15124 CAS.
- P. V. dos Santos, M. T. de Araujo, A. S. Gouveia-Neto, J. A. M. Neto and A. S. B. Sombra, IEEE J. Quantum Electron., 1999, 35, 395–399 CrossRef CAS.
- X. F. Wang, C.-S. Liu and X. H. Yan, RSC Adv., 2014, 4, 24170–24175 RSC.
- F. Vetrone, R. Naccache, A. Zamarrón, A. J. de la Fuente, F. S. Rodríguez, L. M. Maestro, E. M. Rodriguez, D. Jaque, J. G. Solé and J. A. Capobianco, ACS Nano, 2010, 4, 3254–3258 CrossRef CAS PubMed.
- K. Z. Zheng, W. Y. Song, G. H. He, Z. Yuan and W. P. Qin, Opt. Express, 2015, 23, 7653–7658 CrossRef PubMed.
- V. K. Rai, A. Pandey and R. Dey, J. Appl. Phys., 2013, 113, 083104 CrossRef PubMed.
- V. Lojpur, G. Nikoli and M. D. Dramianin, J. Appl. Phys., 2014, 115, 203106 CrossRef PubMed.
- P. Du, L. H. Luo, Q. Y. Yue and W. P. Li, Mater. Lett., 2015, 143, 209–211 CrossRef CAS PubMed.
- R. Dey, A. Pandey and V. K. Rai, Sens. Actuators, B, 2014, 190, 512–515 CrossRef CAS PubMed.
- B. Dong, D. P. Liu, X. J. Wang, T. Yang, S. M. Miao and C. R. Li, Appl. Phys. Lett., 2007, 90, 181117 CrossRef PubMed.
- A. K. Soni, A. Kumari and V. K. Rai, Sens. Actuators, B, 2015, 216, 64–71 CrossRef CAS PubMed.
- N. Rakov and G. S. Maciel, Sens. Actuators, B, 2012, 164, 96–100 CrossRef CAS PubMed.
- N. Rakov and G. S. Maciel, Opt. Lett., 2014, 39, 3767–3769 CrossRef CAS PubMed.
- A. Pandey, V. K. Rai, V. Kumar, V. Kumar and H. C. Swart, Sens. Actuators, B, 2015, 209, 352–358 CrossRef CAS PubMed.
- M. K. Mahata, K. Kumar and V. K. Rai, Sens. Actuators, B, 2015, 209, 775–780 CrossRef CAS PubMed.
- P. Du and J. S. Yu, Ceram. Int., 2015, 41, 6710–6714 CrossRef CAS PubMed.
- P. Du, L. H. Luo, W. P. Li and Q. Y. Yue, J. Appl. Phys., 2014, 116, 014102 CrossRef PubMed.
- W. Xu, Z. G. Zhang and W. W. Cao, Opt. Lett., 2012, 37, 4865–4867 CrossRef CAS PubMed.
- B. S. Cao, Y. Y. He, Z. Q. Feng, Y. S. Li and B. Dong, Sens. Actuators, B, 2011, 159, 8–11 CrossRef CAS PubMed.
- H. Zou, J. Li, X. S. Wang, D. F. Peng, Y. X. Li and X. Yao, Opt. Mater. Express, 2014, 4, 1545–1554 CrossRef CAS.
- M. Quintanilla, E. Cantelar, F. Cussó, M. Villegas and A. C. Caballero, Appl. Phys. Express, 2011, 4, 022601 CrossRef.
- A. Pandey, S. Som, V. Kumar, V. Kumar, K. Kumar, V. K. Rai and H. C. Swart, Sens. Actuators, B, 2014, 202, 1305–1312 CrossRef CAS PubMed.
- A. F. Pereira, K. U. Kumar, W. F. Silva, W. Q. Santos, D. Jaque and C. Jacinto, Sens. Actuators, B, 2015, 213, 65–71 CrossRef CAS PubMed.
- W. Xu, X. Y. Gao, L. J. Zheng, Z. G. Zhang and W. W. Cao, Sens. Actuators, B, 2012, 173, 250–253 CrossRef CAS PubMed.
- D. Y. Li, Y. X. Wang, X. R. Zhang, K. Yang, L. Liu and Y. L. Song, Opt. Commun., 2012, 285, 1925–1928 CrossRef CAS PubMed.
- V. Lojpur, M. Nikolic, L. Mancic, O. Milosevic and M. D. Dramicanin, Ceram. Int., 2013, 39, 1129–1134 CrossRef CAS PubMed.
- K. Z. Zheng, Z. Y. Liu, C. J. Lv and W. P. Qin, J. Mater. Chem. C, 2013, 1, 5502–5507 RSC.
- X. F. Wang, J. Zheng, Y. Xuan and X. H. Yan, Opt. Express, 2013, 21, 21596–21606 CrossRef CAS PubMed.
- A. K. Singh, Sens. Actuators, A, 2007, 136, 173–177 CrossRef CAS PubMed.
- A. K. Singh and S. B. Rai, Appl. Phys. B, 2007, 86, 661–666 CrossRef CAS.
- P. Du, L. H. Luo and J. S. Yu, J. Alloys Compd., 2015, 632, 73–77 CrossRef CAS PubMed.
- R. K. Verma and S. B. Rai, J. Quant. Spectrosc. Radiat. Transfer, 2012, 113, 1594–1600 CrossRef CAS PubMed.
- R. Dey, A. Kumari, A. K. Soni and V. K. Rai, Sens. Actuators, B, 2015, 210, 581–588 CrossRef CAS PubMed.
- W. Xu, H. Zhao, Y. X. Li, L. J. Zheng, Z. G. Zhang and W. W. Cao, Sens. Actuators, B, 2013, 188, 1096–1100 CrossRef CAS PubMed.
- W. Xu, X. Y. Gao, L. J. Zheng, Z. G. Zhang and W. W. Cao, Opt. Express, 2012, 20, 18127–18137 CrossRef CAS PubMed.
- C. P. Rodríguez, L. L. Martín, S. F. L. Luis, I. R. Martín, K. K. Kumar and C. K. Jayasankar, Sens. Actuators, B, 2014, 195, 324–331 CrossRef PubMed.
- W. Xu, Q. T. Song, L. J. Zheng, Z. G. Zhang and W. W. Cao, Opt. Lett., 2014, 39, 4635–4638 CrossRef CAS PubMed.
- W. Xu, H. Zhao, Z. G. Zhang and W. W. Cao, Sens. Actuators, B, 2013, 178, 520–524 CrossRef CAS PubMed.
- Z. M. Cao, S. S. Zhou, G. C. Jiang, Y. H. Chen, C. K. Duan and M. Yin, Curr. Appl. Phys., 2014, 14, 1067–1071 CrossRef PubMed.
- Z. Boruc, M. Kaczkan, B. Fetlinski, S. Turczynski and M. Malinowski, Opt. Lett., 2012, 37, 5214–5216 CrossRef CAS PubMed.
- D. Q. Chen, Y. L. Yu, P. Huang, H. Lin, Z. F. Shan and Y. S. Wang, Acta Mater., 2010, 58, 3035–3041 CrossRef CAS PubMed.
- S. H. Park, K. H. Lee, S. Unithrattil, H. S. Yoon, H. G. Jang and W. B. Im, J. Phys. Chem. C, 2012, 116, 26850–26856 CAS.
- J. Zhang, Y. M. Yang, Y. Z. Liu, C. Mi, G. Li, B. Han, Y. Zhang and H. J. Seo, J. Am. Ceram. Soc., 2015, 98, 1567–1573 CrossRef CAS PubMed.
- K. W. Meert, V. A. Morozov, A. M. Abakumov, J. Hadermann, D. Poelman and P. F. Smet, Opt. Express, 2014, 22, 961–972 CrossRef PubMed.
- Y. Tian, B. N. Tian, C. Cui, P. Huang, L. Wang and B. J. Chen, Opt. Lett., 2014, 39, 4164–4167 CrossRef CAS PubMed.
- L. L. Shi, C. Y. Li and Q. Su, Opt. Lett., 2011, 36, 582–584 CrossRef CAS PubMed.
- M. G. Nikolić, Ź. Antić, S. Ćulubrk, J. M. Nedeljković and M. D. Dramićanin, Sens. Actuators, B, 2014, 201, 46–50 CrossRef PubMed.
| This journal is © The Royal Society of Chemistry 2015 |

