Origin of the highly anisotropic thermal expansion of the semiconducting ZnSb and relations with its thermoelectric applications

P. Hermet*a, M. M. Kozab, C. Ritterb, C. Reibela and R. Viennois*a
aInstitut Charles Gerhardt Montpellier, UMR-5253 CNRS, Université de Montpellier, Place E. Bataillon, 34095 Montpellier Cédex 5, France. E-mail: patrick.hermet@univ-montp2.fr; romain.viennois@univ-montp2.fr
bInstitut Laue Langevin, 6 Rue Jules Horowitz, B.P. 156, 38042 Grenoble Cédex 9, France

Received 21st August 2015 , Accepted 6th October 2015

First published on 6th October 2015


Abstract

This article is devoted to the thermal expansion of ZnSb combining experiments (neutron and X-ray) and calculations based on density functional theory. Related properties are also studied such as: the zone-center (Raman and infrared) phonon modes, the dielectric (electronic and static) tensors, the phonon density-of-states, the specific heats and the isotropic atomic displacement parameters. Our experimental data show highly anisotropic thermal expansion with large values along the a-direction. Concomitantly, a large increase of the Zn–Zn intra-ring distances and of one of the intra-ring Zn–Sb distances is observed, while other interatomic distances do not significantly change. In agreement with our calculations, the thermal expansion has positive values along the three crystal directions except around 30 K where it has weak negative values along the b and c-directions. This anomalous expansion is more important along the c-direction and it is mainly due to phonon modes with frequencies up to 75 cm−1. These modes are located in the SYΓ (resp. ΓZ) q-point range along the b (resp. c) direction. Phonon modes located in the ΓX and in the YΓZ q-point range with frequencies up to 175 cm−1 are responsible for the positive large thermal expansion at room temperature along the a-direction. The much reduced anisotropy of the thermal conductivity is related to the lower Debye temperatures along the b and c-directions and mainly to the small transverse sound velocity between these directions.

I. Introduction

AIIBV semiconducting compounds have an orthorhombic structure associated to a weak electronic band gap (∼0.5 eV at room temperature).1–3 As a consequence, they have not only interesting anisotropic properties for electronic/thermoelectric applications and optical applications in the infrared range,1–4 but they are also studied for their catalytic properties1 and possible energy storage applications as starting materials for anodes in Li-ion batteries.5–7

Among these compounds, zinc antimonide (ZnSb) has been particularly studied from the forties for its good thermoelectric properties and its use in high temperature thermogeneration of electricity.1–3,8,9 The efficiency of thermoelectric generators is related to the dimensionless figure of merit: image file: c5ra16956a-t1.tif, where α is the thermopower, ρ is the electrical resistivity, κ is the thermal conductivity and T is the temperature. More than forty years ago during the first period of active search of efficient thermoelectric materials, a ZT ∼ 0.6 at 500 K was reported for p-type ZnSb.9 In the nineties, there was renewed interest for thermoelectric materials and in 1997 a large ZT ∼ 1.3 at 670 K was found for another zinc antimonide, β-Zn4Sb3, which is a metastable p-type rhombohedral semiconductor containing a large amount of interstitial and vacancy defects.10–12 Since this time, little improvement was achieved and difficulties related to its limited stability have restricted its applications.13–15 However, several groups have recently reinvestigated, both theoretically and experimentally, the AIIBV semiconducting compounds for thermoelectric applications, and more particularly ZnSb8,16–30 for its higher stability and doping versatility (it can be n-doped) than β-Zn4Sb3. Nowadays, the ZT of ZnSb has been improved using two different routes. The first route is the nanostructuration of ZnSb by ball milling for which Okamura et al.16 observed a ZT as large as 0.9 at 550 K, notably because of the decrease of thermal conductivity by a factor ∼2. However, less good thermoelectric properties were found by another group18 induced by an additional strong reduction of the power factor. Nonetheless, the stability of specimens prepared by this route requires further long-time high-temperature studies. The second route is the doping by Ag-atoms which leads to ZT ≈ 1 above 500 K for ZnSb8,22 and ZT ≈ 1.3 at 560 K for CdSb.24 The important issues that require additional studies are the long-time stability of the Ag-doped compound and the toxicity of CdSb whose the decomposition temperature is lower by about 100 K than in ZnSb.1

Thus, to optimize the thermoelectric properties of ZnSb a better understanding of its thermal and physical properties comprising the established anisotropy effects is required. As discussed by Haussermann's group,23,28 both Zn and Sb have peculiar five-fold coordination with one-like and four-unlike neighbours. The four first Sb-neighbors around Zn-atoms are forming distorted tetrahedra which share one of their edges with that of neighboring ZnSb4 tetrahedra. The two Sb atoms shared by two neighboring tetrahedra are forming the Zn2Sb2 rings with the two Zn-atoms in the center of these distorted ZnSb4 tetrahedra (see Fig. 1). Thus, the coordination of the AIIBV semiconducting compounds is ruled by an underlying tetrahedral principle, although these tetrahedra are distorted. The chemical bondings of these compounds are therefore quite unusual. Indeed, there are two types of bonding. The first one corresponds to 2 electrons–2 centers (2e–2c) covalent bondings. There are three of such bondings: one linking the Sb-atoms between them (the so-called Sb–Sb dimer), and two linking Zn-atoms with Sb-atoms belonging to different Zn2Sb2 rings. The second one is a multicenter chemical bonding formed by electrons of the four atoms belonging to the same Zn2Sb2 rings. This picture was first proposed by Velicky et al.31 fifty years ago and was then confirmed and refined very recently with two different pictures proposed for the multicenter bonding from first principles calculations.24,28


image file: c5ra16956a-f1.tif
Fig. 1 Crystallographic structure of ZnSb highlighting the different interatomic distances (a). Selected Sb and Zn-atoms are labeled respectively with S and Z. The crystal structure corresponds to the experimental data at 300 K. (b) Coordination of the ten neighboring Zn2Sb2 rings around one Zn2Sb2 ring.

The consequences are important for understanding the anisotropy of the physical properties and more specifically the thermal properties of AIIBV compounds. Although the thermal conductivity of ZnSb and CdSb is weakly anisotropic, several studies performed several decades ago showed that in contrast their thermal expansion is strongly anisotropic.32–34 In a very recent study, Fischer et al.23 also found highly anisotropic thermal expansion in ZnAs with the b and c-lattice parameters decreasing with increasing temperature. Nevertheless, these observations still need to be confirmed both experimentally and theoretically.

In the present paper, we report an experimental study of the ZnSb thermal expansion combining neutron and X-ray diffraction. We confirm the high anisotropy of its thermal expansion which contrasts with the low anisotropy of its thermal conductivity reported in the literature. We analyze the origin of this anisotropy and the consequences on the ZnSb thermoelectric applications. We observe weak negative values of the ZnSb thermal expansion around 30 K along the b-crystal direction with higher negative values along the c-direction. The understanding of the mechanisms at the origin of these observations is established using a theoretical support based on the coupling between the density functional theory and the quasi-harmonic approximation. The analysis of the thermal expansion of ZnSb allows us to focus on other of its properties such as: the phonon density-of-states, the isotropic atomic displacement parameters, the specific heats and the lattice dynamics. For the latter, we report in particular the calculated pressure dependence of phonon modes and we give the contribution of the polar transverse optical modes to the static dielectric constants.

II. Experimental details

Polycrystalline samples of orthorhombic ZnSb were synthesized into two steps. In a first step, direct reaction of stoichiometric amounts of elemental zinc and antimony (both 99.999% purity) pieces in carbon-coated quartz tube were carried out at 700 °C during one day followed by a water quench. In a second step, the samples were annealed at 510 °C for three days. The purity and crystal structure of the samples were analyzed using a powder Philips XPERT PRO II diffractometer with Cu Kα1 and Kα2 wavelengths. A Rieveld refinement was performed with the Fullprof program.35 Three different batches were prepared for the inelastic neutron scattering (INS) experiments with a total weight of ∼14 g. Two batches contained less than 1% of antimony and one was found to be single-phase as confirmed by X-ray diffraction (XRD) and Rietveld refinement.

For the high-temperature range, we have performed XRD on powdered specimen from the single-phase batch up to 450 K using an Empyrean diffractometer with Cu Kα1 and Kα2 wavelength, a 0.013° step, and a heater made of platinum. At 500 K, the sample reacted with the platinum heater. The lattice parameter as a function of temperature was determined from Lebail refinement using the Fullprof program. For the low-temperature range, neutron powder diffraction experiments were performed on the D2B diffractometer at Institut Laue Langevin (ILL) with the 1.594 Å wavelength and a 0.05° angle step from 3 to 300 K in an Orange Cryostat. Neutron diffraction were performed on the same three batches as for the INS experiments. This could explain the small difference observed for the c lattice parameter. Rietveld refinement of the data was performed using the Fullprof program for determining not only the lattice parameter but also the atomic positions and the isotropic atomic displacement parameters as a function of temperature (see ESI). The thermal expansion at a temperature, T, was calculated according to: image file: c5ra16956a-t2.tif, where (ai)i=1,2,3 are the lattice parameters.

INS experiments were performed on the IN6@ILL time-of-flight (ToF) spectrometer located at the ILL. An incident neutron wavelength of 4.14 Å and the time-focusing option with a focus set to 7 meV were used. Data have been collected at 300 K within a cryostat at a helium pressure of ∼10 mbars. Standard correction procedures were applied to the data comprising background and frame-overlap corrections, normalization to vanadium standard, suppression of malfunctioning detector tubes, correction of neutron wavelength dependent efficiencies of the He-detectors and multiphonon corrections. The multiphonon corrections were carried out with the software package MuPhoCorr.36 The generalized density-of-states, G(E), was calculated according to ref. 37 and 38.

Heat capacity experiments were performed between 3.5 and 40 K with the relaxation technique using a commercial microcalorimeter from Oxford Instruments. Raman scattering experiments were performed on a T64000 spectrometer from Horiba-Jobin Yvon using: a nitrogen-cooled CCD detector, backscattering geometry, triple-monochromator configuration and the 633 nm line radiation of a He–Ne laser. The resolution was 1 cm−1 and the power on the sample was 0.3 mW for a beam radius of ∼1 μm. As the size of the crystals in our polycrystalline samples was much larger than the beam size, for each investigated zone, we were probing only one crystal. Hence, some modulation on the Raman line intensities can occur due to different random crystal orientations.

III. Computational details

First-principles calculations are performed within the density functional theory (DFT) framework as implemented in the ABINIT package.39 The exchange–correlation energy functional is evaluated using the generalized gradient approximation (GGA) parametrized by Perdew, Burke and Ernzerhof.40 The all-electron potentials are replaced by norm-conserving pseudopotentials generated according to the Troullier–Martins scheme.41 Zn(3d10, 4s2) and Sb(5s2, 5p3)-electrons are considered as valence states. The electronic wave functions are expanded in plane-waves up to a kinetic energy cutoff of 67 Ha and integrals over the Brillouin zone are approximated by sums over a 6 × 6 × 6 mesh of special k-points according to the Monkhorst–Pack scheme.42

Dynamical matrix, dielectric constants, Born effective charges and elastic constants are calculated within a variational approach to density functional perturbation theory43 (DFPT). Phonon dispersion curves are interpolated according to the scheme described by Gonze et al.44 In this scheme, the dipole–dipole interactions are subtracted from the dynamical matrices before Fourier transformation, so that only the short-range part is handled in real space. We considered a 3 × 3 × 3 q-points grid for the calculation of the phonon band structure and the thermal expansion, while a denser 100 × 80 × 80 grid is used for the calculation of the phonon density-of-states and heat capacity.

Lattice parameters and atomic positions were fully relaxed using a Broyden–Fletcher–Goldfarb–Shanno algorithm until the maximum stresses and residual forces were less than 2 × 10⁻⁶ GPa and 6 × 10⁻⁵ Ha per Bohr, respectively. Our relaxed lattice parameters (a = 6.290 Å, b = 7.831 Å and c = 8.237 Å) slightly overestimate the experimental ones45 (aexp = 6.202 Å, bexp = 7.742 Å and cexp = 8.100 Å) by less than 1.7% as usually observed with GGA exchange–correlation functionals.

IV. Results and discussion

A. Temperature dependence of the crystallographic parameters

Fig. 2 shows the thermal dependence of the ZnSb lattice parameters measured using neutron and X-ray diffraction. We observe that the lattice parameter along the a-direction increases monotonically up to 450 K by 0.8%, whereas that along the b-direction increases by 0.4% only. The lattice parameter along the c-direction shows a more complex behaviour: it decreases from 3 to 50 K and increases weakly above this temperature up to 450 K by 0.15%. The thermal expansion of ZnSb is therefore significantly anisotropic with much larger values along a than along c. The details of our Rietveld refinement of the neutron diffraction pattern from 3 to 305 K are reported in the ESI.
image file: c5ra16956a-f2.tif
Fig. 2 Thermal variation of the lattice parameters of ZnSb determined from Rietveld refinement of neutron diffraction patterns (solid symbols) and from Lebail fitting of X-ray diffraction patterns (open symbols). The size of the symbols matches the reliability parameters of the fits.

There are three different intra-ring interatomic distances within one Zn2Sb2 ring (see Fig. 1): two Zn–Sb distances (ds1–z2 or ds3–z4 and ds1–z4 or ds3–z2) and one Zn–Zn distance (dZ2–Z4). Their thermal variations are shown in Fig. 3. The longest S1–Z2 distance and the Z2–Z4 distance increase by about ∼0.86% upon T changes, whereas the shortest S1–Z4 distance of about 2.75 Å does not change.


image file: c5ra16956a-f3.tif
Fig. 3 Thermal variation of the intra-ring (top) and inter-ring interatomic distances (bottom). See Fig. 1 for the atom labels.

Upon heating the intra-ring dS1–S3 increases by ∼0.32% from 4.91 Å at 3 K to 4.925 Å at 305 K, which is significantly less than for the case of Zn–Zn distance. Because all four atoms forming a Zn2Sb2 ring are in the same plane, the deformation of the rings can also be characterized by the interatomic angles. They are reported in details in the ESI. It is worth to note that all the Zn–Zn–Sb angles, and thus the Z2–Z4 distance, change significantly with temperature. In the same manner, the Sb–Zn–Sb and Zn–Sb–Zn angles comprising the longest ds1–z2 or ds3–z4 vary strongly with the temperature. All the above results indicate that the shape of the Zn2Sb2 rings is deformed due to the increased Zn–Zn distance.

Let us focus now on the inter-ring distances. As can be seen in Fig. 3, there are three inter-ring distances to consider: the two shortest Zn–Sb distances, ds1–z1 or ds5–z4 and ds1–z3 or ds4–z4, and the long inter-ring Sb–Sb distance (dS1–S2). Both ds1–z1 and dS1–S2 increase by ∼0.1–0.2%, which is comparable to the experimental error. The shortest ds1–z3 increases by 0.325%. Note that some of the interatomic angles implying at least one inter-ring bonding change significantly with increasing temperature whereas some others do not. These are essentially angles comprising the shortest inter-ring distance ds1–z3. See ESI for detailed results.

In conclusion, these results indicate that an uniform increase of the size of the Zn2Sb2 rings upon heating is related to the dominant increase of the Zn–Zn intra-ring distances. The distances between the Zn2Sb2 rings show a smaller variation while experiencing a slight rotation. The large anisotropy of the thermal expansion, and especially the large expansion along the a-direction, is linked to the strong deformation of the Zn2Sb2 rings. These trends are also observed in ZnAs as it shows23 a dominant thermal expansion along a, and similar thermal variation of the Zn–As intra-ring distances and Zn-distances. Finally, we cannot establish a clear correlation between the changes in the ZnSb microscopic structure and its weak negative thermal expansion at low temperatures along the c-direction because of the limited experimental data below 100 K.

B. Dielectric properties

The optical dielectric tensor (ε) corresponds to the purely electronic response to a static electric field. Standard DFT usually overestimates the experimental value of ε due to the lack of the polarization dependence of GGA exchange–correlation functionals.46 To overcome this problem, it is a common practice to apply the so-called scissors correction47 in which we use an empirical rigid shift of the conduction bands to adjust the GGA band-gap value to the experimental one. By comparing our calculated band-gap value (Ecalcg = 0.01 eV) with the experimental2 one (Eexpg = 0.53 eV), the scissors correction is fixed to 0.52 eV. As expected, this correction decreases the values of the optical dielectric tensor, but does not change their trends (see Table 1). The refractive indices after the scissors correction have amplitudes comparable to the experimental ones.
Table 1 Optical dielectric tensor (ε), optical refractive index (image file: c5ra16956a-t16.tif) and static dielectric tensor (ε0) calculated at the GGA level and with a scissors correction of 0.52 eV (GGA + SCI). Experimental refractive indexes measured at room temperature by Komiya et al.2 are also reported between brackets
  GGA GGA + SCI
a Measured at 2 μm.
ε11 34.115 26.970
ε22 26.928 21.521
ε33 29.586 23.010
n1 5.841 5.193 (5.4a)
n2 5.189 4.639 (4.7a)
n3 5.439 4.797 (5.0a)
ε011 41.425 34.280
ε022 32.959 27.552
ε033 37.604 31.029


The fixed-strain relaxed-ion dielectric tensor (εη) can be obtained by adding to ε the contribution coming from the response of the ions (εph) to the electric field. To estimate this phonon-mediated contribution, one can use a model that assimilates the solid to a system of undamped harmonic oscillators. Doing so, εη appears as:43,48

 
image file: c5ra16956a-t3.tif(1)
where the sum runs over all polar TO modes m, the Greek indices denote the Cartesian components, Ω0 is the unit cell volume, [S with combining tilde] is the infrared oscillator strength, and ωm is the frequency of the mode m. The mode-by-mode decomposition listed in Table 2 shows that εph22 is dominated by two B2u-modes calculated at 38 and 184 cm−1. In contrast, no clear dominance of the phonon modes is observed for the εph11 and εph33 components. εη comes by ∼75% from ε.

Table 2 Calculated transverse optical (TO) phonon contributions (ωm, given in cm−1) to static dielectric tensors and mode oscillator strengths (Sm, ×10−5 a.u.). Note: 1 a.u. = 253.2638413 m3 s−2
  B1u-modes B2u-modes B3u-modes
ωm Sm εph33,m ωm Sm εph22,m ωm Sm εph11,m
TO1 51 1.978 1.710 38 1.591 2.402 57 2.615 1.778
TO2 54 0.570 0.426 56 0.283 0.196 62 1.071 0.613
TO3 117 10.168 1.629 110 3.183 0.582 120 9.959 1.531
TO4 142 20.130 2.208 140 0.147 0.017 154 23.114 2.156
TO5 176 28.711 2.046 184 43.523 2.834 173 16.745 1.231
Total (phonons)     8.019     6.031     7.310


C. Zone-center phonon modes

At the zone-center, optical phonon modes of ZnSb can be classified according to the irreducible representations of the D2h point group into: Γopt = 6Ag ⊕ 6B1g ⊕ 6B3g ⊕ 6B2g ⊕ 6Au ⊕ 5B1u ⊕ 5B3u ⊕ 5B2u. The gerade representations are Raman active. The Au representation is silent. The remaining ungerade representations (B3u, B2u and B1u) are infrared active and the associated modes are polarized along the a, b and c-axis, respectively. Close to the Γ-point, the macroscopic electric field splits the polar active modes into transverse optical (TO) and longitudinal optical (LO) modes. The LO frequencies are calculated43 from the TO frequencies with the additional knowledge of the Born effective charges and ε. The analysis of the infrared reflectivity spectra allows to quantify the LO–TO splitting strength. They are calculated at normal incidence and are displayed in the left hand side of Fig. 4. The reflectivity saturates to unity because our formalism neglects the damping of the phonon modes. We also report the average reflectivity spectrum in the case of a polycrystalline ZnSb powder assuming a quasi-continuous and random distribution of the crystallite orientations. We observe that the LO–TO splitting is small; the largest splitting is estimated to 10 cm−1 for the B2u(TO5) mode. This observation is consistent with the experimental spectra reported by Smirnov et al.49 on single crystals. Table 3 lists our calculated TO and LO phonon frequencies classified according to their symmetry with the available experimental frequencies. Over the 15 infrared TO modes expected by the group theory, 12 have been experimentally assigned and they are in reasonable agreement with our calculations. The three remaining modes are calculated at 54 (B1u), 62 (B3u) and 140 cm−1 (B2u). Experimentally, they are difficult to detect as they combine both a small oscillator strength and a weak LO–TO splitting (see Table 2 and Fig. 4). This is even more difficult for the modes below 140 cm−1 because of the 2 cm−1 resolution used in the reflectivity experiments of Smirnov et al.49
image file: c5ra16956a-f4.tif
Fig. 4 (Left hand side) Calculated infrared reflectivity spectra on polycrystal and on single crystals with light polarization along (100) [B3u], (010) [B2u] and (001) [B1u] directions. (Right hand side) Experimental unpolarized Raman spectra. Open symbols represent experimental data of Smirnov et al.49 Calculated positions of the Raman lines with their symmetry are sketched by the bars and crosses at the bottom of the figure.
Table 3 Calculated frequencies of polar modes along with the experimental ones. Calculated pressure dependence and Grüneisen parameter of modes are also given
Mode symmetry TO-modes LO-modes
  Calc. (cm−1) Exp.49 (cm−1) dω/dP (cm−1 GPa−1) γm   Calc. (cm−1)
B2u TO1 38 44 −0.14 −0.18 LO1 39
B1u TO1 51 58 −0.20 −0.19 LO2 52
B1u TO2 54   0.00 0.00 LO2 55
B2u TO2 56 61 0.12 0.11 LO2 57
B3u TO1 57 66 −0.13 −0.11 TO1 58
B3u TO2 62   0.49 0.38 LO2 63
B2u TO3 110 119 1.01 0.44 LO3 111
B1u TO3 117 121 1.29 0.53 LO3 120
B3u TO3 120 123 1.10 0.44 LO3 122
B2u TO4 140   1.55 0.53 LO4 140
B1u TO4 142 154 1.78 0.60 LO4 147
B3u TO4 154 166 1.51 0.47 LO4 158
B3u TO5 173 184 1.79 0.50 LO5 178
B1u TO5 176 189 1.83 0.50 LO5 184
B2u TO5 184 195 1.94 0.51 LO5 194


The experimental unpolarized Raman spectrum of ZnSb is displayed in the right hand side of Fig. 4, together with the position of the Raman lines measured by Smirnov et al.49 and obtained by our calculation. We observe a quite good agreement between our calculation and the two sets of experimental data. This agreement is even better with our experimental data as Smirnov et al.49 do not clearly observe the Raman lines between 120 and 160 cm−1. We unambiguously assign two additional experimental lines at 130 and 146 cm−1.

The pressure dependence of the zone-center phonon modes has been calculated using the mode Grüneisen parameter:

 
image file: c5ra16956a-t4.tif(2)
where P is the external pressure, B0 is the bulk modulus, and the subscript ‘0’ indicates a quantity taken at the equilibrium lattice parameters. The γm have been computed for three pressures: ambient and ±0.5 GPa. Results are listed in Table 3 (infrared) and 4 (Raman + silent modes). All modes show a standard pressure dependence (i.e. their frequency increases with increasing pressure) except the Raman B2g-mode and the silent Au-mode at the lowest frequency and three polar modes [B2u(TO1), B1u(TO1), B3u(TO1)] which exhibit a softening. The largest softenings are predicted for the B1u(TO1) mode (−0.20 cm−1 GPa−1) and the Au mode centered at 35 cm−1 (−0.24 cm−1 GPa−1). The negative pressure dependence of the calculated Raman mode is experimentally supported by Triches et al.17 on ZnSb nanograins. In addition, they also observed that the hydrostatic pressure induces a standard increase of the energy of the Raman modes centered at 177 (B1g) and 172 cm−1 (Ag) in agreement with our calculations as these two modes have Grüneisen parameters calculated as positive (see Table 4).

Table 4 Calculated frequencies, pressure dependence and Grüneisen parameter of unpolar modes
Raman-modes Silent-modes
Mode symmetry Freq. (cm−1) dω/dP (cm−1 GPa−1) γm Mode symmetry Calc. (cm−1) dω/dP (cm−1 GPa−1) γm
B2g 48 −0.05 −0.05 Au 35 −0.24 −0.32
Ag 54 0.03 0.02 Au 44 0.15 0.16
B1g 61 0.17 0.13 Au 58 0.17 0.14
B3g 75 0.33 0.21 Au 91 0.39 0.21
Ag 75 0.80 0.51 Au 153 2.05 0.64
Ag 81 0.55 0.33 Au 185 1.99 0.52
B3g 85 0.83 0.47        
B1g 87 1.13 0.62        
B2g 99 1.13 0.54        
B3g 114 1.18 0.50        
B1g 119 0.87 0.35        
B2g 121 1.03 0.41        
B2g 144 1.26 0.42        
B3g 155 1.22 0.38        
B1g 158 0.63 0.19        
B3g 160 0.72 0.21        
Ag 161 0.93 0.28        
Ag 165 1.37 0.40        
B2g 167 0.58 0.17        
B1g 172 1.45 0.40        
B1g 177 1.49 0.40        
B3g 183 1.58 0.41        
B2g 189 1.73 0.44        
Ag 190 1.78 0.45        


D. Phonon dispersion curves and density-of-states

The phonon dispersion curves of ZnSb calculated using the DFPT formalism are displayed in Fig. 5 along high-symmetry directions. These results agree with prior DFT-based calculations29,30 where phonons were computed from the direct method on a supercell. No soft mode is predicted by our calculations at the GGA level in the whole Brillouin zone, suggesting that the compound is thermodynamically stable at 0 K and 1 atm. The contribution of each kind of atom to each phonon branch is indicated in this figure using a color code. We observe that atomic motions of Zn-atoms dominate the modes ∼85 cm−1, while atomic motions of Sb-atoms contribute at ∼120 and ∼160 cm−1. For the other frequencies, Zn- and Sb-atoms equally contribute. The acoustic branches show a significant dispersion and exhibit a noticeable mixing with the first low-frequency optical branches especially between Y and Γ high symmetry points. This could suggest a complex behaviour of the thermal expansion and thermal conductivity. The maximum value of the phonon frequencies is given by the B2u(LO5) mode calculated at 195 cm−1.
image file: c5ra16956a-f5.tif
Fig. 5 Calculated phonon dispersion curves. The red and green colors highlight motions dominated by Zn and Sb-atoms, respectively. High symmetry q-points are defined as: Γ(0, 0, 0), image file: c5ra16956a-t17.tif, image file: c5ra16956a-t18.tif, image file: c5ra16956a-t19.tif, image file: c5ra16956a-t20.tif, image file: c5ra16956a-t21.tif, image file: c5ra16956a-t22.tif and image file: c5ra16956a-t23.tif. The discontinuities near the Γ point are due to the splitting between TO and LO modes. These discontinuities have not been corrected on the figure to easily estimate the strength of this splitting.

Fig. 6 reports the experimental generalized density-of-states, G(E), with the calculated atom-projected and the total phonon density-of-states, image file: c5ra16956a-t5.tif where qj is the phonon wavevector q in branch j and N is the number of atom in the primitive unit cell. One can see that the main features in Z(E) are observed in G(E) obtained from INS at room temperature. We observe a small gap between the optical branches around 130 cm−1. When comparing with the experiment, this gap is associated to the dip at ∼140 cm−1 due to a decreasing resolution of the spectrometer at high energy (this progressively broadens the experimental sharp features at high energy).


image file: c5ra16956a-f6.tif
Fig. 6 Calculated Z(E) and experimental G(E) density-of-states (upper pannel). Calculated atom-projected Z(E) (lower pannel). Inset: Debye presentation, G(E)/E2, of the experimental data. A constant gaussian broadening of 1.1 cm−1 has been used to plot the calculated spectra.

Acoustic branches (LA + TA) mainly contribute to the lowest experimental peak at 44 cm−1. The peak at 84 cm−1, located at the X-high symmetry point, mainly involves the Zn-atoms moving along the a-direction. Our measurements also support the presence of a peak around 48 cm−1 (6 meV) as seen by Belash et al.50 using INS on a sample containing a mixture of ZnSb and antimony, and by Claudio et al.51 on nanometric Zn1+xSb using antimony nuclear inelastic scattering. In addition, comparing our results on bulk ZnSb with those on Zn4Sb3,30,52,53 the low energy peak in G(E) is located around the same energy (∼5.5 meV) in both compounds.

E. Heat capacities

The constant-volume heat capacity (Cv) has been derived from the knowledge of the phonon density-of-states as:
 
image file: c5ra16956a-t6.tif(3)
where kB is the Boltzmann constant, is the reduced Planck constant, and ω(j, q, {ai}) is the frequency of the phonon with wavevector q in branch j, evaluated at constant-volume {ai}. The temperature dependence of the heat capacity at constant-pressure Cp has been also calculated as: Cp(T) = Cv(T) + αV2(T)B0Ω0T where αV is the volumic thermal expansion. The different calculated heat capacities are plotted as solid lines in Fig. 7. The experimental values of Cp are also reported up to the room temperature. The difference between Cp and Cv is small up to 450 K as the thermal expansion of ZnSb is small. Cv tends to the classical Dulong and Petit constant (49.89 J mol−1 K−1) as the temperature increases, while Cp still increases. We have an excellent agreement between our calculations and the two sets of experimental data up to 250 K. Above this temperature, the two experimental sets significantly deviate and our calculations are closer with the results of Mamedova et al.55 Although the agreement between the present calculations and our experiments is improved with respect to our prior work29 by including the αV term, the calculated curves are still lower than the experimental data if we suppose the experimental data of Danilenko et al.56 as reliable. Consequently, the present result does not change our previous conclusion about the possible contribution of anharmonicity and/or the defects above 250 K.

image file: c5ra16956a-f7.tif
Fig. 7 Calculated specific heat at constant-volume (Cv) and constant-pressure (Cp) with the experiment (lower pannel). Mamedova et al. and Danilenko et al. refer to ref. 55 and 56, respectively. Experimental isotropic atomic displacement parameters (upper pannel). Inset: Debye presentation, Cp/T3, for experimental and calculated data.

We get a calculated Debye temperature, θD = 217 K, from the linear fit of Cv with respect to T3 at very low temperatures (T < 4 K), in good agreement with that calculated from the elastic constants (θD = 233 K). At low temperatures, we have a peak calculated at 13 K which agrees well with our experimental heat capacity data where it is found at 15 K (see inset of Fig. 7). Such a deviation of Cp/T3 from a constant value expected for a basic Debye behaviour is related to the large peak seen in G(E)/E2 at about 47 cm−1 (see inset of Fig. 6). In both cases, this excess signal has the same origin mainly related to the presence of zone boundary acoustic modes and also of a low-energy optical mode ∼47 cm−1.

F. Atomic displacement parameters

The isotropic atomic displacement parameters Uiso derived from Rietveld refinement and calculated from ZX(E) for X = Zn and Sb in harmonic approximation are depicted in Fig. 7. Their behaviour is in line with features established in the vibrational properties and the specific heat data. As expected from the mass difference and comparable ZX(E) one finds larger ADP values for zinc than for antimony. The Uiso data derived from DFPT are overestimated compared to the experimental results. This behaviour is as well expected as lower phonon frequencies are observed in our calculations than in experiments.

Fits of the Einstein and Debye models to the experimental data result in very similar values for the characteristic temperatures ΘE and ΘD of Zn and Sb. This highlights as well that the dynamics of Zn and Sb are strongly coupled. For the Einstein model we derive a ΘE of 128 K for Zn and 130 K for Sb. These values are about twice larger than the energy of the first peak in the G(E) at about 70 K. For the Debye model we derive a ΘD of 222 K for Zn and 224 K for Sb. They agree well with Debye temperatures derived from experimentally determined elastic constants (253 K).4

Note that we were able to model the Uiso only with the high temperature linear extrapolation of the Einstein and Debye models from 50 K to 250 K. Indeed, experimental Uiso at ∼3 K was too small for being fitted with the Einstein and Debye models. Another striking feature of Uiso is the behaviour at 300 K. The Uiso tend to higher values than the linear T-dependence predicted by a harmonic model. This is in line with the departure of the experimentally determined Cp towards higher values than predicted within harmonic approximation (see Fig. 7). For this reason only data up to 250 K were considered for the Einstein and Debye fits. Mozharivskyj et al.54 obtained from powder X-ray diffraction at room temperature even higher values of Uiso(Zn) = 0.019 Å2 and Uiso(Sb) = 0.0162 Å2.

G. Thermal expansion

The thermal expansion of ZnSb has been calculated using the quasi-harmonic approximation. Within this formalism, the linear thermal expansion coefficient αi(T) of a crystal at a temperature T and along the lattice directions, ai with i = 1 (i.e. a), 2 (i.e. b) and 3 (i.e. c), is given by:57
 
image file: c5ra16956a-t7.tif(4)
where [s with combining tilde] is the compliance tensor written in Voigt notation and γ(j, q) is the Grüneisen parameter of the (j, q)-phonon mode:
 
image file: c5ra16956a-t8.tif(5)

Eqn (5) has been calculated from finite differences. For instance, to compute γ1, the phonon dispersion curves have been calculated at two perturbated structures that are derived from the equilibrium structure by straining the a-lattice parameter by ±1%, and reoptimizing the atomic positions. The left hand side of Fig. 8 shows the calculated dispersion of the γ(j, q) along the three crystal axes. The dispersions are discontinuous at the zone-center as a consequence of the anisotropy and polarization dependence of the sound velocities. Positive and negative γ(j, q) are observed along the three crystal directions and the whole Brillouin zone. Some mode Grüneisen parameters are weakly negative (∼−0.5) along the a-direction and are pronouncely negative along the two other directions (up to ∼−2.5). Modes with negative γ(j, q) are located up to 65 cm−1 along the a and b-directions, and up to 100 cm−1 along the c-direction (see Fig. 8, right). Above these threshold frequencies, all modes have positive Grüneisen parameters with maximal values larger than 3 near the X and Γ high-symmetry points along the a-direction while no clear maximum is observed for the two other directions. As a consequence, an anomalous negative thermal expansion could occur at low temperatures along the b and c-directions. In contrast, we expect this effect is strongly diminished at low temperatures along the a-direction or even suppressed, leading to positive αa(T).


image file: c5ra16956a-f8.tif
Fig. 8 Calculated mode Grüneisen parameters [γj(q)] along high-symmetry crystal directions (left hand side) and as a function of the frequency (right hand side).

We also derived the thermodynamic Grüneisen parameters:57

 
image file: c5ra16956a-t9.tif(6)
where [c with combining tilde] is the elastic constant matrix. For this purpose, we used our own measurements of αk(T) (see below), the heat capacity of our experiments and from literature (from ref. 55 and 56), and elastic constants cik from Balazyuk et al.4 One finds that the thermodynamic Grüneisen parameters Γk(T) increases with temperature and saturates above the Debye temperature (∼230–250 K) to the following values: Γa ∼ 1.4, Γb ∼ 1.1 and Γc ∼ 0.9. These values are in excellent agreement with the corresponding calculated ones (image file: c5ra16956a-t10.tif, image file: c5ra16956a-t11.tif and image file: c5ra16956a-t12.tif) as above room temperature all the vibrational modes are thermally excited and Γi converges to image file: c5ra16956a-t13.tif.

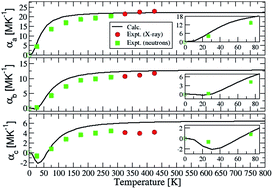
The thermal expansion measured up to 450 K is reported in Fig. 9 combining the elastic neutron scattering (2–300 K) and X-ray (300–450 K) experiments. We observe a strong anisotropy in agreement with prior works on AIIBV compounds23,32–34 and small negative values around 30 K along the b and c-directions. The negative thermal expansion is however more pronounced in the c-direction. Between 100 and 300 K, αa and αb values are close to those reported by Anatychuk and Mikhalchenko,34 while αc is twice larger. Among other AIIBV compounds, CdSb has similar αa and αc, but αb is significantly smaller.32,33 In contrast, the thermal expansion of ZnAs is bisected along a and negative along the two other directions.23 At room temperature, the volume thermal expansion of ZnSb (34 MK−1) is significantly smaller than in Zn4Sb3 where it is between 46.5 MK−1 (ref. 15) and 58 MK−1 (ref. 10 and 58).


image file: c5ra16956a-f9.tif
Fig. 9 Calculated and experimental thermal expansion. Insets: thermal expansion at low temperatures. The open squares label the zero thermal expansion at 0 K given as guide for the eyes to highlight the sign change in the experimental data.

The calculated temperature dependence of the linear thermal expansion of ZnSb is in quite good agreement with the experimental data although αc tends to higher values than the data derived from diffraction experiments above 300 K. Along the a-direction, the thermal expansion has a standard behaviour: a T3 dependence at low temperatures, followed by a monotonic increase in the intermediate temperature range, and a constant value at high temperatures. In contrast, for the two other directions, the thermal expansion does not follow this standard dependence. Indeed, the acoustic modes and some low-frequency optical modes are excited up to 30 K. These modes have in majority negative mode Grüneisen parameters, and the sign of the thermal expansion becomes negative (see Fig. 8). Above 30 K, the optical modes are beginning to be increasingly excited and the contribution of these modes with a positive Grüneisen parameter increases. This has the effect of reversing the sign of the thermal expansion that is now positive and increases monotonically to become constant at high temperatures as all optical modes are now excited.

The calculated negative thermal expansion around 30 K is mainly due to phonon modes with frequencies up to ∼75 cm−1. Along the b-direction, they are located in the SYΓ q-point range and the most negative contribution comes from the silent Au mode centered at 35 cm−1. Along the c-direction, they are located between Γ and Z high-symmetry point and most negative contribution comes from the polar B2u mode centered at 38 cm−1. The eigendisplacement vectors of these two modes displayed in Fig. 10 show that the Zn and Sb intra-ring atoms have a wagging-type vibration (i.e. each atom type moves in phase and out of the ring plane) and the inter-ring atoms have a complex torsional mode. This kind of motion leads to a network contraction and therefore to a negative thermal expansion as the ZnSb structure is built from Zn2Sb2 rhomboid rings which are arranged in layers and linked to 10 neighboring rings (see Fig. 1). We think that this explanation can be applied for the understanding of the negative thermal expansion of ZnAs between 100 and 300 K as Fischer et al.23 observed a decrease of the inter-ring Zn–As bondings in this temperature range.


image file: c5ra16956a-f10.tif
Fig. 10 Eigendisplacement vectors of selected zone-center modes at the origin of the thermal expansion. Arrows are proportional to the amplitude of the atomic motions. Color of Zn and Sb-atoms is pink and gray, respectively.

The calculated positive thermal expansion at room temperature along the a-direction is mainly due to phonon modes located in the ΓX and in the YΓZ q-point range with frequencies up to 175 cm−1. In particular, it is dominated by the Raman mode at 75 cm ± 1 (Ag) and the mode at 83 cm−1 located at the X-point. These modes are assigned to a scissoring-type vibration of the Zn–Zn intra-rings along the a-direction (see Fig. 10 in the case of the Ag mode). This assignment is consistent with our analysis of the thermal dependence of the ZnSb crystallographic parameters and notably with the large increase of the Zn–Zn distances inside the Zn2Sb2 rings (see Section IV.A). So, the large anharmonicity of the Zn-motions along the a-direction is one of the key ingredients for explaining the large anisotropy of the ZnSb thermal expansion and especially its large value.

V. Connection with the thermal conductivity and thermoelectric applications

In a previous work,29 we have studied the low thermal conductivity of ZnSb from the elementary Slack's model:59
 
image file: c5ra16956a-t14.tif(7)
where Γ is the thermodynamic Grüneisen parameter, Mat is the atomic mass, Vat is the atomic volume, n is the number of atoms in the primitive cell and A is a constant equal to 3.04 × 10⁻¹⁰ s−3 K−3 chosen to get the thermal conductivity in W m−1 K−1 unit. Considering the strong anisotropy of ZnSb, in our previous work,29 we have made a quite strong approximation by using Grüneisen parameters determined from the pressure derivative of the Bulk modulus obtained via the fit of the Vinet equation-of-states.

Within the more rigorous present approach, we get an experimental thermodynamic Grüneisen parameter Γ ∼ 1.1 at 300 K (see eqn (S-3) in ESI). This value is slightly smaller than the average Grüneisen parameter [small gamma, Greek, macron] ∼ 1.2 obtained from our DFPT calculations and much larger than that reported by Bjerg et al.30 from DFT calculations image file: c5ra16956a-t15.tif. This experimental thermodynamic Grüneisen parameter is however smaller than that obtained experimentally for Zn4Sb3 (1.35 < Γ < 1.57).10,53 This indicates that the overall anharmonicity is larger in Zn4Sb3 than in ZnSb.

Using our experimental Γ and the Debye temperature obtained from Balazyuk's work4 (θD = 253 K), the Slack model gives a thermal conductivity between 5.87 and 6.37 W m−1 K−1 at 300 K. This is more than 50% larger than the experimental values for bulk samples (2–4 W m−1 K−1).3,11,18,23,34 The agreement is however reasonable as the Slack's model usually overestimates the thermal conductivity compared to experiments.30,59 When using the DFPT calculated parameters, one finds κSlack = 3.95 W m−1 K−1 at 300 K which is close to the experimental values. Note also that Bjerg et al.30 found a larger thermal conductivity mainly due to a smaller Γ.

The thermal conductivity is weakly anisotropic as the κa[thin space (1/6-em)]:[thin space (1/6-em)]κb[thin space (1/6-em)]:[thin space (1/6-em)]κc ratio is 1[thin space (1/6-em)]:[thin space (1/6-em)]1.05[thin space (1/6-em)]:[thin space (1/6-em)]1.15.3 This contrasts with the very anisotropic thermal expansion and the rather anisotropic Grüneisen parameter. Moreover, the thermal conductivity is the smallest for the direction with the largest thermal expansion and Grüneisen parameter and vice versa. In order to understand the anisotropy of the thermal conductivity, Anatychuk and Mikhalchenko34 have used a modified version of the Slack's equation in which they respectively replaced the Debye temperature θD and the thermodynamic Grüneisen parameter Γ by the Debye temperatures θD,i and the Grüneisen parameters Γi that can be indeed defined for each i-direction in the case of anisotropic system from the sound velocity vsi (see ESI for details). However, if this is a too rough approximation to reach an understanding of the anisotropy of the thermal conductivity, we point out however that the anisotropy of the sound velocity and hence Debye temperatures θD,i, are the inverse to that of the Grüneisen parameters Γi. Indeed, the Debye temperatures for the b and c-directions are smaller by about 15% both experimentally and in DFT. This is because the transverse sound velocity vtbc between b and c-directions is much smaller than for the other directions. It seems therefore that the small anisotropy of the thermal conductivity of ZnSb could be due to a partial compensation of the anisotropy of the Debye temperatures θD,i and of the sound velocities by the opposite anisotropy of the Grüneisen parameters and hence of the anharmonicity and Umklapp relaxation time. The above discussion is just qualitative and a full explanation of the anisotropy of the thermal conductivity is beyond the scope of the present paper and would require to calculate the thermal conductivity.

For high temperature thermoelectric applications, the thermoelectric materials experience a large thermal gradient that can induce large stresses along the thermoelectric leg. The knowledge of both thermal expansion and elastic constants is useful for evaluating if the material will crack or not under large thermal gradient and under long duration. Therefore, materials with low thermal expansion are suitable. As we have seen, ZnSb has strongly anisotropic thermal expansion and it will be only weakly deformed by thermal gradient along c axis. Its average linear thermal expansion α is about 12 MK−1 at room temperature and only slightly increasing at higher temperatures. This value is comparable to that of other thermoelectric antimonide compounds such as skutterudite or clathrate compounds (α = 9–14 MK−1)60–63 but significantly larger than in silicon and germanium which have small α (∼2–6 MK−1).57,62 On the contrary, the thermal expansion is significantly lower than in Bi2Te3 used around room temperature with rather small thermal gradient and in PbTe used at larger temperature and with larger thermal gradient which have rather large thermal expansion (17 and 20 MK−1 respectively).62 As discussed by Case,62 it is necessary to have the smallest possible αE value (E being the Young modulus) and also a small Poisson coefficient in order to minimize the maximum thermal stress due to the thermal gradient and to maximize the thermal shock resistance parameter. In the case of ZnSb (with α from present work and E from Balazyuk's work4), one finds the isotropic αE = 962.7 GPa MK−1 which is typical of thermoelectric materials.62 Indeed, when comparing αE with those of other thermoelectric materials, one sees that this is 30% larger than in Bi2Te3 but 20% smaller than in PbTe and much smaller than in antimony-based skutterudites, but this is however much larger than for silicon or germanium.62

Another important point for thermoelectric applications is the interfacial stress between the thermoelectric material and their electrically contacting materials. As copper is often used as electrical contact, one could minimize the interfacial stresses if the thermal expansion of thermoelectric material was close to that of copper (17 MK−1 (ref. 57)). From this point of view, the average thermal expansion of polycrystalline ZnSb is close to that of copper but the thermal expansion of single-crystal oriented along c direction is three times smaller. Therefore, from thermal stresses point of view, probably polycrystalline samples are better suited than single-crystalline samples for high temperature applications.

To summarize, ZnSb seems to have thermo-mechanical properties at least as good as the usual thermoelectric materials.

VI. Conclusions

The origin of the thermal expansion of ZnSb has been studied using the combination of experiments (neutron and X-ray) and calculations based on the density functional theory. Related properties are also studied such as: the zone-center (Raman and infrared) phonon modes, the dielectric (electronic and static) tensors, the phonon density-of-states, the specific heats and the isotropic atomic displacement parameters.

First, our experimental data show highly anisotropic thermal expansion with large values along the a-direction. Concomitantly, a large increase of the intra-ring Zn–Zn and of one of the Zn–Sb distances is observed, while other interatomic distances do not significantly change. The thermal expansion of ZnSb is positive except around 30 K where it is weakly negative along the b-direction with a more pronounced effect along the c-direction.

Then, the calculated mode-by-mode decomposition of the thermal expansion shows that the negative expansion is mainly due to phonon modes with frequencies up to 75 cm−1. Along the b-direction, they are located in the SYΓ q-point range and the most negative contribution comes from the silent Au mode centered at 35 cm−1. Along the c-direction, they are located between Γ and Z high-symmetry point and the most negative contribution comes from the polar B2u mode centered at 38 cm−1. The eigendisplacement vectors of these two modes show that the Zn and Sb intra-ring atoms have a wagging-type vibration and the inter-ring atoms have a complex torsional mode, leading to a network contraction. The calculated positive thermal expansion at room temperature along the a-direction is mainly due to phonon modes located in the ΓX and in the YΓZ q-point range with frequencies up to 175 cm−1. In particular, the Raman mode at 75 (Ag) and the mode at 83 cm−1 located at the X-point dominate this standard thermal expansion. These modes are assigned to a scissoring of the Zn–Zn intra-rings along the a-crystal direction. This assignment is consistent with our analysis of the thermal dependence of the ZnSb crystallographic parameters and notably with the large increase of the Zn–Zn distances inside the Zn2Sb2 rings. This work provides benchmark theoretical and experimental results to understand the thermal expansion mechanisms of AIIBV compounds belonging to orthorhombic structures.

Finally, we have discussed the origin of the much reduced anisotropy of the thermal conductivity compared to the anisotropy of the thermal expansion and Grüneisen parameters. It is related to a compensation by the lower Debye temperatures along the b and c-directions and mainly to the small transverse sound velocity between these directions. ZnSb is promising for future thermoelectric applications as it has thermo-mechanical properties similar to the usual thermoelectric materials.

Note added in proof

We have recently learned that another work about thermodynamic properties and Raman spectroscopy of ZnSb was published.64

Acknowledgements

RV thanks Bernard Fraisse (ICG) for his help during the high-temperature X-ray experiments.

Notes and references

  1. E. K. Arushanov, Crystal-growth, Characterization and Application of II–V Compounds, Prog. Cryst. Growth Charact., 1986, 13, 1–38 CrossRef CAS.
  2. H. Komiya, K. Matsumoto and H. Y. Fan, Optical and Electrical Properties and Energy Band Structure of ZnSb, Phys. Rev., 1964, 133, A1679–A1684 CrossRef.
  3. P. J. Shaver and J. Blair, Thermal and Electronic Transport Properties of p-Type ZnSb, Phys. Rev., 1966, 141, 649–663 CrossRef CAS.
  4. V. N. Balazyuk, A. I. Eremenko and N. D. Raransky, Temperature and Composition Effects on Elastic Properties of CdZnSb Solid Solution Single Crystals, Funct. Mater., 2008, 15, 343–346 CAS.
  5. C. M. Park and H.-J. Sohn, Quasi-Intercalation and Facile Amorphization in Layered ZnSb for Li-Ion Batteries, Adv. Mater., 2010, 22, 47–52 CrossRef CAS PubMed.
  6. S. Saasat, Y. Y. Tay, J. Zhu, P. F. Teh, S. Maleksaeedi, M. M. Shahjamali, M. Shakerzadeh, M. Srinivasan, B. Y. Tay, H. H. Hng, J. Ma and Q. Yan, Template-Free Electrochemical Deposition of Interconnected ZnSb Nanoflakes for Li-Ion Battery Anodes, Chem. Mater., 2011, 23, 1032–1038 CrossRef.
  7. A. Nie, Y. Cheng, Y. Zhu, H. Asayesh-Ardakani, R. Tao, F. Mashayek, Y. Han, U. Schwingenschoegl, R. F. Klie, S. Vaddiraju and R. Shahbazian-Yassar, Lithiation-Induced Shuffling of Atomic Stacks, Nano Lett., 2014, 14, 5301–5307 CrossRef CAS PubMed.
  8. M. I. Fedorov, L. V. Prokof'eva, D. A. Pshenay-Severin, A. A. Shabaldin and P. P. Konstantinov, New Interest in Intermetallic Compound ZnSb, J. Electron. Mater., 2014, 43, 2314–2319 CrossRef CAS.
  9. D. M. Rowe and C. M. Bhandari, Modern Thermoelectrics, Reston Publishing Company, Inc., Reston, 1983 Search PubMed.
  10. T. Caillat, J.-P. Fleurial and A. Borshchevsky, Preparation and Thermoelectric Properties of Semiconducting Zn4Sb3, J. Phys. Chem. Solids, 1997, 58, 1119–1125 CrossRef CAS.
  11. G. J. Snyder, M. Christensen, R. Nishibori, T. Caillat and B. B. Iversen, Disordered zinc in Zn4Sb3 with phonon-glass and electron-crystal thermoelectric properties, Nat. Mater., 2004, 3, 458–463 CrossRef CAS PubMed.
  12. J. Nylen, S. Lidin, M. Andersson, B. B. Iversen, H. Liu, N. Newman and U. Häussermann, Low-Temperature Structural Transitions in the Phonon-Glass Thermoelectric Material β-Zn4Sb3: ordering of Zn Interstitials and Defects, Chem. Mater., 2007, 19, 835–838 CrossRef.
  13. V. Izard, M.-C. Record, J.-C. Tedenac and S. G. Fries, Discussion on the Stability of the Antimony–Zinc Binary Phases, CALPHAD: Comput. Coupling Phase Diagrams Thermochem., 2001, 25, 567–581 CrossRef CAS.
  14. H. Yin, S. Johnsen, K. Andersen Borup, K. Kato, M. Takata and B. B. Iversen, Highly Enhanced Thermal Stability of Zn4Sb3 Nanocomposites, Chem. Commun., 2013, 49, 6540–6542 RSC.
  15. J. Lin, X. Li, G. Qiao, Z. Wang, J. Carrete, Y. Ren, L. Ma, Y. Fei, B. Yang, L. Lei and J. Li, Unexpected High-Temperature Stability of β-Zn4Sb3 Open the Door to Enhanced Thermoelectric Performance, J. Am. Chem. Soc., 2014, 136, 1497–1504 CrossRef CAS PubMed.
  16. C. Okamura, T. Ueda and K. Hasezaki, Preparation of Single-Phase ZnSb Thermoelectric Materials Using a Mechanical Grinding Process, Mater. Trans., 2010, 51, 860–862 CrossRef CAS.
  17. D. M. Triches, S. M. Souza, J. C. de Lima, T. A. Grandi, C. E. M. Campos, A. Polian, J. P. Itie, F. Baudelet and J. C. Chervin, High-Pressure Phase Transformation of Nanometric ZnSb Prepared by Mechanical Alloying, J. Appl. Phys., 2009, 106, 013509 CrossRef.
  18. P. H. M. Bottger, K. Valset, S. Deledda and T. G. Finstad, Influence of Ball-Milling, Nanostructuring, and Ag inclusions on Thermoelectric Properties of ZnSb, J. Electron. Mater., 2010, 39, 1583–1588 CrossRef.
  19. P. H. M. Bottger, G. S. Pomrehn, G. J. Snyder and T. G. Finstad, Doping of p-Type ZnSb: Single Parabolic Band Model and Impurity Band Conduction, Phys. Status Solidi A, 2011, 208, 2753–2759 CrossRef.
  20. H. B. Lee, H. J. Yang, J. H. We, K. Kim, K. C. Choi and B. J. Cho, Thin-Film Thermoelectric Module for Power Generator Applications Using a Screen-Printing Method, J. Electron. Mater., 2010, 40, 615–619 CrossRef.
  21. D. Eklof, A. Fischer, Y. Wu, E.-W. Scheidt, W. Scherer and U. Haussermann, Transport Properties of the II–V Semiconductor ZnSb, J. Mater. Chem. A, 2013, 1, 1407–1414 RSC.
  22. D.-B. Xiong, N. L. Okamoto and H. Inui, Enhanced Thermoelectric Figure of Merit in p-Type Ag-Doped ZnSb Nanostructured with Ag3Sb, Scr. Mater., 2013, 69, 397–400 CrossRef CAS.
  23. A. Fischer, D. Eklof, D. E. Benson, Y. Wu, E.-W. Scheidt, W. Scherer and U. Haussermann, Synthesis, Structure, and Properties of the Electron-Poor II–V Semiconductor ZnAs, Inorg. Chem., 2014, 53, 8691–8699 CrossRef CAS PubMed . From the XRD data on ZnAs at 100 and 300 K, the thermal expansions owing x, y and z directions are: αx = 10.85 MK−1, αy = −1.374 MK−1, αz = −2.183 MK−1.
  24. S. Wang, J. Yang, L. Wu, P. Wei, J. Yang, W. Zhang and Y. Grin, Anisotropic Multicenter Bonding and High Thermoelectric Performance in Electron-Poor CdSb, Chem. Mater., 2015, 27, 1071–1081 CrossRef CAS.
  25. A. S. Mikhaylushkin, J. Nylen and U. Haussermann, Structure and Bondings of Zinc Antimonides: Complex Frameworks and Narrow Band Gaps, Chem.–Eur. J., 2005, 11, 4912–4920 CrossRef CAS PubMed.
  26. P. Boulet and M. C. Record, Structural Investigation of the Zn1−xCdxSb Solid Solution by Density-Functional Theory Approach, Solid State Sci., 2010, 12, 26–32 CrossRef CAS.
  27. L. Bjerg, G. K. H. Madsen and B. B. Iversen, Enhanced Thermoelectric Properties in Zinc Antimonides, Chem. Mater., 2011, 23, 3907–3914 CrossRef CAS.
  28. D. Benson, O. Sankey and U. Haussermann, Electronic Structure and Chemical Bonding of the Electron-Poor II–V Semiconductors ZnSb and ZnAs, Phys. Rev. B: Condens. Matter Mater. Phys., 2011, 84, 125211 CrossRef.
  29. P. Jund, R. Viennois, X. Tao, K. Niedziolka and J.-C. Tedenac, Physical Properties of Thermoelectric Zinc Antimonide Using First-Principles Calculations, Phys. Rev. B: Condens. Matter Mater. Phys., 2012, 85, 224105 CrossRef.
  30. L. Bjerg, B. B. Iversen and G. K. H. Madsen, Modeling the Thermal Conductivities of the Zinc Antimonides ZnSb and Zn4Sb3, Phys. Rev. B: Condens. Matter Mater. Phys., 2014, 89, 024304 CrossRef.
  31. B. Velicky and V. Frei, The Chemical Bonding in CdSb, Czech. J. Phys., 1963, 13, 43–47 CrossRef.
  32. K. Toman, Anisotropy of Chemical Bond in CdSb Compound, Czech. J. Phys., 1963, 13, 431–436 CrossRef CAS.
  33. E. I. Geshko, V. P. Mikhalchenko and B. M. Sharlai, Anisotropy of Thermal Expansion of CdSb, Phys. Solid State, 1972, 13, 2106 Search PubMed.
  34. L. I. Anatychuk and V. P. Mikhalchenko, Correlation Between the Anisotropy of Thermoelasticity and Some Thermoelectric Properties of ZnSb Single Crystals, J. Thermoelectr., 2002, 13, 31–39 Search PubMed , and refs. therein.
  35. J. Rodriguez-Carvajal, Recent advances in magnetic structure determination by neutron powder diffraction, Phys. B, 1993, 192, 55–69 CrossRef CAS.
  36. W. Reichardt, MuPhoCor. A fortran program to determine the phonon density of states from neutron scattering experiments. (Kernforschungszentrum Karlsruhe Gmbh, 1984) Number 13.03.01p06.
  37. M. M. Bredov, B. A. Kotov, N. M. Okuneva, V. S. Oskotskii and A. L. Shakh-Budagov, Possibility of measuring thermal vibration spectrum G(W) using inelastic neutron scattering from a polycrystalline sample, Phys. Solid State, 1967, 9, 214 Search PubMed.
  38. V. S. Oskotskii, Measurement of phonon distribution functio in polycrystalline materials using coherent scattering of slow neutrons into a solid angle, Phys. Solid State, 1967, 9, 420 Search PubMed.
  39. X. Gonze, B. Amadon, P. M. Anglade, J. M. Beuken, F. Bottin, P. Boulanger, F. Bruneval, D. Caliste and R. Caracas, et al. ABINIT: First-principles Approach to Material and Nanosystem Properties, Comput. Phys. Commun., 2009, 180, 2582–2615 CrossRef CAS.
  40. J. P. Perdew, K. Burke and M. Ernzerhof, Generalized Gradient Approximation Made Simple, Phys. Rev. Lett., 1996, 77, 3865–3868 CrossRef CAS PubMed.
  41. N. Troullier and J. L. Martins, Efficient Pseudopotentials for Plane-Wave Calculations, Phys. Rev. B: Condens. Matter Mater. Phys., 1991, 43, 1993–2006 CrossRef CAS.
  42. H. J. Monkhorst and J. D. Pack, Special Points for Brillouin-Zone Integrations, Phys. Rev. B: Solid State, 1976, 13, 5188–5192 CrossRef.
  43. X. Gonze and C. Lee, Dynamical Matrices, Born Effective Charges, Dielectric Permittivity Tensors, and Interatomic Force Constants from Density-Functional Perturbation Theory, Phys. Rev. B: Condens. Matter Mater. Phys., 1997, 55, 10355–10368 CrossRef CAS.
  44. X. Gonze, J.-C. Charlier, D. C. Allan and M. P. Teter, Interatomic Force Constants From First Principles: The Case of α-quartz, Phys. Rev. B: Condens. Matter Mater. Phys., 1994, 50, 13035–13038 CrossRef CAS.
  45. F. L. Carter and R. Mazelsky, The ZnSb Structure; a Further Enquiry, J. Phys. Chem. Solids, 1964, 25, 571 CrossRef CAS.
  46. X. Gonze, P. Ghosez and R. W. Godby, Density-Polarization Functional Theory of the Response of a Periodic Insulating Solid to an Electric Field, Phys. Rev. Lett., 1995, 74, 4035–4038 CrossRef CAS PubMed.
  47. Z. H. Levine and D. C. Allan, Linear Optical Response in Silicon and Germanium Including Self-Energy Effects, Phys. Rev. Lett., 1989, 63, 1719–1722 CrossRef CAS PubMed.
  48. P. Hermet, L. Gourrier, J.-L. Bantignies, D. Ravot, T. Michel, S. Deabate, P. Boulet and F. Henn, Dielectric, Magnetic, and Phonon Properties of Nickel Hydroxide, Phys. Rev. B: Condens. Matter Mater. Phys., 2011, 84, 235211 CrossRef.
  49. D. V. Smirnov, D. V. Mashovets, S. Pasquier, J. Leotin, P. Puech, G. Landa and Y. V. Roznovan, Long-Wavelength Optical Phonons of CdxZn1−xSb Mixed Crystals, Semicond. Sci. Technol., 1994, 9, 333–337 CrossRef CAS.
  50. I. T. Belash, O. I. Barlakov, A. I. Kolesnikov, E. G. Ponyatovskii and M. Prager, Inelastic Neutron Scattering in Amorphous and Crystalline Phases of Zn–Sb and Cd–Sb Systems Produced by Thermobaric Treatments, Solid State Commun., 1991, 78, 331–334 CrossRef CAS.
  51. T. Claudio, D. Bessas, C. S. Birkel, G. Kieslich, M. Panthofer, I. Sergueev, W. Tremel and R. P. Hermann, Enhanced Debye Level in Nano-Zn1+xSb, FeSb2, and NiSb: Nuclear Inelastic Spectroscopy on 121Sb, Phys. Status Solidi B, 2014, 251, 919–923 CrossRef CAS.
  52. W. Schweika, R. P. Hermann, M. Prager, J. Persson and V. Keppens, Dumbell Rattling in Thermoelectric Zinc Antimony, Phys. Rev. Lett., 2007, 99, 125501 CrossRef CAS PubMed.
  53. A. Moechel, I. Sergueev, H.-C. Wille, F. Juranyi, H. Schober, W. Schweika, S. R. Brown, S. M. Kauzlarich and R. P. Hermann, Lattice Dynamics in the Thermoelectric Zintl Compound Yb14MnSb11, Phys. Rev. B: Condens. Matter Mater. Phys., 2011, 84, 184303 CrossRef.
  54. Y. Mozharivskyj, A. O. Pecharsky, S. Budko and G. J. Miller, A Promising Thermoelectric Material: Zn4Sb3 or Zn6−δSb5. Its Composition, Structure, Stability, and Polymorphs. Structure and Stability of Zn1−δSb, Chem. Mater., 2004, 16, 1580 CrossRef CAS.
  55. K. M. Mamedova, A. Yu Dzhangirov, O. I. Dzhafarov and V. N. Kostryukov, True Heat Capacity of Solid Solutions of Zinc and Cadmium Monoantimonides from 12 to 300 K, Russ. J. Phys. Chem., 1975, 49, 1635–1637 Search PubMed.
  56. G. N. Danilenko, V. Y. Shevchenko, S. F. Marenkin and M. K. Karapetyants, Thermodynamic Properties of CdSb and ZnSb, Inorg. Mater., 1978, 14, 486–489 Search PubMed.
  57. T. H. K. Barron, J. G. Collins and G. K. White, Thermal Expansion of Solids at Low Temperatures, Adv. Phys., 1980, 29, 609–730 CrossRef CAS.
  58. Our preliminary neutron diffraction experiments on Zn4Sb3 indicate a volume thermal expansion of ∼58.3 MK−1 between 245 and 300 K. This result agrees with prior experiments from Caillat, et al.10 performed with dilatometer. These results will be published in a subsequent article.
  59. G. A. Slack, The Thermal Conductivity of Nonmetallic Crystals, Solid State Phys., 1979, 34, 1–71 CAS.
  60. R. Viennois, L. Girard, D. Ravot, S. Paschen, S. Charar, A. Mauger, P. Haen and J. C. Tedenac, Thermoelectric properties of Ce(La)Fe4Sb12 skutterudites under a magnetic field, Phys. Rev. B: Condens. Matter Mater. Phys., 2009, 80, 155109 CrossRef.
  61. G. Rogl, L. Zhang, P. Rogl, A. Grytsiv, M. Falmbigl, D. Rajs, M. Kriegisch, H. Muller, E. Bauer, J. Koppensteiner, W. Schranz, M. Zehetbauer, Z. Henkie and M. B. Maple, Thermoelectric Expansion of Skutterudites, J. Appl. Phys., 2010, 107, 043507 CrossRef.
  62. E. D. Case, Thermal Fatigue and Waste Heat Recovery via Thermoelectrics, J. Electron. Mater., 2012, 41, 1811–1819 CrossRef CAS.
  63. R. Lortz, R. Viennois, A. Petrovic, Y. Wang, P. Toulemonde, C. Meingast, M. M. Koza, H. Mutka, A. Bossak and A. San Miguel, Phonon density of states, anharmonicity, electron–phonon coupling, and possible multigap superconductivity in the clathrate superconductors Ba8Si46 and Ba24Si100: Factors behind large difference in Tc, Phys. Rev. B: Condens. Matter Mater. Phys., 2008, 77, 224507 CrossRef.
  64. A. Fischer, E.-W. Scheidt, W. Scherer, D. E. Benson, Y. Wu, D. Eklöf and U. Häussermann, Thermal and vibrational properties of thermoelectric ZnSb: Exploring the origin of low thermal conductivity, Phys. Rev. B: Condens. Matter Mater. Phys., 2015, 91, 224309 CrossRef.

Footnote

Electronic supplementary information (ESI) available. See DOI: 10.1039/c5ra16956a

This journal is © The Royal Society of Chemistry 2015
Click here to see how this site uses Cookies. View our privacy policy here.