Lipase-catalyzed synthesis of dilauryl azelate ester: process optimization by artificial neural networks and reusability study
Nurshafira Khairudin*,
Mahiran Basri*,
Hamid Reza Fard Masoumi,
Wan Sarah Samiun and
Shazwani Samson
Department of Chemistry, Faculty of Science, Universiti Putra Malaysia, 43400 Serdang, Selangor, Malaysia. E-mail: mahiran@upm.edu.my; nurshafirakhairudin@yahoo.com
First published on 29th October 2015
Abstract
An application of artificial neural networks (ANNs) to predict the performance of a lipase-catalyzed synthesis for esterification of dilauryl azelate ester was carried out. The central composite rotatable design (CCRD) experimental data were utilized for training and testing of the proposed ANN model. The model was applied to predict various performance parameters of the enzymatic reaction conditions, namely enzyme amount (0.05–0.45 g), reaction time (90–450 min), reaction temperature (40–64 °C) and molar ratio of substrates (AzA![[thin space (1/6-em)]](https://www.rsc.org/images/entities/char_2009.gif) :
:![[thin space (1/6-em)]](https://www.rsc.org/images/entities/char_2009.gif) LA, 1
LA, 1![[thin space (1/6-em)]](https://www.rsc.org/images/entities/char_2009.gif) :
:![[thin space (1/6-em)]](https://www.rsc.org/images/entities/char_2009.gif) 3–1
3–1![[thin space (1/6-em)]](https://www.rsc.org/images/entities/char_2009.gif) :
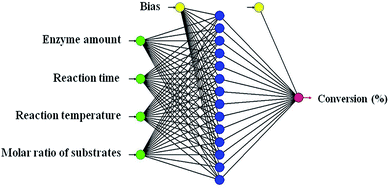
:![[thin space (1/6-em)]](https://www.rsc.org/images/entities/char_2009.gif) 9 mol). The incremental back propagation (IBP), batch back propagation (BBP), quick propagation (QP), genetic algorithm (GA), and the Levenberg–Marguardt (LM) algorithms were used in the network. It was found that the optimal algorithm and topology were the incremental back propagation (IBP) and the configuration with 4 inputs, 14 hidden, and 1 output nodes, respectively.
9 mol). The incremental back propagation (IBP), batch back propagation (BBP), quick propagation (QP), genetic algorithm (GA), and the Levenberg–Marguardt (LM) algorithms were used in the network. It was found that the optimal algorithm and topology were the incremental back propagation (IBP) and the configuration with 4 inputs, 14 hidden, and 1 output nodes, respectively.
Introduction
Azelaic acid is a naturally occurring saturated dicarboxylic acid which, on pharmacological application, has been shown to be effective in the treatment of comedonal acnes, and inflammatory (papulopustular, nodulocystic and nodular) acne, as well as various cutaneous hyperpigmentary disorders.1 But its usage is limited in cosmetics and pharmaceutical products because of insolubility, high melting point and large dosage requirement. In addition, due to its crystalline form which melts at high temperature (103 °C), incorporation of azelaic acid into product formulation is difficult at standard conditions. However, efficacy was only observed when amount ≥15% of azelaic acid was incorporated.2,3 Different derivatives of azelaic acid have also been proven to be an effective topical treatment for human inflammatory skin disorders.4Tamarkin and Maccabim (2004) reported that modification of azelaic acid by attachment of different steroidal hormones through covalent ester linkages and converting at least, one of the carboxylic acid groups into ester group has enhanced not only the technical property of azelaic acid, but also the functional performance of the resulting modified azelaic acid. Their studies showed that the modified azelaic acid exhibited anti-acne, sebum regulatory and skin lightening properties on the treated skin at low dosage.5 The antibacterial properties of some azelaic acid diesters were investigated by Charnock and collaborators.6 Hsieh et al. also introduced a co-drug of conjugated hydroquinone and azelaic acid to enhance topical skin targeting and decrease penetration through the skin. Their studies demonstrated that esterification of azelaic acid by hydroquinone contains two hydroxyl functionalities was allowed to formation an ester co-drug.7
In this work, the synthesis of dilauryl azelate ester was studied using immobilized lipase (Novozym 435) as biocatalyst has not been reported. Therefore, the optimization of process parameters was carried out based on the investigations relating to the influence of enzyme amount, reaction time, reaction temperature, and substrates molar ratio by using artificial neural network. In fact, this works aims to locate the optimum reaction conditions for lipase catalyzed synthesis of dilauryl azelate ester through CCRD as an experimental design and ANN as a statistical tool for optimization.
An artificial neural network (ANN) inspired by biological neural networks process input information using an interconnected group of artificial neurons and a connectionist approach to computation.8 This work is concerned with ANNs that have proven to be a powerful tool successfully used for several real world applications over the past few years.9–14 Artificial neural networks have been used for representing non-linear functional relationships between variables. The ability of an ANN to learn and generalize the behavior of any complex and non-linear process makes it a powerful modeling tool.15 Solving and modeling the complex relation between input and output variable can be simply performed by an ANN model imitated by biological neuron processing. ANNs have been used to study a wide variety of chemical problems.16
Methodology
Materials
Novozym 435 (lipase B from Candida Antarctica) was obtained from Novo Nordisk A/S (Denmark). Azelaic acid and lauryl alcohol were purchased from Merck (Germany). n-Hexane obtained from J.T.Baker (USA) was used as the organic solvent. All other chemicals used in this study were of analytical reagent grade.Enzymatic esterification of azelaic acid and analysis of samples
To optimize the reaction conditions, enzymatic reactions were usually performed in screw-capped glass vials on a shaker. In a typical reaction, a certain amount of azelaic acid and proportional amount of lauryl alcohol were added into 5 ml solvent (n-hexane) contained in screw-capped glass vial. The enzyme amount was added to the mixture was sealed and shaken at 150 rpm in a horizontal water bath shaker.The enzymatic reaction was terminated by adding 5 ml of ethanol–acetone (50![[thin space (1/6-em)]](https://www.rsc.org/images/entities/char_2009.gif) :
:![[thin space (1/6-em)]](https://www.rsc.org/images/entities/char_2009.gif) 50, v/v). The catalyst was then separated by filtration, and the residual free acid into the final mixture sample was measured by standard NaOH (0.1 N) titration. The value of reacted acid was calculated from the amounts obtained for the test (with enzyme) and control (without enzyme) samples. The amount of ester formation was expressed as equivalent to the acid conversion.17,18 The conversion percentage was calculated from consumption of NaOH for test and control. The conversion was calculated using (eqn (1)).19 The ester formation was confirmed by thin-layer chromatography (TLC) using chloroform
50, v/v). The catalyst was then separated by filtration, and the residual free acid into the final mixture sample was measured by standard NaOH (0.1 N) titration. The value of reacted acid was calculated from the amounts obtained for the test (with enzyme) and control (without enzyme) samples. The amount of ester formation was expressed as equivalent to the acid conversion.17,18 The conversion percentage was calculated from consumption of NaOH for test and control. The conversion was calculated using (eqn (1)).19 The ester formation was confirmed by thin-layer chromatography (TLC) using chloroform![[thin space (1/6-em)]](https://www.rsc.org/images/entities/char_2009.gif) :
:![[thin space (1/6-em)]](https://www.rsc.org/images/entities/char_2009.gif) dichloromethane (95
dichloromethane (95![[thin space (1/6-em)]](https://www.rsc.org/images/entities/char_2009.gif) :
:![[thin space (1/6-em)]](https://www.rsc.org/images/entities/char_2009.gif) 5 v/v) solvent system. Further identification for ester formation was carried out by gas chromatography/mass spectroscopy GC-MS on a Shimadzu (model GC 17A; model MS QP5050A, Japan) and FTIR (Perkin Elmer, model 1650, UK) instruments.
5 v/v) solvent system. Further identification for ester formation was carried out by gas chromatography/mass spectroscopy GC-MS on a Shimadzu (model GC 17A; model MS QP5050A, Japan) and FTIR (Perkin Elmer, model 1650, UK) instruments.
For purification of the product, after termination of the reaction, the enzyme was filtered and the solvent removed by evaporator under reduced pressure. Product in the remaining mixture were separated via silica gel (Kieselgel 60, Merck, particle size 0.063–0.200 mm) column chromatography (15 cm × 20 mm) using a chloroform/dichloromethane (95/5, v/v) mixture as eluent. A sample made up of 1![[thin space (1/6-em)]](https://www.rsc.org/images/entities/char_2009.gif) :
:![[thin space (1/6-em)]](https://www.rsc.org/images/entities/char_2009.gif) 1 (w/w) ratio of silica gel and the free solvent reaction mixture was deposited at the top of the column previously equilibrated with chloroform/dichloromethane (95/5, v/v) mixture. Five millilitre fractions were collected and tested using thin layer chromatography to identify the product-rich portions. Such fractions were pooled and the solvent evaporated by a rotary evaporator. The purity of product was then checked with TLC and GC before FTIR analysis.
1 (w/w) ratio of silica gel and the free solvent reaction mixture was deposited at the top of the column previously equilibrated with chloroform/dichloromethane (95/5, v/v) mixture. Five millilitre fractions were collected and tested using thin layer chromatography to identify the product-rich portions. Such fractions were pooled and the solvent evaporated by a rotary evaporator. The purity of product was then checked with TLC and GC before FTIR analysis.
 | (1) |
The ANN description
Artificial neural networks that contain input, hidden and output layers are mathematic free functionalization of the complicated practical process. The layers which consist of several nodes, are connected by multilayer normal feed-forward or feed-back connection formula.20 The hidden layer could be more than one parallel layer however the single hidden layer is universally suggested. The connection is that the nodes of particular layer are connected to the nodes of the next layer. The nodes are simple artificial neurons which simulate the behavior of biological neural networks. The nodes of input layer are qualify by sending data via the special weights to the nodes of hidden layer and then to the output layer.20–23 The qualification is carried out by associated weights during learning process by well known learning algorithms.The learning process
In the learning process, the weights are calculated by the weighted summation (eqn (2)) of received data from the former layer and transfer to next layer.24 The number of hidden nodes is obtained by trial and error training calculation which is examined from one to n nodes. In the process, the output of the hidden nodes in turn, acts as input to final (output) layer's nodes which undergoes similar or different transformation.
 | (2) |
The universal learning algorithms are IBP, BBP, QP, GA and LM while the multilayer is the nodes' connection type.25 The usual transfer function is the logarithmic sigmoid for both hidden and output layers that is bounded from (0–1).26 The sigmoid bounded area is used to normalize the input and output data that is provided by the software scalling. The scaled data are passed into the first layer, propagated to hidden layer and finally meet the output layer of the network. Each node in hidden layer or in output layer firstly acts as a summing junction which modifies the inputs from the previous layer using the following equation:
 | (3) |
 | (4) |
 | (5) |
 | (6) |
Incremental back propagation algorithm
Gradient descent backpropagation algorithm: this algorithm is one of the most popular training algorithms in the domain of neural networks. It works by measuring the output error, calculating the gradient of this error, and adjusting the ANN weights (and biases) in the descending gradient direction. Hence, this method is a gradient descent local search procedure.29 This algorithm includes different versions such as: (a) standard or incremental backpropagation (IBP): the network weights are updated after presenting each pattern from the learning data set, rather than once per iteration30 (b) batch backpropagation (BBP): the network weights update takes place once per iteration, while all learning data pattern are processed through the network31 (c) quick propagation (QP): QP is a heuristic modification of the backpropagation algorithm. It is proved much faster than IBP for many problems. QP is also defined as: mixed learning heuristics without momentum, learning rate optimized during training.32The back propagation algorithm of learning a multilayer perceptron neural network (MLP – MultiLayers Perceptron) was described for the first time in 1969 by Arthur E. Bryson.33 With the version created in 1986 by David E. Rumelhart, Geoffrey E. Hinton and Ronald J. Williams, the back propagation algorithm has gained popularity and interest to neural network field. Batch backpropagation is an optimization technique where the updating of the weights is based on the cyclic use of the entire learning set. Unlike the batch back propagation, the incremental backpropagation is based on weights updating after the utilization of each pattern of the learning set.
Enzyme reusability study
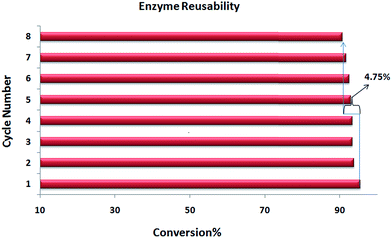
The reusability study of Novozym 435 was carried out in term of percentage conversion for the synthesis of dilauryl azelate ester. The esterification experiments were conducted for 8 cycles of 6 h that more than 45 h working reaction time under the optimal conditions, as follows: enzyme amount (0.14 g), reaction time (360 min), reaction temperature (46 °C), and molar ratio (1![[thin space (1/6-em)]](https://www.rsc.org/images/entities/char_2009.gif) :
:![[thin space (1/6-em)]](https://www.rsc.org/images/entities/char_2009.gif) 4.1). At the end of each reaction, the enzyme was separated from the product by filtration and rinsed with n-hexane for removing the organic phase that surrounded enzyme particles.
4.1). At the end of each reaction, the enzyme was separated from the product by filtration and rinsed with n-hexane for removing the organic phase that surrounded enzyme particles.
Results and discussion
Modeling process
| Run No. | Enzyme amount (w/w %) | Reaction time (hour) | Reaction temperature (°C) | Molar ratio of substrates, AzA![[thin space (1/6-em)]](https://www.rsc.org/images/entities/char_2009.gif) : :![[thin space (1/6-em)]](https://www.rsc.org/images/entities/char_2009.gif) LA (mol) LA (mol) |
Conversion (%) | |
|---|---|---|---|---|---|---|
| Actual value | Predicted value | |||||
| Training set | ||||||
| 1 | 0.25 | 450 | 52 | 6 | 96.74 | 96.73 |
| 2 | 0.25 | 90 | 52 | 6 | 80.80 | 80.81 |
| 3 | 0.25 | 270 | 40 | 6 | 85.71 | 85.72 |
| 4 | 0.25 | 270 | 64 | 6 | 92.52 | 92.52 |
| 5 | 0.05 | 270 | 52 | 6 | 93.20 | 93.20 |
| 6 | 0.45 | 270 | 52 | 6 | 93.17 | 93.17 |
| 7 | 0.25 | 270 | 52 | 3 | 85.24 | 85.24 |
| 8 | 0.25 | 270 | 52 | 9 | 79.70 | 79.70 |
| 9 | 0.25 | 270 | 52 | 6 | 86.61 | 86.61 |
| 10 | 0.15 | 180 | 58 | 4.5 | 87.83 | 87.83 |
| 11 | 0.15 | 360 | 58 | 4.5 | 93.51 | 93.51 |
| 12 | 0.35 | 360 | 46 | 4.5 | 95.40 | 95.40 |
| 13 | 0.35 | 360 | 46 | 7.5 | 90.83 | 90.84 |
| 14 | 0.35 | 180 | 46 | 4.5 | 80.62 | 80.62 |
| 15 | 0.35 | 360 | 58 | 4.5 | 95.22 | 95.22 |
| 16 | 0.35 | 180 | 58 | 4.5 | 89.78 | 89.78 |
| 17 | 0.15 | 180 | 46 | 4.5 | 84.14 | 84.14 |
| 18 | 0.35 | 180 | 46 | 7.5 | 78.76 | 78.75 |
| 19 | 0.35 | 360 | 58 | 7.5 | 90.70 | 90.70 |
| 20 | 0.15 | 180 | 58 | 7.5 | 84.98 | 84.98 |
![[thin space (1/6-em)]](https://www.rsc.org/images/entities/char_2009.gif) |
||||||
| Test set | ||||||
| 1 | 0.20 | 180 | 50 | 6 | 84.23 | 82.53 |
| 2 | 0.15 | 360 | 58 | 7.5 | 86.73 | 87.27 |
| 3 | 0.30 | 300 | 52 | 5 | 91.19 | 90.22 |
| 4 | 0.15 | 360 | 46 | 4.5 | 95.38 | 95.05 |
| 5 | 0.15 | 360 | 46 | 7.5 | 90.13 | 90.22 |
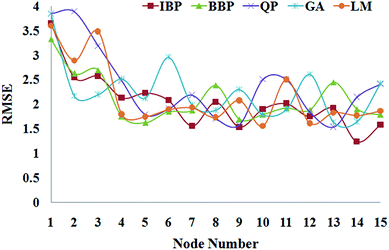
The training was identically carried out for IBP, BBP, QP, GA and LM algorithms to discover the optimized topology for each algorithm. Among the 10 time learning repetition data for each node, the minimum value of RMSE was selected and plotted versus the nodes of the algorithms' hidden layer (Fig. 1). As shown, one node of 15 topologies for each algorithm has presented the lowest RMSE which was selected as the best topology for comparison. The selected topologies were 4-14-1, 4-5-1, 4-13-1, 4-13-1, and 4-10-1 for IBP, BBP, QP, GA and LM algorithms, respectively. As Fig. 1 shown, the topology of IBP-4-14-1 presented the lowest RMSE among the other topologies was selected as provisional model for producing dilauryl azelate ester.
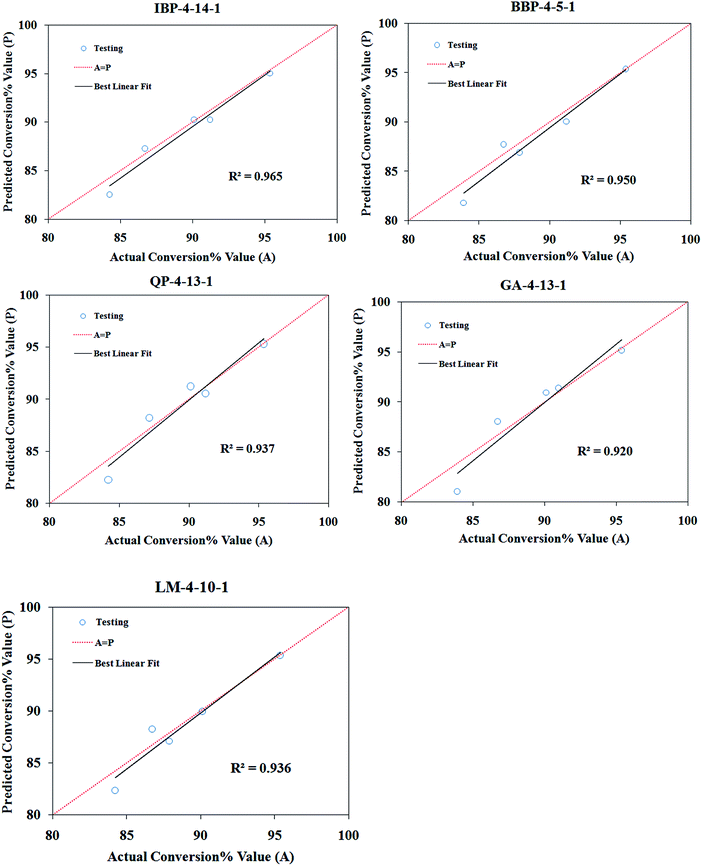 | ||
| Fig. 2 Scatter plot of predicted conversion (%) value versus actual conversion (%) value by using five algorithms for testing set. | ||
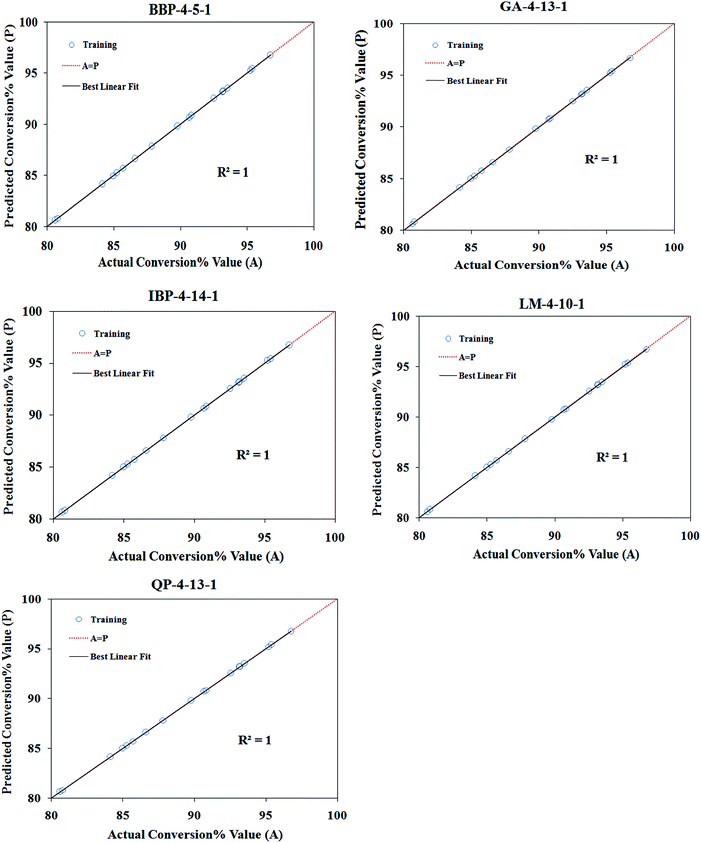 | ||
| Fig. 3 Scatter plot of predicted conversion (%) value versus actual conversion (%) value by using five algorithms for training data set. | ||
| Learning algorithm | Architecture | Training data | Testing data | ||||
|---|---|---|---|---|---|---|---|
| RMSE | R2 | AAD | RMSE | R2 | AAD | ||
| GA | 4-15-1 | 0.01715 | 1.000 | 0.01294 | 1.10181 | 0.920 | 1.29923 |
| BBP | 4-5-1 | 0.00297 | 1.000 | 0.00247 | 0.92118 | 0.950 | 1.20485 |
| QP | 4-13-1 | 0.00123 | 1.000 | 0.00033 | 0.85146 | 0.937 | 1.10360 |
| LM | 4-10-1 | 0.00055 | 1.000 | 0.00093 | 0.85462 | 0.936 | 1.10333 |
| IBP | 4-14-1 | 0.00220 | 1.000 | 0.00163 | 0.68859 | 0.965 | 0.83528 |
As observed, the lowest value of the AAD has also belonged to IBP-4-14-1. As a result, IBP-4-14-1 was pioneer in minimum RMSE and AAD as well as at maximum R2 among the topologies for testing and training data sets.
 | (7) |
| Run No. | Enzyme amount (w/w %) | Reaction time (hour) | Reaction temperature (°C) | Molar ratio of substrates, AzA![[thin space (1/6-em)]](https://www.rsc.org/images/entities/char_2009.gif) : :![[thin space (1/6-em)]](https://www.rsc.org/images/entities/char_2009.gif) LA (mol) LA (mol) |
Conversion (%) | |
|---|---|---|---|---|---|---|
| Actual value | Predicted value | |||||
| 1 | 0.15 | 180 | 46 | 7.5 | 83.91 | 81.67 |
| 2 | 0.35 | 180 | 58 | 7.5 | 87.9 | 86.61 |
| 3 | 0.20 | 360 | 52 | 6.5 | 90.99 | 91.55 |
| 4 | 0.16 | 250 | 55 | 5.5 | 87.17 | 88.13 |
| Independent variables | Conversion (%) | |||||||
|---|---|---|---|---|---|---|---|---|
| Enzyme amount (g) | Reaction time (min) | Reaction temperature (°C) | Molar ratio of substrates, AzA![[thin space (1/6-em)]](https://www.rsc.org/images/entities/char_2009.gif) : :![[thin space (1/6-em)]](https://www.rsc.org/images/entities/char_2009.gif) LA (mol) LA (mol) |
Actual value | Predicted value by ANN | Predicted value by RSM | RSE (%) by ANN | RSE (%) by RSM |
| 0.14 | 360 | 46 | 1![[thin space (1/6-em)]](https://www.rsc.org/images/entities/char_2009.gif) : :![[thin space (1/6-em)]](https://www.rsc.org/images/entities/char_2009.gif) 4.1 4.1 |
95.38 | 95.05 | 96.23 | 0.35 | 0.88 |
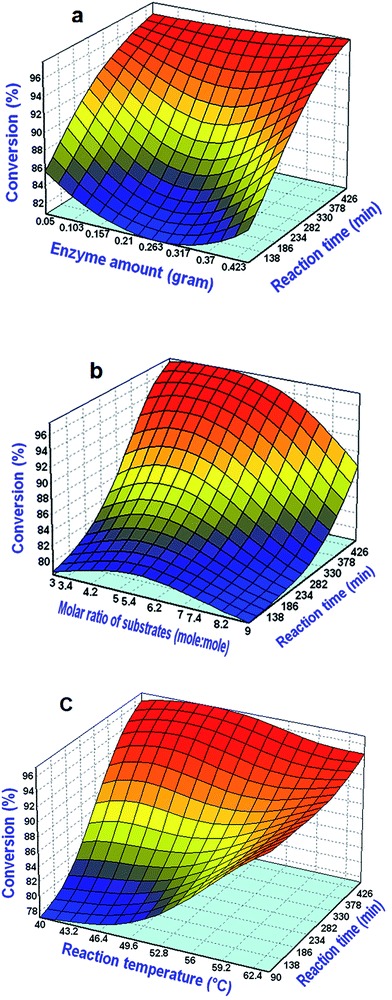
Fig. 5a shows the effect of enzyme amount and reaction time on the percentage conversion of dilauryl azelate ester. Response surface plot was generated with a reaction temperature fixed at 46 °C and molar ratio of substrate 1![[thin space (1/6-em)]](https://www.rsc.org/images/entities/char_2009.gif) :
:![[thin space (1/6-em)]](https://www.rsc.org/images/entities/char_2009.gif) 4.1 mol (AzA
4.1 mol (AzA![[thin space (1/6-em)]](https://www.rsc.org/images/entities/char_2009.gif) :
:![[thin space (1/6-em)]](https://www.rsc.org/images/entities/char_2009.gif) LA) for obtaining the interaction of varying enzyme amount (0.05–0.45 g) and the reaction time (90–450 min). The result showed that when increasing the reaction time from 90 to 450 min, the conversion% of dilauryl azelate ester rapidly was increased from 82 to 96%. However, enzyme amount was not significant affect on the percentage of conversion at any given amounts from 0.05 to 0.45 g. High percentage conversion (95.38%) was achieved by increasing the reaction time and reducing the amount of enzyme, which is important from the economic viewpoint since the cost of enzyme is expensive.
LA) for obtaining the interaction of varying enzyme amount (0.05–0.45 g) and the reaction time (90–450 min). The result showed that when increasing the reaction time from 90 to 450 min, the conversion% of dilauryl azelate ester rapidly was increased from 82 to 96%. However, enzyme amount was not significant affect on the percentage of conversion at any given amounts from 0.05 to 0.45 g. High percentage conversion (95.38%) was achieved by increasing the reaction time and reducing the amount of enzyme, which is important from the economic viewpoint since the cost of enzyme is expensive.
Fig. 5b represents the effect of varying molar ratio of substrates (AzA![[thin space (1/6-em)]](https://www.rsc.org/images/entities/char_2009.gif) :
:![[thin space (1/6-em)]](https://www.rsc.org/images/entities/char_2009.gif) LA, 1
LA, 1![[thin space (1/6-em)]](https://www.rsc.org/images/entities/char_2009.gif) :
:![[thin space (1/6-em)]](https://www.rsc.org/images/entities/char_2009.gif) 3–1
3–1![[thin space (1/6-em)]](https://www.rsc.org/images/entities/char_2009.gif) :
:![[thin space (1/6-em)]](https://www.rsc.org/images/entities/char_2009.gif) 9 mol) and reaction time (90–450 min), and their mutual interaction on dilauryl azelate synthesis at enzyme amount of 0.14 g and reaction temperature of 46 °C. It was shown that the maximum conversion of dilauryl azelate ester (95.38%) was obtained when the amount of substrates molar ratio was reached to the ratio of 1
9 mol) and reaction time (90–450 min), and their mutual interaction on dilauryl azelate synthesis at enzyme amount of 0.14 g and reaction temperature of 46 °C. It was shown that the maximum conversion of dilauryl azelate ester (95.38%) was obtained when the amount of substrates molar ratio was reached to the ratio of 1![[thin space (1/6-em)]](https://www.rsc.org/images/entities/char_2009.gif) :
:![[thin space (1/6-em)]](https://www.rsc.org/images/entities/char_2009.gif) 4.1 mol (AzA
4.1 mol (AzA![[thin space (1/6-em)]](https://www.rsc.org/images/entities/char_2009.gif) :
:![[thin space (1/6-em)]](https://www.rsc.org/images/entities/char_2009.gif) LA) and by increasing the reaction time higher than 360 min. Additionally, it was observed that at the ratios higher than 1
LA) and by increasing the reaction time higher than 360 min. Additionally, it was observed that at the ratios higher than 1![[thin space (1/6-em)]](https://www.rsc.org/images/entities/char_2009.gif) :
:![[thin space (1/6-em)]](https://www.rsc.org/images/entities/char_2009.gif) 5 mol (AzA
5 mol (AzA![[thin space (1/6-em)]](https://www.rsc.org/images/entities/char_2009.gif) :
:![[thin space (1/6-em)]](https://www.rsc.org/images/entities/char_2009.gif) LA), the conversion percentage of dilauryl azelate ester decreased. This may due to out of the critical molar ratio, competing alcohol binding reduce formation of the acyl–enzyme complex and thereby results in decrease of alcoholysis.39
LA), the conversion percentage of dilauryl azelate ester decreased. This may due to out of the critical molar ratio, competing alcohol binding reduce formation of the acyl–enzyme complex and thereby results in decrease of alcoholysis.39
As shown in Fig. 5c, the effect of reaction temperature and reaction time were interpreted in range of 40–64 °C and 90–450 min, respectively with the enzyme amount fixed at 0.14 g and molar ratio substrates at 1![[thin space (1/6-em)]](https://www.rsc.org/images/entities/char_2009.gif) :
:![[thin space (1/6-em)]](https://www.rsc.org/images/entities/char_2009.gif) 4.1 mol (AzA
4.1 mol (AzA![[thin space (1/6-em)]](https://www.rsc.org/images/entities/char_2009.gif) :
:![[thin space (1/6-em)]](https://www.rsc.org/images/entities/char_2009.gif) LA). Fig. 5c shows that the higher percentage conversion of dilauryl azelate ester (95.38%) was obtained at optimal reaction temperature range between 46–50 °C and reaction time higher than 360 min. These results were similar in those most reviewed papers, which is Novozym 435 was optimally used at temperature of 40 °C and 60 °C. Higher reaction temperatures tended to induce enzyme inactivation due to denaturation processes.39
LA). Fig. 5c shows that the higher percentage conversion of dilauryl azelate ester (95.38%) was obtained at optimal reaction temperature range between 46–50 °C and reaction time higher than 360 min. These results were similar in those most reviewed papers, which is Novozym 435 was optimally used at temperature of 40 °C and 60 °C. Higher reaction temperatures tended to induce enzyme inactivation due to denaturation processes.39
Conclusions
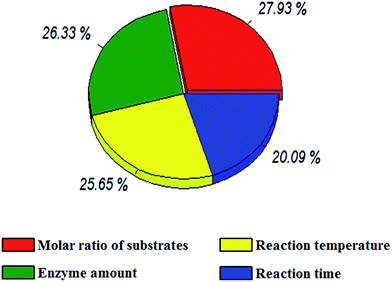
The ANN-based design of experiment was used for the synthesis of dilauryl azelate ester. The optimization of process parameters was carried out based on the investigations relating to the influence of enzyme amount, reaction time, reaction temperature, and molar ratio of substrates by using artificial neural networks. To obtain the qualified network, different algorithms such as IBP, BBP, QP, GA and LM were learned by using training, and testing data sets. The results of the learning program were obtained by five best topologies; IBP-4-14-1, BBP-4-5-1, QP-4-13-1, GA-4-13-1 and LM-4-10-1. The performance of the topologies was optimized by RMSE, AAD and R2. The topology (IBP-4-14-1) with the lowest RMSE, AAD and the highest R2 was selected as provisional network of the synthesis of dilauryl azelate ester for validation test. The results of the validation confirmed high predictability of the model. The validated model determined the optimum values and relative importance of the effective variables. The importance of the variables which include molar ratio of substrates, 27.93%, enzyme amount, 26.33%, reaction temperature, 25.65% and reaction time, 20.09% showed none of the variables were neglectable in this work. In conclusion, ANN is an efficient quantitative tool which is able to model the effective input variables to predict the conversion% of dilauryl azelate ester enzymatic reaction.42Acknowledgements
The financial assistance provided by Universiti Putra Malaysia under the Research University Grant Scheme (RUGS), is gratefully acknowledged.References
- A. Fitton and K. L. Goa, Drugs, 1991, 41, 780–798 CrossRef CAS PubMed.
- G. Webster, J. Am. Acad. Dermatol., 2000, 43, S47–S50 CrossRef CAS PubMed.
- J.-F. Hermanns, L. Petit, C. Piérard-Franchimont, P. Paquet and G. Piérard, Dermatology, 2002, 204, 281–286 CrossRef CAS PubMed.
- M. Nazzaro-Porro, Dermatology in Five Continents, Springer, Verlag Berlin Heidelberg, 1988 Search PubMed.
- D. Tamarkin, US Pat., 20,040,191,196, 2004.
- C. Charnock, B. Brudeli and J. Klaveness, Eur. J. Pharm. Sci., 2004, 21, 589–596 CrossRef CAS PubMed.
- P.-W. Hsieh, S. A. Al-Suwayeh, C.-L. Fang, C.-F. Lin, C.-C. Chen and J.-Y. Fang, Eur. J. Pharm. Biopharm., 2012, 81, 369–378 CrossRef CAS PubMed.
- S. Haykin, Neural Networks: A Comprehensive Foundation, Mac millian, New York, 1994 Search PubMed.
- M. Lam, Decis. Support Syst., 2004, 37, 567–581 CrossRef.
- R. Ghazali, A. Jaafar Hussain, N. Mohd Nawi and B. Mohamad, Neurocomputing, 2009, 72, 2359–2367 CrossRef.
- P. J. Lisboa and A. F. Taktak, Neural Network, 2006, 19, 408–415 CrossRef PubMed.
- M. Egmont-Petersen, D. de Ridder and H. Handels, Pattern Recogn., 2002, 35, 2279–2301 CrossRef.
- J. J. Lahnajärvi, M. I. Lehtokangas and J. P. Saarinen, Neurocomputing, 2004, 56, 345–363 CrossRef.
- M. W. Craven and J. W. Shavlik, Future Generat. Comput. Syst., 1997, 13, 211–229 CrossRef.
- D. Bingöl, M. Hercan, S. Elevli and E. Kılıç, Bioresour. Technol., 2012, 112, 111–115 CrossRef PubMed.
- F. Despagne and D. L. Massart, Analyst, 1998, 123, 157R–178R RSC.
- N. Chaibakhsh, M. Abdul Rahman, S. Abd-Aziz, M. Basri, A. Salleh and R. Rahman, J. Ind. Microbiol. Biotechnol., 2009, 36, 1149–1155 CrossRef CAS PubMed.
- H. R. Fard Masoumi, M. Basri, A. Kassim, D. Kuang Abdullah, Y. Abdollahi, S. S. Abd Gani and M. Rezaee, Sci. World J., 2013, 2013, 1–9 CrossRef PubMed.
- S. C. Lau, H. N. Lim, M. Basri, H. R. F. Masoumi, A. A. Tajudin, N. M. Huang, A. Pandikumar, C. H. Chia and Y. Andou, PLoS One, 2014, 9, 1–10 Search PubMed.
- A. Ghaffari, H. Abdollahi, M. Khoshayand, I. S. Bozchalooi, A. Dadgar and M. Rafiee-Tehrani, Int. J. Pharm., 2006, 327, 126–138 CrossRef CAS PubMed.
- M. G. Moghaddam, F. B. H. Ahmad, M. Basri and M. B. A. Rahman, Electron. J. Biotechnol., 2010, 13, 3–4 Search PubMed.
- S. Aber, A. Amani-Ghadim and V. Mirzajani, J. Hazard. Mater., 2009, 171, 484–490 CrossRef CAS PubMed.
- G. D. Garson, AI Expet, 1991, 6, 46–51 Search PubMed.
- M. Khare and S. S. Nagendra, Artificial neural networks in vehicular pollution modelling, Springer, 2007 Search PubMed.
- D. Salari, N. Daneshvar, F. Aghazadeh and A. Khataee, J. Hazard. Mater., 2005, 125, 205–210 CrossRef CAS PubMed.
- Y. Abdollahi, A. Zakaria, A. H. Abdullah, H. R. F. Masoumi, H. Jahangirian, K. Shameli, M. Rezayi, S. Banerjee and T. Abdollahi, Chem. Cent. J., 2012, 6, 88 CrossRef CAS PubMed.
- H. R. F. Masoumi, M. Basri, A. Kassim, D. K. Abdullah, Y. Abdollahi and S. S. A. Gani, J. Surfactants Deterg., 2014, 17, 287–294 CrossRef.
- Y. Abdollahi, N. A. Sairi, M. K. Aroua, H. R. F. Masoumi, H. Jahangirian and Y. Alias, J. Ind. Eng. Chem., 2014, 25, 168–175 CrossRef.
- D. Rumelhart, G. Hinton and R. Williams, Nature, 1986, 323, 533–536 CrossRef.
- A. P. Plumb, R. C. Rowe, P. York and M. Brown, Eur. J. Pharm. Sci., 2005, 25, 395–405 CrossRef CAS PubMed.
- M. T. Hagan, H. B. Demuth and M. H. Beale, Neural network design, Pws Boston, 1996 Search PubMed.
- A. Ghaffari, H. Abdollahi, M. R. Khoshayand, I. Soltani Bozchalooi, A. Dadgara and M. Rafiee-Tehrani, Int. J. Pharm., 2006, 327, 126–138 CrossRef CAS PubMed.
- A. E. Bryson, Y.-C. Ho and G. M. Siouris, IEEE Transactions on Systems, Man, and Cybernetics, 1979, 9, 366–367 CrossRef.
- M. Kasiri, H. Aleboyeh and A. Aleboyeh, Environ. Sci. Technol., 2008, 42, 7970–7975 CrossRef CAS PubMed.
- W.-H. Ho, K.-T. Lee, H.-Y. Chen, T.-W. Ho and H.-C. Chiu, PLoS One, 2012, 7, 1–9 CrossRef.
- H.-Y. Shi, K.-T. Lee, H.-H. Lee, W.-H. Ho, D.-P. Sun, J.-J. Wang and C.-C. Chiu, PLoS One, 2012, 7, 1–6 Search PubMed.
- J. Zhang, A. Morris, E. Martin and C. Kiparissides, Chem. Eng. J., 1998, 69, 135–143 CrossRef CAS.
- L. Aijun, L. Hejun, L. Kezhi and G. Zhengbing, Acta Mater., 2004, 52, 299–305 CrossRef.
- M. B. A. Rahman, N. Chaibakhsh, M. Basri, R. N. Z. R. A. Rahman, A. B. Salleh and S. M. Radzi, J. Chem. Technol. Biotechnol., 2008, 83, 1534–1540 CrossRef CAS.
- S. Karmee, Energy Sources, Part A, 2015, 37, 536–542 CrossRef CAS.
- H. R. F. Masoumi, M. Basri, A. Kassim, D. K. Abdullah, Y. Abdollahi, S. S. A. Gani and M. Rezaee, J. Ind. Eng. Chem., 2014, 20, 1973–1976 CrossRef.
- Y. Abdollahi, A. Zakaria and N. A. Sairi, Clean: Soil, Air, Water, 2014, 42, 1292–1297 CrossRef CAS.
| This journal is © The Royal Society of Chemistry 2015 |

