A one-pot synthesis of nanostructured mesoporous TiO2 films on graphite felt substrates for fast catalysis
S. El-Kacemiab,
Mar. Es-Souniac,
S. Haboutia,
D. Schopfa,
M. Hamdanib and
M. Es-Souni*a
aInstitute for Materials & Surface Technology, University of Applied Sciences, Kiel, Germany. E-mail: mohammed.es-souni@fh-kiel.de
bElectrochemical Lab, Ibn-Zohr University, Agadir, Morocco
cFaculty of Dentistry, Christian-Albrecht-University, Kiel, Germany
First published on 25th September 2015
Abstract
In the present paper we report a one-pot synthesis of nanocrystalline, crack-free and mesoporous thin TiO2 films on graphite felt (GrF) and GrF terminated with NiO nanoleaflets. The films are obtained using an immersion method in an ethanolic solution of titanium isopropoxide containing small amounts of NH3 catalyser. A short heat treatment at 450 °C yields pure phase anatase directly on GrF or on the NiO nanoleaflets. The method allows processing of a variety of TiO2/metal oxide heterostructures and can be implemented for other catalysts. The supported films were tested for their photocatalytic activity using a continuous-flow set-up of an aqueous amido black solution under a cold UV diode at 360 nm. The results are compared to those of a thick macro-mesoporous P25-TiO2 film on Si. Full discoloration of the dye is obtained within 50 to 120 minutes for the films on the GrF substrates. The discoloration kinetics show a non-linear behaviour that is interpreted in terms of the rapid rarefication of the dye molecules. In contrast, the P25-TiO2 film on Si shows the usual linear behaviour with a small rate constant. The highest discoloration rate is obtained with TiO2 directly deposited on GrF. Based on the latest literature findings, it is postulated that the high defect density of the graphite structure could promote better charge separation and higher photocatalytic activity in comparison to the GrF/NiO/TiO2 heterostructure.
Introduction
The photocatalytic properties of TiO2 are very well-known, have garnered immense research activities and continue to attract huge interest. The application potentials reach from indoor air purification to waterlysis.1–3 Water purification is particularly of acute actuality because of dwindling water reserves in many regions of the world and the ensuing necessity to recycle waste waters.At the origin of the photocatalytic activity of TiO2 in all its polymorphs is the creation of electron–hole pairs upon irradiation with high energy photons, in general with energy in excess of 3.2 eV, i.e. in the UV range. A draw-back of pure TiO2 is however the high recombination rate of charge carriers that limits yield of photocatalytic reactions. Strategies have been implemented to limit carrier recombination via TiO2–noble metal and/or TiO2-semi-conductor oxide or quantum dot heterojunctions.4–7 However, one prerequisite for efficient (photo)catalysis is the availability of surface sites. One possibility to fulfil this requirement is the use of nanopowders. But they require filtration that constitutes a serious disadvantage as to cost and poor recycling yield. Porous films may provide a more advantageous alternative, although the required macro-mesoporosity (to achieve high density of active sites) may be difficult to achieve which may result in poor photocatalytic reaction yield.8,9 The use of high-surface area substrates such as porous activated carbon10 or graphite fibers11 is another promising alternative, and indeed few reports outline the high photocatalytic activity and good recyclability of TiO2 on these substrates.12 Deposition of TiO2-films on carbon materials has been achieved via different methods, among them ionized cluster beam (starting from high purity Ti-metal),11 molecular adsorption deposition (MAD, starting from TiCl4),12 and other methods based on hydrolysis of titanium isopropoxide (TIIP) or impregnation using TiO2 powder.10 The coatings obtained were of various thickness, morphology and coverage, with the MAD technique enabling better coverage, although the films were interspersed with micro-crack (see Fig. 2 in ref. 12).
In the present work we propose a one-pot soft chemistry method for the homogeneous coating of graphite felt (GrF) substrates with thin TiO2 films starting from a highly diluted ethanolic solution of TIIP that is subsequently subjected to controlled hydrolysis at room temperature. Variants of this method that are also reported here include the deposition of NiO/TiO2 heterostructures on GrF. The method also allows deposition of noble metal–TiO2 nanocomposites. The photocatalytic activity of the different heterostructures is tested on amido black dye solution in a continuous flow set-up under a cold UV diode of 360 nm wave length. The choice of this dye has been made based on its widespread use for dying textile fibres, in biochemistry and because of its toxicity and pollution of waters. The results are compared to those obtained on a thick TiO2 film that was made using a hybrid sol–gel-P25 powder-method.9 All the films deposited on GrF show superior photocatalytic activity with almost full degradation within 60 minutes.
Experimental
Chemicals
The following chemicals were used as purchased: titanium(IV)-isopropoxide (TTIP, 97%, Aldrich, Germany), ethanol (99%, Walter, Germany), ammonia (25%, Roth, Germany), nickel(II) chloride (NiCl2·6H2O, Aldrich, Germany), hexa-methylenetetramine (Aldrich, Germany), polyethylenimine (Aldrich, Germany), absolute ethanol (Merck, Germany), hydrochloric acid (37%, Roth, Germany).Preparation of GrF substrates and films
GrF substrates (Alfa Aesar), 2 mm thick were cut in pieces of 2 × 2 cm2; they were first treated in a mixture of sulfuric acid and hydrogen peroxide to remove residual organic products, and subsequently thoroughly rinsed in deionized water and dried. A short treatment at 650 °C for 30 minutes has proven to confer macroporosity and hence high surface area to the GrF fibers. Furthermore, the substrates were highly hydrophilic after this treatment which is a prerequisite for successful coating. Henceforth all GrF substrates were subjected to this treatment before coating.TiO2 thin films were either prepared on bare GrF or GrF/Ni(OH)2-nanolamellae with high surface area. For Ni(OH)2 on GrF substrates a growth solution was first prepared as follows: NiCl2·6H2O (0.18 g, 40 mM, pH = 3.60) and HMTA (0.14 g, 50 mM, pH = 6.72) were dissolved by stirring (5 min) in 20 ml of water followed by sequential and drop-wise addition of PEI (75 μl, pH = 6.80) and 25% NH4OH (6 ml, pH = 12.25), and further stirring for 10 min. In a typical experiment the inclined GrF substrate was placed in a flask, covered with a para film let to react 2 hours at 85–88 °C using an oil bath. Subsequently the nanolamellae anchored on the substrate were thoroughly rinsed with de-ionized water, blown dry in air and kept 18 h in a dry box at 100 °C.
Thin TiO2 films were prepared on each of the GrF substrates depicted above by immersion in a precursor solution that was prepared as follows: solution A containing 5 ml ethanol (99%) and 25 μl ammonium hydroxide solution (25%) was added dropwise to solution B containing 5 ml ethanol (99%) and 295 μl titanium(IV) isopropoxide and stirred for 20 s. The GrF substrates were then immersed in the precursor solution kept at room temperature until the solution starts to be lightly turbid, generally in 20 to 30 min. The substrates were then removed from the solution, cleaned in ethanol, dried and finally heat treated in a pre-heated furnace at 450 °C for 60 min. The coating sequence is repeated 3 times to ensure full coverage. For comparison macro-mesoporous thick TiO2 films were prepared on silicon substrates using a hybrid powder P25-sol–gel procedure described in our previous paper.8
Characterization
The samples were investigated by X-ray diffraction (XRD) (X'Pert Pro, PANalytical, Holland) in grazing incident geometry with fixed angle of 1.5°, and 0.05° step using monochromatic Cu Kα radiation (λ = 1.5418 Å) and a scanning range (2θ) of 10–90°. A Bruker Raman microscope (532 nm laser diode) was used to acquire spectra over a wave number range of 70–3700 cm−1, with a spectral resolution of 3–5 cm−1, using a backscattering configuration with a 20× objective. Data were collected on numerous spots on the sample and recorded with a fully focused laser power of 20 mW or 5 mW in the case of bare Gr. Each spectrum was accumulated ten times with an integration time of 15 s. The Raman signal was recorded using a CCD camera. Silicon substrate Raman peak position (520 cm−1) was used to calibrate spectral frequency. The nano-structured surface was characterized using a high-resolution scanning electron microscope (Ultra Plus, ZEISS, Germany).Photocatalytic activity
The photocatalytic activity of the different samples was monitored using 1 mM aqueous solutions of amido black (AB, pH = 5). The photocatalytic set-up is depicted in Fig. 1. It is a continuous flow set-up comprising a quartz cuvette, a peristaltic pump, a funnel-like container, a cold UV LED (Opsytec Dr Gröbel, Ettlingen, Germany) with a wave length of 360 ± 5 nm and power density of 2 W cm−2 at a distance of 3 cm from the specimen surface, and finally a spectrophotometer (Spectrum 400, Perkin-Elmer). The solution is pumped onto the specimen surface with the UV LED switched-on and circulated to the quartz cuvette inside the spectrophotometer where measurement is conducted at the maximum absorption wavelength of the dye as function of time. As reference a quartz cuvette containing deionized water was used. This set-up ensures a continuous monitoring of dye discoloration without altering the volume of the solution while dye molecules are continuously refreshed on the photocatalyst surface.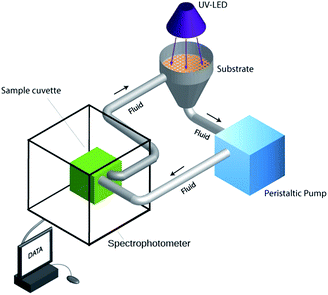 | ||
| Fig. 1 A schematic drawing of the continuous-flow experimental set-up for monitoring the photocatalytic activity. | ||
Results and discussion
Morphology and structure of the substrates
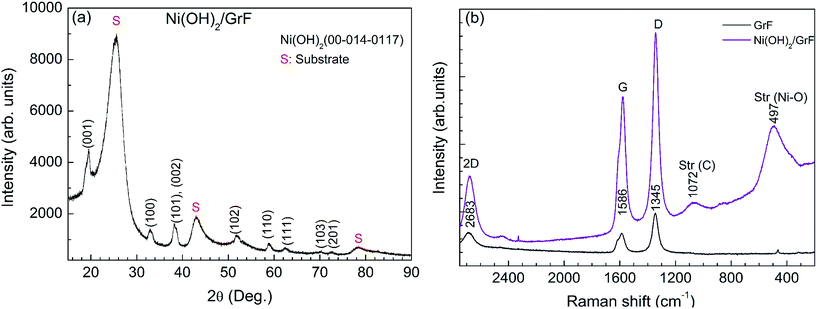
The XRD patterns of the bare graphite felt substrate, pre-treated as outlined in the Experimental part above, are displayed in Fig. 2a. They show characteristic peaks of crystalline graphite.13 The Ni(OH)2 terminated substrate displays characteristic peaks of β-Ni(OH)2 in addition to those of graphite. The diffraction peaks at 19.3°, 33.2°, 38.6°, 59.1°, 62.7°, 70.5°, 72.8°, and 82.6° are attributed to the reflections (001), (100), (101), (110), (111), (103), (201) and (202), respectively, of the β-Ni(OH)2 phase with the hexagonal brucite14 structure, according to the PDF 00-014-0117.The Raman scattering spectra of the GrF substrate in the as-received state, Fig. 2b, show characteristic lines at 1342 cm−1, 1573 cm−1 and 2667.5 cm−1 that are attributed to the defect-characteristic D band, the sp2-network band E2g (G) and overtone D* of the D band, respectively.14 When GrF is treated as outlined above the intensity of the D band increases, and the intensity ratio ID/ID* increases with maximum for the heat treated state denoting increasing defects and nanocrystallite formation.15 The ID/IG intensity ratio has been shown to correlate with crystallite size through the empirical formula15
 | (1) |
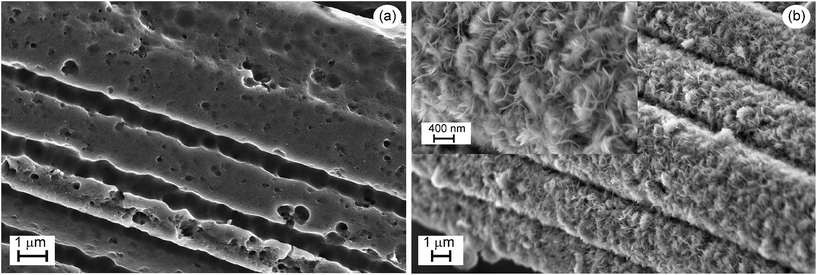
The different morphologies of the substrates are illustrated in Fig. 3. The short treatment of GrF at 650 °C yields a highly rough surface, Fig. 3a, that is the consequence of selective “burning” of graphite. But this has also the benefit of increasing the surface area of the substrate. The Ni(OH)2 phase forms thin lamellae over the whole graphite fibre surface as depicted in the inset of Fig. 3b, affording a high surface area support for the TiO2 layer.
Morphology and structure of the TiO2 films
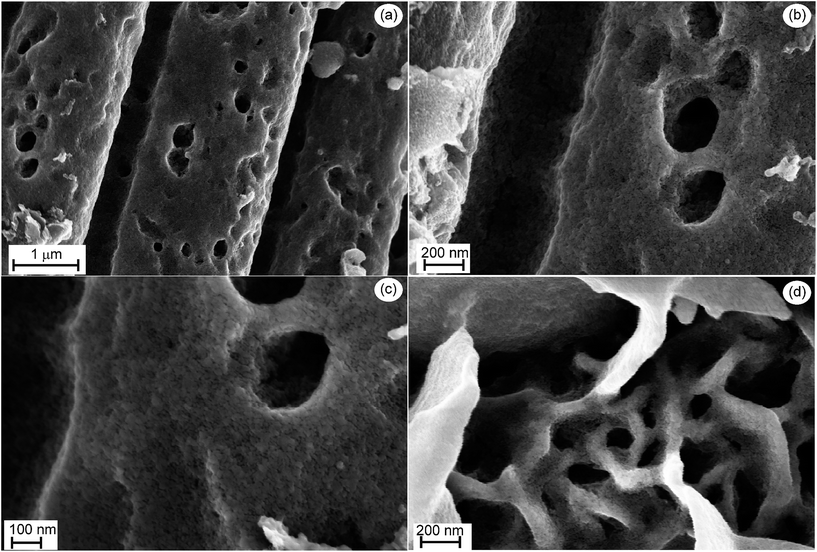
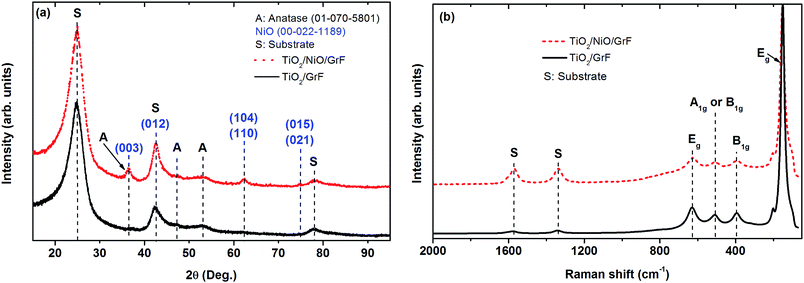
Fig. 4a exemplary shows the morphology of TiO2 directly deposited onto GrF after annealing at 450 °C. The films are nanostructured with a mean grain size in the range of 20 to 30 nm, mesoporous and appear to well adhere to the substrate, filling even the interior of the GrF-pores (see Fig. 4c). The films deposited on Ni(OH)2 and subsequently annealed espouse the undelaying leaflet-morphology, as illustrated in Fig. 4d, thus affording more surface area than the previously discussed films.X-ray diffraction analysis using long acquisition time was necessary in order to detect the weak and broad peaks of TiO2 shown in Fig. 5a, but the peaks can unambiguously be attributed to anatase despite overlapping of the 100% 101 peak with the 001 peak of GrF. An even more difficult analysis of the XRD patterns arises when TiO2 is deposited on Ni(OH)2 (that transforms to NiO upon annealing) because some peak overlapping between NiO and anatase also occurs, Fig. 5b. Unfortunately the broad peaks obtained for anatase do not allow further exploitation, e.g. calculation of the crystallite size using the Scherrer-formula. Raman scattering delivers, in addition to the GrF peaks depicted above, intense peaks that are unambiguously attributed to the anatase phase (the NiO underlayer is not Raman active).
From these results we may state that TiO2 can be readily deposited as well directly on GrF as on GrF covered with other oxide materials thus allowing heterostructures to be tested. The formation of homogeneous TiO2 coating on the GrF fibres is catalysed by NH3 in the ethanolic solution. It is stipulated that NH3 promotes condensation of negatively charged (RO)3TiO− species via a reaction sequence similar that described in ref. 16 and 17. If we suppose that the GrF surface contains hydroxyl-groups after heat treatment that would explain their hydrophilic character (see also below), then we would expect the negatively charged TiO− species to graft on the surface with the elimination of an alcohol. Similar mechanisms are expected for deposition of TiO2 on Ni(OH)2. We may also state that substantial diffusion does not take place for NiO–TiO2 compounds to be formed upon heat treatment,18 but a limited diffusion at the interface is not to be ruled out, resulting in cross-doping of the oxides.
Photocatalytic properties
The degradation of azo dyes on photocatalyst's surface, particularly on TiO2, has been widely discussed in literature (e.g. see the review article by Konstantinou and Albanis, ref. 3). Highly oxidizing hydroxyl radicals and reducing oxygen radicals react with the cationic dye to full mineralisation (CO2, SO42−, NH4+, NO3−) via the formation of intermediate products. Discoloration is the consequence of the cleavage of the azo bond (N![[double bond, length as m-dash]](https://www.rsc.org/images/entities/char_e001.gif) N).
N).
The photocatalytic properties of the different heterostructures are displayed in Fig. 6. Overall the kinetic of degradation is rather rapid with full degradation of the dye molecules within 50 to 120 minutes, depending on film heterostructure. These high degradation rates surpass by far the degradation rates obtained on macro-mesoporous TiO2-P25-thick coatings on silicon reported in our previous work9 and repeated under the present conditions in Fig. 6c. Although comparison with other work is difficult because of different loadings and experimental photocatalytic conditions the present nanocomposites also override the performances reported for TiO2 films on activated graphite fibres reported by Fu et al. and Yamashita et al.11,12
But specificities of the different coatings are clearly seen, i.e. the degradation (discoloration) of the dye proceeds with different kinetics: AB is readily degraded on TiO2/GrF while substantially slower degradation kinetic is observed on TiO2/NiO/GrF. The specific structure of the support therefore plays a decisive role on the degradation kinetics, and will be discussed below.
The degradation kinetics are generally described by the Langmuir–Hinshelwood (L–H) kinetics model
 | (2) |
 | (3) |
 | (4) |
| Film heterostructure | Rate constant (min−1), rapid | Rate constant (min−1), slow |
|---|---|---|
| GrF/TiO2 | 0.275 | 0.053 |
| GrF/NiO/TiO2 | 0.033 | 0.016 |
| P25-TiO2/Si | 0.0057 (linear behaviour throughout reaction time) | — |
This suggests that the progressive and fast rarefication of the dye on the GrF/TiO2 heterostructures leads to slower photodegradation rates towards the end of the photocatalytic reaction. Because the reaction kinetics (mineralisation of the dye) depends on the adsorption of the dye molecules on the catalyst surface less molecules are available for the surface coverage at longer times thus leading to a tail in the degradation kinetics (see Fig. 6a). Indeed it has been reported that the degradation rate is very much dependent on the initial concentration of the dye within a certain concentration interval, and was rationalized in terms of the necessity of immediate availability of the dye molecules to react with the short-living oxidizing radicals generated on the oxide surface by UV irradiation.1–3 Following this reasoning a higher degradation rate is expected for higher initial dye concentration. The case of the thick TiO2 film that shows linear kinetics throughout the experiment may be understood if we consider that the degradation rate is so slow that the number of adsorbed molecules remains almost constant during the experiment.
The question now arises as to the substantial differences found in the degradation rates associated with the two different heterostructures. As mentioned above some cross-doping is expected for the NiO–TiO2 nanostructure, although its extent remains unclear. More importantly, however, the build-up of a p-NiO–n-TiO2 junction should lead to efficient charge separation as NiO is known as hole scavenger.19 The photocatalytic performance of the GrF/NiO/TiO2 nanocomposite structure, although superior to that of the thick TiO2 film, is, nevertheless, inferior to that of GrF/TiO2. We may speculate that charge separation is more efficient in the GrF/TiO2 heterostructure than in the NiO–TiO2 heterojunction. Recent work on graphene/graphene oxide (GO) as catalyst supports suggest that a substantial mole fraction of photo-generated electrons from TiO2 nanoparticles are transferred to GO.20 A fraction of these electrons serves to reduce GO to reduced graphene oxide (RGO) with the remainder being stored in the GO or serves to reduce cations, e.g. of noble metals.20 It is thought that a similar mechanism may hold in the present situation. As outlined above the thermal treatment of the GrF substrates in air induces defects at the surface of the graphite fibres, as attested by the increase in the intensity of the defect D band, which may lead to the formation of GO.15,21 Upon irradiation with UV light efficient carrier separation occurs because the photo-generated electron are scavenged by GO and can be transferred to oxygen to form highly reactive radicals that explain the higher photocatalytic activity observed for the GrF/TiO2 samples.
Conclusions
In conclusion we have shown that graphite substrates with high surface area, in particular graphite felt, can be used as supports for catalysts in general and photocatalysts in particular. A one pot synthesis route has been applied using an immersion technique to process nanocrystalline, mesoporous TiO2 anatase films either directly on GrF or on GrF terminated with Ni(OH)2 nanoleaflet structure. The TiO2 films are shown to espouse the morphology of the support thus affording a high surface area. The photocatalytic properties obtained with these composite materials are most promising with full degradation/discoloration of a model dye achieved within less than 60 minutes in the case of TiO2 directly deposited on GrF. At this stage it seems that achieving heterojunction with other semi-conductor oxides does not necessarily positively impact the properties. Rather a direct contact between, a presumably oxidized, graphite surface and TiO2 seems to be more effective in terms of carrier separation and photocatalytic activity. The one-pot synthesis devised in this work may be applied to other catalysts and nanocomposites, and should show a way for using cost-effective and active supports together with sustainable bottom-up processing routes for making advanced catalysts.Acknowledgements
Financial support of this work is provided by the German Federal Ministry of Education and Research (BMBF) for a cooperative project between the University of Applied Sciences Kiel and the University Ibn Zohr in Agadir, Morocco. Project #MAR10/003; project code 01DH12027.References
- O. Carp, C. L. Huisman and A. Reller, Prog. Solid State Chem., 2004, 32, 33 CrossRef CAS PubMed.
- A. Fujishima, T. N. Rao and D. A. Tryk, J. Photochem. Photobiol., C, 2000, 1, 1 CrossRef CAS.
- I. K. Konstantinou and T. A. Albanis, Appl. Catal., B, 2004, 49, 1 CrossRef CAS PubMed.
- P. V. Kamat, J. Phys. Chem. C, 2007, 111, 2834 CAS.
- W. Y. Teoh, J. A. Scott and R. Amal, J. Phys. Chem. Lett., 2012, 3, 629 CrossRef CAS PubMed.
- D. L. Liao, C. A. Badour and B. Q. Liao, J. Photochem. Photobiol., A, 2008, 194, 11 CrossRef CAS PubMed.
- A. Tanaka, S. Sakaguchi, K. Hashimoto and H. Kominami, ACS Catal., 2013, 3, 79 CrossRef CAS.
- D. G. Shchukin and R. A. Caruso, Chem. Mater., 2004, 16, 2287 CrossRef CAS.
- J. Mani, H. Sakeek, S. Habouti, M. Dietze and M. Es-Souni, Catal. Sci. Technol., 2012, 2, 379 CAS.
- A. H. El-Sheikh, A. P. Newman, H. Al-Daffaee, S. Phull, N. Cresswell and S. York, Surf. Coat. Technol., 2004, 187, 284 CrossRef CAS PubMed.
- H. Yamashita, M. Harada, A. Tanii, M. Honda, M. Takeuchi, Y. Ichihashi, M. Anpo, N. Iwamoto, N. Itoh and T. Hirao, Catal. Today, 2000, 63, 63 CrossRef CAS.
- P. Fu, Y. Luan and X. Dai, J. Mol. Catal. A: Chem., 2004, 221, 81 CrossRef CAS PubMed.
- Z. Q. Li, C. J. Lu, Z. P. Xia, Y. Zhou and Z. Luo, Carbon, 2007, 45, 1686 CrossRef CAS PubMed.
- D. S. Hall, D. J. Lockwood, S. Poirier, C. Bock and B. R. MacDougall, J. Phys. Chem. A, 2012, 116, 6771 CrossRef CAS PubMed.
- M. A. Pimenta, G. Dresselhaus, M. S. Dresselhaus, L. G. Cançado, A. Jorio and R. Saito, Phys. Chem. Chem. Phys., 2007, 9, 1276 RSC.
- P. Wang, D. Chen and F.-Q. Tang, Langmuir, 2006, 22, 4832 CrossRef CAS PubMed.
- C. J. Brinker and G. W. Scherer, Sol–Gel Science: The Physics and Chemistry of Sol–Gel Processing, Academic Press, 1990, pp. 47–49 Search PubMed.
- W. Laqua, E. W. Schulz and B. Reuter, Z. Anorg. Allg. Chem., 1977, 433, 167 CrossRef CAS PubMed.
- Z. Wu, Y. Wang, L. Sun, Y. Mao, M. Wang and C. Lin, J. Mater. Chem. A, 2014, 2, 8223–8229 CAS.
- I. V. Lightcap, T. H. Kosel and P. V. Kamat, Nano Lett., 2010, 10, 577 CrossRef CAS PubMed.
- W. Gao, L. B. Alemany, L. Ci and P. M. Ajayan, Nat. Chem., 2009, 1, 403 CrossRef CAS PubMed.
| This journal is © The Royal Society of Chemistry 2015 |

