
Preparation of graphene oxide with silver nanowires to enhance antibacterial properties and cell compatibility
Jianghu Cuia and
Yingliang Liu*b
aGuangdong Key Laboratory of Agricultural Environment Pollution Integrated Control, Guangdong Institute of Eco-Environmental and Soil Sciences, Guangzhou 510650, China. E-mail: tliuyl@scau.edu.cn
bCollege of Materials and Energy, South China Agricultural University, 510642, Guangzhou, Guangdong, P R China
First published on 25th September 2015
Abstract
In this work, we present a simple approach for the deposition of silver nanowires onto graphene oxide sheets (GO–Ag NWs). Silver nanowires (Ag NWs) were evenly distributed and tightly adherent to the surface of the graphene oxide (GO) sheets. The results from this study showed that silver ions were released from the GO sheets in a constant and slow manner. Importantly, the results showed that the antibacterial activity of the GO–Ag NWs was much more potent than that of the silver nanowires. Changes in the cellular morphology, the level of reactive oxygen species (ROS) and the content of DNA and RNA were also investigated. It was demonstrated that the cell membrane integrity was damaged, and DNA, RNA and proteins leaked out due to oxidative damage of the bacteria through the release of ROS, brought about by the silver ions. On the basis of the present investigation, a plausible antibacterial mechanism of the GO–Ag NWs composites was proposed. Lastly, the results showed that the samples which decreased bacterial growth the most did not inhibit human skin keratinocyte cell growth compared to the Ag NWs. In summary, the results from this study indicated that the GO–Ag NWs provided unprecedented antibacterial properties while maintaining the cell proliferation capacity necessary for enhancing the wide use of silver in medical applications.
1. Introduction
With the threat of antibiotic resistant bacteria, researchers are searching for new antibacterial agents in order to control the bacteria.1 Owing to their unique chemical and physical properties, nanoscale materials have been explored as antibacterial agents and attracted the attention of many research groups worldwide.2–4 Some types of nanomaterials like zinc oxide,5 titanium oxide,6 copper and its oxide,7 and silver8 have been studied. It is well known that silver nanoparticles (Ag NPs) have become the engineered nanomaterials with the highest degree of commercialization due to their broad-spectrum antibacterial activities and minimal resistance development.9,10 There have been plenty of investigations to explore the potential applications of Ag NPs in antibacterial therapy. However, the practical application of Ag NPs is often weakened by self-aggregation or precipitation, and loss of antibacterial activity.11 To overcome these drawbacks, silver-based materials have been widely investigated, for example macromolecules,12 silicon-based materials13,14 and carbon15 materials have been used as support materials to load Ag NPs, integrating excellent antibacterial effects and other optical, electronic and magnetic properties.Graphene oxide (GO) has attracted broad attention in biomedical applications with its unique chemical, physical and thermal properties, with applications as a photothermal therapy agent for tumors,16–20 in cellular imaging,21,22 in chemical and biological sensors23,24 and as a nanocarrier for drug delivery.20,25 Meanwhile, GO has a high specific surface area and a great deal of oxygen bonds in its edges and defective sites. Therefore, GO is strongly hydrophilic, and forms stable colloidal dispersions in water.26 Such functional groups have been confirmed to possess reducibility.27 GO has been used as a highly biocompatible substrate to build new composites.28 For example, some metal nanoparticles have been employed to decorate GO sheets.29–32 These GO-based nanocomposites with fascinating properties have attracted research attention in biomedicine.33
Herein, we report a simple method for the synthesis of graphene oxide-loaded silver nanowires (GO–Ag NWs). The minimum inhibitory concentration, the bacterial growth kinetics and quantitative assessments of the GO–Ag NWs were performed. The changes in cellular morphology, the level of reactive oxygen species (ROS) and the content of DNA and RNA were also examined. Our results showed that the GO–Ag NWs could effectively enhance the antibacterial activity via the ROS and the release of silver ions. Taken together, this study illustrated the antibacterial activity against Escherichia coli (E. coli) and Staphylococcus aureus (S. aureus), and provided evidence to promote the application of silver in the treatment of infectious diseases.
2. Experimental section
2.1 Materials
Ascorbic acid and cetyltrimethylammonium bromide (CTAB) were from Guangzhou Chemical Reagent Factory. Poly(N-vinyl-2-pyrrolidone) (PVP, molecular weight = 30![[thin space (1/6-em)]](https://www.rsc.org/images/entities/char_2009.gif) 000–40000), graphite and KMnO4 were obtained from the Shanghai Chemical Factory (Shanghai, China). 2,7-Dichlorofluorescein-diacetate (DCFH-DA) was purchased from BD Biosciences (CA, USA). Silver nitrate was purchased from the Beijing Chemical Reagent Factory (Beijing, China). Others chemical reagents used in this study were of analytical grade and used without further purification. Water was purified using the Pine-Tree system.
000–40000), graphite and KMnO4 were obtained from the Shanghai Chemical Factory (Shanghai, China). 2,7-Dichlorofluorescein-diacetate (DCFH-DA) was purchased from BD Biosciences (CA, USA). Silver nitrate was purchased from the Beijing Chemical Reagent Factory (Beijing, China). Others chemical reagents used in this study were of analytical grade and used without further purification. Water was purified using the Pine-Tree system.
2.2 Preparation of graphene oxide
The water soluble GO was prepared by oxidizing pristine graphite according to a modified Hummers method.34 The graphite powder (1 g) was placed in concentrated H2SO4 (98%, 23 mL) at 0 °C. KMnO4 (3 g) was added gradually with stirring and the temperature of the mixture was kept below 20 °C. The mixture was then stirred at 35 °C for 2 h, followed by the addition of 46 mL of distilled water and continuous stirring for 15 min. 140 mL of distilled water was then added to terminate the reaction. Then, 30% H2O2 (2 mL) was added and the color of the mixture changed to bright yellow. The mixture was washed using repeated centrifugation with HCl aqueous solution and distilled water. The solutions were dried under vacuum and a GO powder was obtained.2.3 Preparation of the Ag NWs
Preparation of the silver seed: 20 mL of 0.25 mM AgNO3 and 5 mL of 0.25 mM trisodium citrate were mixed. The mixed solution was added to 0.6 mL of 10 mM NaBH4 and stirred vigorously all at once. The stirring was stopped after 30 s.35 A solution containing 2.5 mL of 10 mM AgNO3, 5.0 mL of 100 mM ascorbic acid and 93 mL of 80 mM cetyltrimethylammonium bromide (CTAB) was prepared. Then, 2.5 mL of the silver seed solution was added. Finally, 0.5 mL of 1 M NaOH was added, the solution was gently shaken just enough to mix the NaOH. A yellow color appeared within 15 min. Ag NWs were collected by the addition of a large amount of distilled water, followed by sonication and centrifugation.2.4 Preparation of the GO–Ag NWs
50 mg of GO powder was dissolved in 50 mL of H2O and sonicated for 30 min to form a homogeneous GO suspension. 2 g of PVP was added into the GO solution and kept at 65 °C for 30 min. Then, 4 mL Ag NWs solution was rapidly added into the GO solution under vigorous stirring. After continued stirring for 6 h in the dark, the sample was collected and washed with deionized water three times using centrifugation, and then freeze dried for further measurements under vacuum.2.5 Characterization
The obtained samples were characterized using X-ray diffraction (XRD) performed using an MSAL-XD2 X-ray diffractometer with a Cu target in the 2θ range from 5° to 80° (40 kV, 30 mA, λ = 1.54051 Å). The morphological features of the samples were investigated using field emission scanning electron microscopy (FESEM), transmission electron microscopy (TEM) and a JEOL JEM-2100F field emission electron microscope equipped with an Oxford INCA Energy TEM 200 EDS system. X-ray photoelectron spectroscopy (XPS) measurements were obtained using an ESCALAB-MKII spectrometer with an Axis Ultra photoelectron spectrometer using a monochromatic Mg Kα X-ray source (1253.6 eV) and the binding energies were referred to as C1s (284.8 eV). The concentration of silver was estimated using a multitype inductively coupled plasma emission spectrometer (PerkinElmer, Nexion 300).2.6 Antibacterial assay
In order to explore the antibacterial activities of the synthesized GO–Ag NWs composites, E. coli and S. aureus were introduced and cultured in Luria-Bertani (LB) medium and incubated in a shaking incubator at 37 °C. The minimum inhibitory concentration (MIC) of the GO–Ag NWs composites was measured using a standardized agar dilution. Briefly, the E. coli and S. aureus cells were spotted on a series of agar plates containing dilutions of the GO–Ag NWs composites and incubated at 37 °C. The MIC value is defined as the lowest concentration of the GO–Ag NWs at which no visible bacterial growth is observed. For comparison, the MIC of ampicillin was also determined following the same method.In order to further explore the antibacterial activities of the synthesized GO–Ag NWs composites, approximately 1 × 10⁸ cfu per mL of cells were grown in 50 mL of liquid LB medium supplemented with 12.5, 25, 50 and 100 μg mL−1 of Ag NWs and the GO–Ag NWs composites. Pure medium without material treatment and bacterial cell inoculation served as the negative control. Growth rates and bacterial concentrations were detected by measuring the optical density (O.D.) of the LB broth medium at 600 nm every hour.
The bacteria were incubated with the samples for 24 h in order to show the viability of the bacteria on the samples using fluorescence staining. GO, Ag NWs and GO–Ag NWs were added into the solution to make up the concentration of 10 μg mL−1. The culture medium was then removed and the samples were rinsed, stained using acridine orange (AO) and ethidium bromide (EB) for 15 min in the dark, and observed using fluorescence microscopy. EB did not penetrate the plasma membrane in the live cells and stained only the dead cells, whereas AO penetrated the plasma membrane and stained the live and dead cells. The live cells appeared green while the dead cells were orange.
2.7 Release properties
About 10 mg of the Ag NWs and GO–Ag NWs solids and the same equivalent of AgNO3 solution were added to 10 mL of ultrapure water and mixed into homogeneous solutions. The solutions were transferred into dialysis bags and were immersed in 50 mL of ultrapure water in a shaking incubator at 37 °C. After a given time interval, the concentration of the silver ions was determined using an inductively coupled plasma mass spectrometer (ICP-MS).2.8 Morphological changes of the cells
To visualize the morphology of the test bacteria in detail after treatment with the synthesized nanocomposites, we selected 10 μg mL−1 of the synthesized GO–Ag NWs as the final concentration to treat the E. coli cells with a sterilized silicon chip in the bottom. The samples and test cells were prepared as mentioned above. The silicon chip with the E. coli cells grown in a material-free medium was used as the control. After incubation for 2 h, the silicon chip was collected and processed for scanning electron microscopy according to the following. Briefly, the silicon chip was gently removed from the microtiter plates, and washed three times with buffer to remove the nonadherent bacterial cells and medium residues. Subsequently, the chip was fixed in 2.5% glutaraldehyde for 2 h at 4 °C. After fixation, the silicon chip was rinsed with buffer and subjected to a dehydration process by replacing the buffer with a graded series of ethanol. The silicon chip was dried before the chip was attached to an aluminum stub and coated with gold sputter for a conductive coating. The samples were then detected using FESEM.2.9 Leakage of the DNA, RNA and proteins of E. coli
50 mL of sample was added into a certain volume of sterile 0.5 wt% saline solution containing approximately 108 cfu per mL of E. coli. Then, the suspension was shaken for 1, 2, 3, 4, 5 and 6 h. After that, the solution was taken out and filtered using a Millipore filter. Finally, the optical density of the filtrate was recorded at 260 nm and 280 nm.2.10 Intracellular reactive oxygen species (ROS)
To determine the intracellular generation of ROS, an intracellular ROS indicator, DCFH-DA, was used. The oxidation of non-fluorescent 2,7-dichlorofluorescein (DCFH) to highly fluorescent DCFH-DA provides a quantitative assay for ROS formation. Experimental procedures were carried out exactly as a previously described method.36,37 K12 cells were exposed to the samples at the concentration of 10 μg mL−1 for 2 h in the dark and immediately analyzed using flow cytometry. A 488 nm laser was used for excitation and fluorescence was detected in FL-1. For each sample, the mean fluorescence intensity of 10000 cells was measured to present its intracellular production of ROS.
2.11 Cytotoxicity assay
Human skin keratinocyte (HaCaT) cells were cultured in media containing fetal bovine serum (10%), penicillin (1000 units per mL) and streptomycin (1 mg mL−1) at 37 °C in a 5% CO2 humidified environment. The cell viability was evaluated using an MTT assay. GO–Ag NWs and Ag NWs samples were added separately with a predetermined concentration in the culture medium (6.25, 12.5, 25 and 50 μg mL−1). The cells cultured in the medium without the materials were taken as the control. Finally, the absorbance was estimated using a Bio-Rad ELISA reader after 24, 48 and 72 h treatments.3. Results and discussion
3.1 Synthesis and characterization of the GO–Ag NWs
Ag NWs were synthesized at 160 °C for 2.5 h using a solvothermal method. Fig. 1A and B show the FESEM images of the as-prepared Ag NWs. The diameters of the Ag NWs are about 50 nm, and their lengths reach up to several tens to hundreds of micrometers. No other morphology of the Ag NWs was observed, the yield of the Ag NWs is almost 100% under the present synthetic conditions and the large-scale production of the Ag NWs is able to be carried out by increasing the content of AgNO3 or by scaling up the reaction volume. The microstructure of the Ag NWs was investigated using X-ray diffraction (XRD) and high-resolution transmission electron microscopy (HRTEM). Four diffraction peaks from the XRD pattern (Fig. 1C) were observed and indexed to the (111), (200), (220), and (311) planes of the face-centered cubic silver crystals. The calculated lattice constant based on the XRD pattern is 4.09 Å, close to the reported data. Moreover, no peaks were attributed to silver oxide indicating the purity and high quality of the Ag NWs. Furthermore, in order to obtain detailed structural information of the Ag NWs, Fig. 1D shows an HRTEM image from the edge of an individual Ag NWs. The interplanar spacing for the lattice fringes is 0.23 nm, which is consistent with the plane distance of silver (111). | ||
| Fig. 1 FESEM images of the as-synthesized Ag NWs (A and B); the XRD pattern of the Ag NWs (C); an HRTEM image of an individual Ag NWs (D). | ||
In order to synthesize the GO–Ag NWs, we chose PVP as the reductant and stabilizer. This facile procedure is schematically illustrated in Fig. 2. PVP has been widely used in medicine due to its low toxicity, chemical stability, and good biocompatibility.38 The as-prepared GO nanosheets were obtained using a modified Hummers method (Fig. 3A). The formation of the GO–Ag NWs readily indicated that the Ag NWs were supported on the GO sheets without aggregation (Fig. 3B and C). The chemical composition of the GO–Ag NWs was determined using energy dispersive spectroscopy (EDS). As shown in Fig. 3F, there are several kinds of peaks in the EDS spectrum taken from the GO–Ag NWs, which correspond to carbon, oxygen, copper and silver elements. The element of copper comes from the copper grid. It confirms the existence of the Ag NWs on the surface of the GO sheets. The GO–Ag NWs were also characterized using XPS. From the XPS results (Fig. 4A and B), the C1s line was used as a reference for the binding energy scale (284.5 eV), and the line positions of both N and O are 400 and 531 eV, respectively. Fig. 4B shows that the energy splitting value of 6.0 eV for the 3d doublet of Ag indicates the formation of metallic silver, which further supports the conclusion that the surface of the GO is successfully loaded with Ag NWs. The as-prepared GO–Ag NWs contain about 6.65 wt% Ag and 72.43 wt% C from the XPS results.
 | ||
| Fig. 2 Schematic representation of the reaction steps leading to the preparation of the GO–Ag NWs. | ||
 | ||
| Fig. 3 TEM images of the as-synthesized GO (A) and the GO–Ag NWs (B and C); (D) the HRTEM image of an individual Ag NWs; (E) a SAED image of an individual Ag NWs; the EDS pattern of the GO–Ag NWs (F). | ||
 | ||
| Fig. 4 XPS patterns of GO and the GO–Ag NWs (A and B); data was collected for the dissolution of AgNO3, Ag NWs and GO–Ag NWs at 37 °C (C). | ||
3.2 Release properties
The release kinetics of silver ions from silver-containing antibacterial agents is a key parameter in evaluating their applicability. In this study, the release profiles of silver ions were analyzed using ICP. As shown in Fig. 4C, the diffusion of silver ions was very fast from the AgNO3 sample to the aqueous phase in the first few hours. For the Ag NWs and GO–Ag NWs, the release of Ag+ out of the dialysis tube was much slower relative to that of AgNO3. After 30 days, approximately 77.8% and 62.4% of Ag+ were released out of the dialysis tube, respectively. The GO–Ag NWs showed a much slower release speed than the Ag NWs, and had a longer antibacterial activity than the Ag NWs. It was reported that the bacterial inactivation kinetics show the interfacial charge transfer process.39,40 The silver ions from these nanocomposites may be exchanged with hydronium ions in the fluid phase, whereas the release of silver ions from the Ag NWs anchored on GO can be delayed by the diffusion rate of the silver ions from the surface of the GO.3.3 Antibacterial measurements
The susceptibilities of E. coli and S. aureus to the GO–Ag NWs nanocomposites were demonstrated by the MIC value, an important parameter to evaluate the bacterial susceptibility to a certain antibacterial agent. As shown in Table 1, no visible E. coli growth can be observed on agar plates containing as low as 16 μg mL−1 of the GO–Ag NWs, while 20 μg mL−1 of the GO–Ag NWs is required to completely inhibit the growth of S. aureus, indicating that E. coli is more susceptible to the GO–Ag NWs than S. aureus. Interestingly, when compared to antibiotics, the MIC of ampicillin against S. aureus is lower than that of the GO–Ag NWs, whereas in the case of E. coli, the MIC of the GO–Ag NWs is equivalent. These large differences of the MIC between different bacterial species and antibacterial materials could indicate their distinct antibacterial mechanisms. The as-synthesized GO–Ag NWs nanocomposites are inorganic materials, with an equivalent antibacterial efficiency in comparison to that of ampicillin, and they should be widely used in the field of medical applications as an alternative antibacterial material.| Bacteria | Ag NWs | GO–Ag NWs | Ampicillin |
|---|---|---|---|
| E. coli | 28 | 16 | 14 |
| S. aureus | 35 | 20 | 12 |
Antibacterial activity of the samples was further studied through optical density measurements of the samples and growth observations using E. coli. The rate and extent of the growth inhibition can be determined from the time dependency of the recorded growth of the tested K12 cells over 24 h of cultivation. Given the advanced structure of the GO–Ag NWs, we performed antibacterial assays by measuring the effects of the GO–Ag NWs on the bacterial growth kinetics in liquid media in the absence of light, based on the turbidity of the cell suspension.
Fig. 5A shows that GO alone has no obvious inhibition on bacterial growth even at a high concentration. However, the growth of the bacterial cells was completely inhibited in the presence of the GO–Ag NWs (>25 μg mL−1). The time-dependence study of the growth inhibition of the bacterial cells confirmed the higher sensitivity of E. coli to the GO–Ag NWs than to the Ag NWs (Fig. 5B and C). As a traditional antibiotic, ampicillin has excellent antibacterial properties, but its instability limits its application. However, the as-synthesized GO–Ag NWs composites are inorganic materials with stable properties, with equivalent antibacterial efficiency compared to that of ampicillin, and they should be widely used in medical applications as an alternative antibacterial material. The ability of the GO–Ag NWs to prevent viable bacterial colonization is also demonstrated by fluorescence staining. As shown in Fig. 6, the results suggest that almost all of the bacteria are viable when cultured on the control and GO. There are large amounts of viable bacteria on the Ag NWs and smaller amounts on the GO–Ag NWs.
 | ||
| Fig. 5 Growth curves of E. coli inhibited by GO (A), GO–Ag NWs (B), Ag NWs (C) and ampicillin (D). | ||
 | ||
| Fig. 6 Representative images showing the viability of the bacteria on the control (A), GO (B), Ag NWs (C) and GO–Ag NWs (D) after 2 h of incubation, displayed with AO and EB fluorescence staining. | ||
3.4 Morphological changes of the cells with the GO–Ag NW treatment
To understand the antibacterial mechanism, the interaction of the GO–Ag NWs composites with E. coli bacteria and the morphological changes in E. coli cells were evaluated using FESEM. Fig. 7A and B show the FESEM images of the E. coli cells untreated and treated with the GO–Ag NWs. It is observed that there are no significant morphological changes in the untreated E. coli cells and the cell membranes relatively keep their integrity (Fig. 7A). However, the cells treated with the GO–Ag NWs exhibited apparent morphological changes, and the structures of the cell walls treated with the GO–Ag NWs showed significant damage. The disruption of the integrity of the cell membrane leads to lysis of the internal cell structure, as shown in Fig. 7B. Our antibacterial experiments demonstrate that the GO–Ag NWs exhibit enhanced antibacterial activity in both E. coli and S. aureus.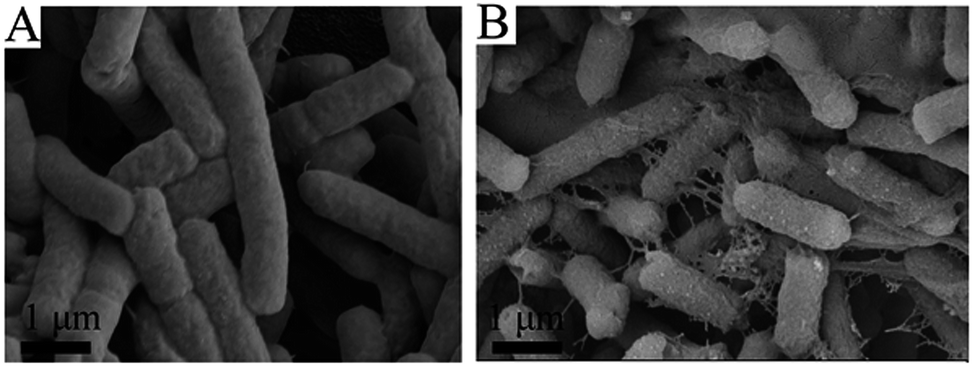 | ||
| Fig. 7 FESEM images showing the surface morphology of E. coli treated with the control (A) and GO–Ag NWs (B). | ||
In our work, Ag NWs have been loaded onto the surface of GO to effectively prevent their aggregation and protect their high surface reactivity. In addition, GO has stronger adsorption properties due to the binding and being in close proximity to the bacterial surface. The GO–Ag NWs could tend to stimulate the production of ROS, and thereby leading to the disruption of the integrity of the cell membrane and cell death. Thus, the as-synthesized nanocomposites are highly efficient inhibitors of bacterial growth.
3.5 The leakage of the DNA, RNA and proteins of E. coli
In order to study the antibacterial effect of the GO–Ag NWs nanocomposite, the content of DNA, RNA and proteins from the untreated and treated E. coli cells was analyzed. DNA and RNA have an ultraviolet absorption peak at approximately 260 nm due to the conjugated double bond system between the purine ring and pyrimidine ring, while proteins have an ultraviolet absorption peak at approximately 280 nm because of the existence of a conjugated double bond system between tyrosine and tryptophan. Hence, the influence of DNA, RNA and proteins corresponding to E. coli treated with the GO–Ag NWs nanocomposite could be analyzed by measuring the O.D. values at 260 nm and 280 nm, respectively. As seen from the results (Fig. 8A and B), after contact between E. coli and the samples, the higher antibacterial activities of the GO–Ag NWs would result in more leakage of DNA, RNA and proteins after the same treatment time. Moreover, the content of DNA, RNA and proteins all gradually decreased with a prolonged contact time. While we investigated the antibacterial effect of the GO–Ag NWs nanocomposite, the DNA isolated from the untreated and treated E. coli cells was analyzed using agarose gel electrophoresis. The results indicate that the intensity of the DNA band in lanes 2 and 3 corresponding to E. coli treated with 5 μg mL−1 and 10 μg mL−1 of the Ag NWs, shows no change compared to the control DNA in lane 1, suggesting that the Ag NWs exert no considerable effects on plasmid DNA replication. The E. coli cells treated with 5 μg mL−1 and 10 μg mL−1 of the GO–Ag NWs suggest that the concentration of the DNA in lanes 4 and 5 is obviously lower than that of the control due to the GO–Ag NWs exerting considerable effects on the plasmid DNA replication. The FESEM (Fig. 7) and electrophoretic results show the dual-mode antibacterial effect of the GO–Ag NWs which damages the cell membrane and inhibits DNA replication, resulting in bacterial cell death.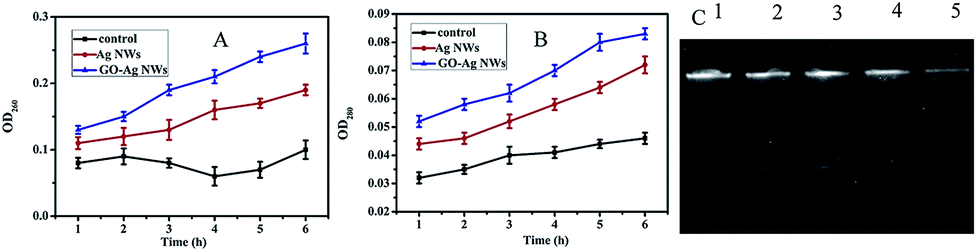 | ||
| Fig. 8 Leakage amount of (A) DNA and RNA, and (B) proteins of E. coli; (C) the effect of the GO–Ag NWs nanocomposites on plasmid DNA. Lane 1 represents the plasmid DNA isolated from untreated E. coli, lane 2, 3, 4 and 5 represent the plasmid DNA isolated from E. coli treated with 5 μg mL−1 and 10 μg mL−1 of the Ag NWs and GO–Ag NWs, respectively. | ||
3.6 Reactive oxygen species
A large number of investigators have reported that silver nanomaterials generate ROS to impact bacterial growth.41,42 Increased intracellular ROS will perturb the redox potential equilibrium, bring about an intracellular pro-oxidant environment and result in a series of adverse effects.43 To figure out the possible antibacterial mechanism of the GO–Ag NWs, we investigated the level of ROS using a DCFH-DA probe, which can be hydrolyzed to the non-fluorescent DCFH by an esterase in cells and can be further oxidized to produce the fluorescent dichlorofluorescein (DCF) by cellular ROS.Here, we investigated the oxidative stress response of the Ag NWs, GO and the GO–Ag NWs. The ROS production was detected using flow cytometry after 2 h of exposure to these samples. As shown in Fig. 9, the incubation of GO leads to a slight increase in the DCF fluorescence. In comparison, the DCF fluorescence intensity increases obviously with the treatment of the bacteria with the Ag NWs and GO–Ag NWs. ROS were detected using fluorescence measurements of the DCF reporter. All tests were repeated three times to get the mean values and standard deviations.
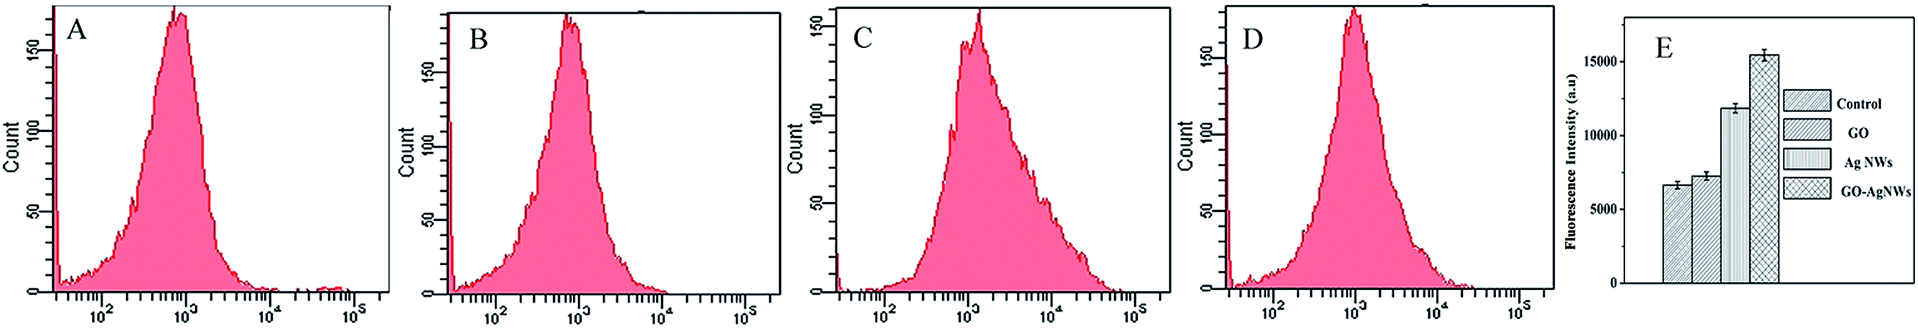 | ||
| Fig. 9 Formation of ROS in E. coli K12 cells after 2 h of incubation with the control (A), GO (B), Ag NWs (C) and GO–Ag NWs (D). | ||
Compared to the Ag NW-treated cells, those treated with the GO–Ag NWs showed higher fluorescence intensities. The results showed that the GO–Ag NWs could tend to stimulate the production of ROS and ultimately result in a series of adverse effects on these bacterial cells. The results indicate that the GO–Ag NWs can cause rupture of E. coli cells. The presence of the nanoparticles in suspension would ensure a continuous release of ions into the nutrient media. Silver ions released by the nanoparticles may have attached to the negatively charged bacterial cell walls and ruptured them, thereby leading to protein denaturation and cell death.
3.7 Effect of the GO–Ag NWs on cell viability
To explore the toxicity of the GO–Ag NWs material, we used an MTT assay method to measure the relative cell viability. HaCaT cells were chosen due to the likely contact of the material with the skin. Fig. 10 shows that the viability of the untreated cells was assumed to be 100%. The GO–Ag NWs were less toxic than the Ag NWs at almost all dosages. Increasing the concentration of the Ag NWs solution up to 50 μg mL−1 causes a significant increase in the toxicity and the cell viability is only 70.2%. In contrast, the cell viability for the GO–Ag NWs material is above 90%. These results indicate that the prepared GO–Ag NWs material is much more biocompatible than the Ag NWs.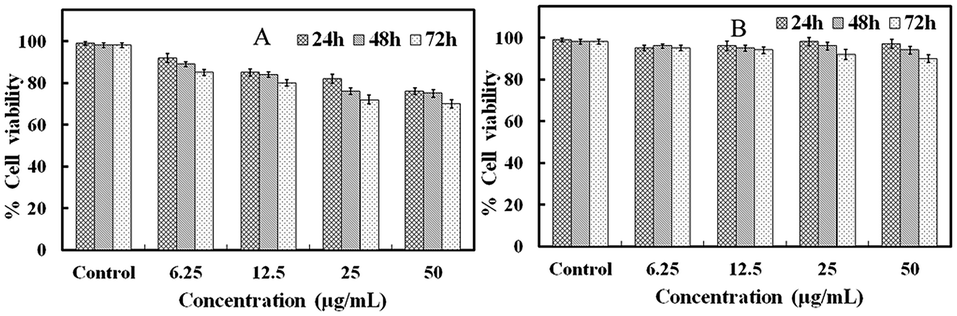 | ||
| Fig. 10 Concentration-dependent in vitro toxicity of the Ag NWs (A) and the GO–Ag NWs (B) after 24, 48 and 72 h. | ||
According to the above results, we proposed the antibacterial mechanism of the GO–Ag NWs material as follows (Fig. 11): the GO–Ag NWs could interact directly with the bacterial cell membrane through electrostatic interactions and the Ag ions were transported to the cytoplasm, which caused the generation of reactive oxygen species and the inhibition of genomic DNA replication. The cell wall/membrane integrity studies further demonstrated that the wall/membrane was damaged.
 | ||
| Fig. 11 Schematic illustration of the antibacterial mechanism of the GO–Ag NWs composites. | ||
4. Conclusions
In summary, we developed a route to deposit silver nanowires on the GO surface. This material was characterized using XRD, TEM and XPS measurements. The results indicated that Ag NWs were loaded successfully on the surfaces of GO sheets. We also confirmed that GO–Ag NWs exhibited an enhanced antibacterial activity, which was caused by the generation of ROS in bacteria, the slow-release of silver ions and self-aggregation. In addition, the antibacterial mechanism of the GO–Ag NWs was studied. The GO–Ag NWs could release Ag ions that generated ROS, leading to the leakage of DNA, RNA and proteins, which contributed to the enhanced antibacterial activity. From a practical viewpoint for clinical applications, the GO–Ag NWs may possess more promising applications in clinical treatment, especially for the increasingly resistant strains in the clinic.Conflict of interest
The authors declare no competing financial interest.Acknowledgements
This work was supported by the National Natural Science Foundation of China (Grant No. 41401564), Natural Science Foundation of Guangdong Province, China (No. 2014A030313706) and Science and Technology Program of Guangzhou, China (No. 201510010259).References
- H. Goossens, M. Ferech, R. Vander Stichele and M. Elseviers, Lancet, 2005, 365, 579–587 Search PubMed.
- L. Zhao, H. Wang, K. Huo, X. Zhang, W. Wang, Y. Zhang, Z. Wu and P. K. Chu, Biomaterials, 2013, 34, 19–29 CrossRef PubMed.
- M. I. Mejía, G. Restrepo, J. M. Marín, R. Sanjines, C. Pulgarín, E. Mielczarski, J. Mielczarski and J. Kiwi, ACS Appl. Mater. Interfaces, 2010, 2, 230–235 Search PubMed.
- K. Page, R. G. Palgrave, I. P. Parkin, M. Wilson, S. L. P. Savin and A. V. Chadwick, J. Mater. Chem., 2007, 17, 95–104 RSC.
- J. T. Seil and T. J. Webster, Acta Biomater., 2011, 7, 2579–2584 CrossRef CAS PubMed.
- K. Huo, X. Zhang, H. Wang, L. Zhao, X. Liu and P. K. Chu, Biomaterials, 2013, 34, 3467–3478 CrossRef CAS PubMed.
- S. Chen, Y. Guo, S. Chen, H. Yu, Z. Ge, X. Zhang, P. Zhang and J. Tang, J. Mater. Chem., 2012, 22, 9092–9099 RSC.
- D. Guo, L. Zhu, Z. Huang, H. Zhou, Y. Ge, W. Ma, J. Wu, X. Zhang, X. Zhou, Y. Zhang, Y. Zhao and N. Gu, Biomaterials, 2013, 34, 7884–7894 CrossRef CAS PubMed.
- R. Wang, L. Wang, L. Zhou, Y. Su, F. Qiu, D. Wang, J. Wu, X. Zhu and D. Yan, J. Mater. Chem., 2012, 22, 15227–15234 RSC.
- E. I. Alarcon, K. Udekwu, M. Skog, N. L. Pacioni, K. G. Stamplecoskie, M. González-Béjar, N. Polisetti, A. Wickham, A. Richter-Dahlfors, M. Griffith and J. C. Scaiano, Biomaterials, 2012, 33, 4947–4956 CrossRef CAS PubMed.
- R. Kumar and H. Münstedt, Biomaterials, 2005, 26, 2081–2088 CrossRef CAS PubMed.
- M. A. Nassar and A. M. Youssef, Carbohydr. Polym., 2012, 89, 269–274 CrossRef CAS PubMed.
- Y. Zhou, X. Jiang, J. Tang, Y. Su, F. Peng, Y. Lu, R. Peng and Y. He, J. Mater. Chem. B, 2014, 2, 691–697 RSC.
- A. Szegedi, M. Popova, K. Yoncheva, J. Makk, J. Mihaly and P. Shestakova, J. Mater. Chem. B, 2014, 2, 6283–6292 RSC.
- J. Cui, C. Hu, Y. Yang, Y. Wu, L. Yang, Y. Wang, Y. Liu and Z. Jiang, J. Mater. Chem., 2012, 22, 8121–8126 RSC.
- O. Akhavan, E. Ghaderi, S. Aghayee, Y. Fereydooni and A. Talebi, J. Mater. Chem., 2012, 22, 13773–13781 RSC.
- J. T. Robinson, S. M. Tabakman, Y. Liang, H. Wang, H. S. Casalongue, V. Daniel and H. Dai, J. Am. Chem. Soc., 2011, 133, 6825–6831 CrossRef CAS PubMed.
- K. Yang, J. Wan, S. Zhang, B. Tian, Y. Zhang and Z. Liu, Biomaterials, 2012, 33, 2206–2214 CrossRef CAS PubMed.
- K. Yang, S. Zhang, G. Zhang, X. Sun, S. T. Lee and Z. Liu, Nano Lett., 2010, 10, 3318–3323 CrossRef CAS PubMed.
- W. Zhang, Z. Guo, D. Huang, Z. Liu, X. Guo and H. Zhong, Biomaterials, 2011, 32, 8555–8561 CrossRef CAS PubMed.
- K. Liu, J. J. Zhang, F. F. Cheng, T. T. Zheng, C. Wang and J. J. Zhu, J. Mater. Chem., 2011, 21, 12034–12040 RSC.
- X. Sun, Z. Liu, K. Welsher, J. T. Robinson, A. Goodwin, S. Zaric and H. Dai, Nano Res., 2008, 1, 203–212 CrossRef CAS PubMed.
- V. Dua, S. P. Surwade, S. Ammu, S. R. Agnihotra, S. Jain, K. E. Roberts, S. Park, R. S. Ruoff and S. K. Manohar, Angew. Chem., Int. Ed., 2010, 49, 2154–2157 CrossRef CAS PubMed.
- J. T. Robinson, F. K. Perkins, E. S. Snow, Z. Wei and P. E. Sheehan, Nano Lett., 2008, 8, 3137–3140 CrossRef CAS PubMed.
- L. Zhang, J. Xia, Q. Zhao, L. Liu and Z. Zhang, Small, 2010, 6, 537–544 CrossRef CAS PubMed.
- R. Pasricha, S. Gupta, A. G. Joshi, N. Bahadur, D. Haranath, K. N. Sood, S. Singh and S. Singh, Mater. Today, 2012, 15, 118–125 CrossRef CAS.
- H. P. Cong, J. J. He, Y. Lu and S. H. Yu, Small, 2010, 6, 169–173 CrossRef CAS PubMed.
- J. Zhang, F. Zhang, H. Yang, X. Huang, H. Liu, J. Zhang and S. Guo, Langmuir, 2010, 26, 6083–6085 CrossRef CAS PubMed.
- C. Xu, X. Wang and J. Zhu, J. Phys. Chem. C, 2008, 112, 19841–19845 CAS.
- C. Xu and X. Wang, Small, 2009, 5, 2212–2217 CrossRef CAS PubMed.
- S.-M. Paek, E. Yoo and I. Honma, Nano Lett., 2009, 9, 72–75 CrossRef CAS PubMed.
- C. Xu, X. Wang, L. Yang and Y. Wu, J. Solid State Chem., 2009, 182, 2486–2490 CrossRef CAS PubMed.
- W. P. Xu, L. C. Zhang, J. P. Li, Y. Lu, H. H. Li, Y. N. Ma, W. D. Wang and S. H. Yu, J. Mater. Chem., 2011, 21, 4593–4597 RSC.
- J. Zhang, G. Shen, W. Wang, X. Zhou and S. Guo, J. Mater. Chem., 2010, 20, 10824–10828 RSC.
- N. R. Jana, L. Gearheart and C. J. Murphy, Chem. Commun., 2001, 3, 617–618 RSC.
- M. C. Serrano, R. Pagani, M. Manzano, J. V. Comas and M. T. Portoles, Biomaterials, 2006, 27, 4706–4714 CrossRef CAS PubMed.
- S. Kim, W. K. Oh, Y. S. Jeong, J. Y. Hong, B. R. Cho, J. S. Hahn and J. Jang, Biomaterials, 2011, 32, 2342–2350 CrossRef CAS PubMed.
- X. Liu, Y. Xu, Z. Wu and H. Chen, Macromol. Biosci., 2013, 13, 147–154 CrossRef CAS PubMed.
- S. Rtimi, R. Sanjines, C. Pulgarin, A. Houas, J. C. Lavanchy and J. Kiwi, J. Hazard. Mater., 2013, 260, 860–868 CrossRef CAS PubMed.
- S. Rtimi, M. Pascu, R. Sanjines, C. Pulgarin, M. Ben-Simon, A. Houas, J. C. Lavanchy and J. Kiwi, Appl. Catal., B, 2013, 138–139, 113–121 CrossRef CAS PubMed.
- H. L. Su, C. C. Chou, D. J. Hung, S. H. Lin, I. C. Pao, J. H. Lin, F. L. Huang, R. X. Dong and J. J. Lin, Biomaterials, 2009, 30, 5979–5987 CrossRef CAS PubMed.
- H. L. Su, S. H. Lin, J. C. Wei, I. C. Pao, S. H. Chiao, C. C. Huang, S. Z. Lin and J. J. Lin, PLoS One, 2011, 6, e21125 CAS.
- C. Carlson, S. M. Hussain, A. M. Schrand, L. K. Braydich-Stolle, K. L. Hess, R. L. Jones and J. J. Schlager, J. Phys. Chem. B, 2008, 112, 13608–13619 CrossRef CAS PubMed.
| This journal is © The Royal Society of Chemistry 2015 |