Synthesis of cationic chitosan hydrogel with long chain alkyl and its controlled glucose-responsive drug delivery behavior
Xue Zou,
Xiaowen Zhao and
Lin Ye*
State Key Laboratory of Polymer Materials Engineering of China, Polymer Research Institute of Sichuan University, Chengdu, China. E-mail: yelinwh@126.com; Tel: +86 028 85408802
First published on 27th October 2015
Abstract
A novel glucose-responsive controlled drug release system based on cationic chitosan derivative (HDCC) with long chain alkyl was synthesized by etherification with glycidyl trimethylammonium chloride (GTMAC) and (2,3-epoxypropoxy) dodecyldimethylammonium chloride (EDC). The composition of HDCC was characterized by FTIR and 1H NMR analysis. An improved water solubility and a relatively wide pH buffering path can be achieved for HDCC. With increasing substitution degree of long chain alkyl groups (DSA) of HDCC hydrogels, the modulus and crosslinking density increased, while the swelling ratios decreased, suggesting the formation of a more compact structure due to the physical entanglement of the long alkyl chains. The encapsulation efficiency (EE) and drug loading capacity (LC) of HDCC hydrogels increased with increasing DSA, suggesting the enhancement of interactions between the long alkyl chains and bovine serum albumin (BSA). By increasing the pH value from 6.8 to 7.4, a considerable decrease in cumulative release was observed for all hydrogels because the acidic environment could promote the hydrolysis of their cationic groups. Introduction of long alkyl chains slowed down the initial burst release rate of the hydrogels and better pH and glucose sensitive release behavior of BSA and insulin can be observed. Drug release kinetic data under different pH values and glucose concentrations for BSA-loaded hydrogels presented an almost Fickian release behavior, and the kinetic constant k decreased with increasing DSA, indicating that HDCC hydrogels may achieve a better slow-release effect.
1 Introduction
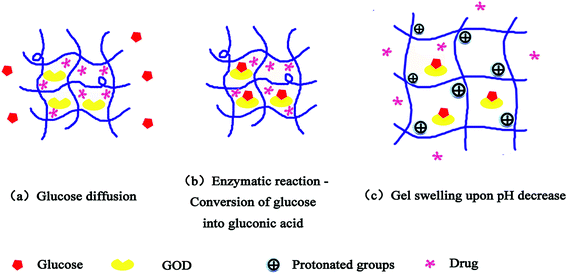
Diabetes mellitus, a disorder of glucose regulation, is a global burden affecting 366 million people across the world.1 For tight control of hyperglycemia and prevention of the resulting complications in diabetic patients, it is highly desirable to develop simple, effective, and continuously self-regulated drug delivery systems.2 Glucose-responsive hydrogels, known as stimuli-responsive or “intelligent” systems, can adapt the rate of drug release in response to changes in glucose concentration in order to maintain blood glucose levels within the normal range.Several examples of glucose-responsive hydrogels have already been reported using natural receptors, such as the enzyme glucose oxidase (GOD)3–5 or lectin concanavalin A (Con A),6,7 as well as synthetic ones such as phenylboronic acid (PBA).8,9 GOD modified materials, which were first used in the field of glucose responsive systems, have gained plenty of interest from researchers all over the world because of their convenience. In glucose-sensitive controlled delivery systems, GOD is entrapped or immobilized within a pH-sensitive matrix, which results in enzyme-catalyzed conversion of glucose to gluconic acid, thereby lowering the pH in the microenvironment of the hydrogel and causing drug release (as shown in Fig. 1).
Chitosan (CS) is a copolymer of D-glucosamine and N-acetylglucosamine derived from chitin, which is a potentially useful pharmaceutical material owing to its good biocompatibility and low toxicity. http://www.sciencedirect.com/science/article/pii/S0168365904000604.10–12 In our previous study, it was demonstrated that chitosan microspheres based on the amino group were pH sensitive in a wide range of pH, 1.0 to 9.0, which was not suitable in the field of glucose responsive drug release systems with a narrow physiological pH-sensitive variation range from 7.4 to 6.8 for the conversion of glucose to gluconic acid through GOD. The quaternized chitosan (HTCC) synthesized by the grafting reaction with glycidyltrimethylammonium chloride (GTMAC) showed more distinct pH sensitivity as compared with chitosan13 and satisfied the abovementioned narrow physiological pH variation for glucose responsive drug release systems. However, the initial burst effect and low drug loading efficiency were still two problems for the application of such HTCC hydrogels systems.14–16
Burst release is considered to be a negative effect under most of the circumstances in drug delivery. The importance of avoiding burst release can be seen in the number of publications that focused on developing methods to prevent or minimize the burst effect in a wide range of polymer/drug systems. For instance, Wenlong Wang et al.17 prepared docetaxel-loaded chitosan modified poly(lactic acid) (PLA) nanoparticles by an anti-solvent precipitation method. Investigation of an in vitro release study illustrated that PLA/chitosan nanoparticles prolonged drug release and decreased the burst release compared to the unmodified PLA nanoparticles. Yongmei Xu et al.18 obtained modified HTCC nanoparticles by adding polyethylene glycol (PEG) and sodium alginate. The incorporation promoted the stability of the nanoparticles surfaces, which obviously reduced the burst release of BSA from 42% to 18%. Unfortunately, of the methods that have been presented to prevent the burst effect, almost all involves the introduction of additional materials and additional costly steps and also result in reduced drug loading efficiency.
In this study, chitosan was modified by etherification with glycidyl trimethylammonium chloride (GTMAC) and (2,3-epoxypropoxy) dodecyldimethylammonium chloride (EDC) as etherifying agents together to yield novel cationic chitosan derivatives (HDCC) with a long chain alkyl. Through introduction of the cationic groups, the modified chitosan hydrogel may be expected to behave with distinct pH- and glucose-sensitivity, and by introduction of a long chain alkyl with strong physical entanglement, a more compact network structure and stronger interaction with drug may be expected to form for the hydrogel, resulting in reduction of the initial burst effect and improvement of drug encapsulation efficiency so as to realize tight control of hyperglycemia for diabetic patients. The effect of different molar ratios of GTMAC/EDC on the structure and drug release behavior of HDCC hydrogels was studied.
2 Experimental
2.1 Materials
Chitosan (molecular weight 1 × 10⁶ Da, degree of deacetylation 85%) was purchased from Zhejiang Jinke Biochemical (Zhejiang, China). Epichlorohydrin and sodium tripolyphosphate (TPP) were purchased from Tianjin Tianda Chemical Reagent Co. (Tianjin, China). Glycidyl trimethylammonium chloride (GTMAC) and dodecyldimethylamine were obtained from Dongying Guofeng Fine Chemical Co. Ltd. (Shandong, China). Bovine serum albumin (BSA) was provided by Huayi Bioengineering Co. Ltd. (Hubei, China). Glucose, GOD and insulin were purchased from Baoxin Biotechnology Co. Ltd. (Chengdu, China). All other reagents were of analytic reagent grade. Double distilled water was used throughout.2.2 Synthesis of (2,3-epoxypropoxy) dodecyldimethylammonium chloride (EDC)
Epichlorohydrin (2.0 g) was slowly added to the mixture of dodecyldimethylamine (1.5 g) and isopropanol (30 ml). The mixture was stirred at 50 °C for 36 h. The solvent and unreacted epichlorohydrin were evaporated under reduced pressure at room temperature. A transparent and very viscous liquid was obtained.2.3 Synthesis of modified chitosan
Chitosan was modified in a neutral aqueous system. Chitosan (2 g, 12.4 mmol) was dispersed in water/isopropanol media (30 ml) at 37 °C. The mixture was stirred for 30 min prior to dropwise addition of GTMAC and EDC. After reacting for 6 h at 60 °C, the turbid and yellowish reaction solution was poured into cold acetone and stirred in a refrigerator overnight. After being washed by acetone several times, the white precipitated product was collected by filtration. To obtain purer HTCC, the product was purified by dialysis for 2 to 3 days. By changing the molar ratio of GTMAC/EDC from 5![[thin space (1/6-em)]](https://www.rsc.org/images/entities/char_2009.gif) :
:![[thin space (1/6-em)]](https://www.rsc.org/images/entities/char_2009.gif) 0 to 4
0 to 4![[thin space (1/6-em)]](https://www.rsc.org/images/entities/char_2009.gif) :
:![[thin space (1/6-em)]](https://www.rsc.org/images/entities/char_2009.gif) 1, 3
1, 3![[thin space (1/6-em)]](https://www.rsc.org/images/entities/char_2009.gif) :
:![[thin space (1/6-em)]](https://www.rsc.org/images/entities/char_2009.gif) 2 and 5
2 and 5![[thin space (1/6-em)]](https://www.rsc.org/images/entities/char_2009.gif) :
:![[thin space (1/6-em)]](https://www.rsc.org/images/entities/char_2009.gif) 2, four modified chitosan samples were obtained and coded as HTCC, HDCC-1, HDCC-2, and HDCC-3, respectively.
2, four modified chitosan samples were obtained and coded as HTCC, HDCC-1, HDCC-2, and HDCC-3, respectively.
2.4 Preparation of modified chitosan hydrogels
The four modified chitosan solutions (2%) contained various concentrations of BSA (or insulin) (5, 10, 15, 20 mg) or GOD (0.6 mg) at room temperature. Then, the TPP aqueous solution (0.16 g of TPP in 2.0 ml water) was added to the modified chitosan aqueous solutions under stirring and incubated at 37 °C for 2 h to form hydrogels. The samples were freeze-dried for 24 h and stored at 4 °C before use.2.5 Measurements
 | (1) |
 | (2) |
 | (3) |
In vitro pH-sensitive drug release testing was carried out by incubating 10 mg BSA-loaded modified chitosan hydrogels samples in PBS buffer solutions with pH values of 6.8 and 7.4. Glucose-sensitive drug release behavior was analyzed by incubating 10 mg modified chitosan hydrogels samples in PBS buffer solutions (pH 7.4) with glucose concentration values of 0, 1, 4 mg ml−1.
To further investigate the glucose-sensitivity of BSA-loaded modified chitosan hydrogels, BSA release at alternant glucose concentrations (1 or 4 mg ml−1) was also tested. Simply, BSA release from HDCC hydrogels was conducted in PBS buffer solutions at pH 7.4 containing 1 mg ml−1 glucose during the first 3 h, and then the samples were transferred into the 4 mg ml−1 glucose medium for the second 3 h. At the third 3 h interval, the release sample was placed back into 1 mg ml−1 glucose medium. Furthermore, the release sample was transferred into the 4 mg ml−1 glucose medium again. At specified time intervals, 2 ml of this solution was taken out and assayed by an Alpha-1860 UV spectrometer (China) at the wavelength of 214 nm. The amount of BSA released from the testing hydrogels was then calculated from the standard BSA calibration curve. Samples in triplicate were averaged for each experiment.
The cumulative release (%) was determined using eqn (4):
 | (4) |
2.6 Statistical analysis
The quantitative results were obtained from triplicate samples and the data were expressed as mean ± SD (n = 3). Statistical analysis was performed using one-way analysis of variance, followed by post hoc Student's t-test. A value of p < 0.05 was considered to be statistically significant.3 Results and discussion
3.1 Characterization of HDCC synthesized with different molar ratios of GTMAC/EDC
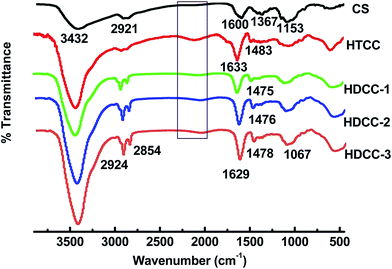
As illustrated in Scheme 1, the chitosan was modified by etherification with GTMAC/EDC as etherifying agents in a water/isopropanol environment (pH 6.5). In an acidic or neutral environment, the epoxy groups react predominantly with the amine groups of the chitosan backbone; whereas under an alkaline condition, conjugations occur predominantly to the hydroxyl groups of chitosan.20 In the present study, GTMAC and EDC were grafted mostly onto the amine groups of chitosan in acidic water/isopropanol media.The FTIR spectra of chitosan and the modified chitosan are shown in Fig. 2. The broad band at around 3432 cm−1 was attributed to N–H, O–H stretching vibration, and inter- and intra-molecular hydrogen bonds of chitosan molecules. The weak band at 2921 cm−1 was ascribed to –CH– stretching of chitosan. The characteristic peak at 1600 cm−1 was attributed to the –NH2 bands of chitosan. The peaks matched with the saccharide backbone were easily viewed at 1153 cm−1 (anti-symmetric stretching of the C–O–C).
In comparison with chitosan, several noticeable changes of absorption peaks occurred in the spectra of HTCC samples. The new peak at 1483 cm−1 of HTCC corresponds to the C–H bending of trimethylammonium group, confirming the existence of the quaternary ammonium salt.21–23 It should be also noted that the peak corresponding to the primary amine (1600 cm−1) of chitosan disappeared and a new peak at around 1633 cm−1 for HTCC was recorded, revealing the change of the primary amine to the secondary amine structure due to the reactions at –NH2 sites on the chitosan backbones. A weak and broad band at 2000–2200 cm−1 was observed, assigned potentially to a combination of the asymmetrical –N+(CH3)3 bending vibration and the torsional oscillation of the trimethylammonium group.
Compared with HTCC, the FTIR spectra of HDCC showed two new peaks at 2924 cm−1 and 2854 cm−1, which were attributed to the long alkyl chain, indicating the attachment of long chain alkyl groups onto amino groups of chitosan.24
Fig. 3(A) shows the 1H NMR spectra of chitosan and the modified chitosan at room temperature. It can be seen that the NMR chemical shift of hydroxyl and amino hydrogen on the chitosan chain disappeared because the active hydrogen was exchanged by D2O. The protons in methenyl group (H-2) connected to the amine group in chitosan were evidenced by the chemical shift at 3.18 ppm. The protons in methylene and the methenyl group (H-6,4,3,5) on the chitosan backbone could be found at 3.74–3.87 ppm.
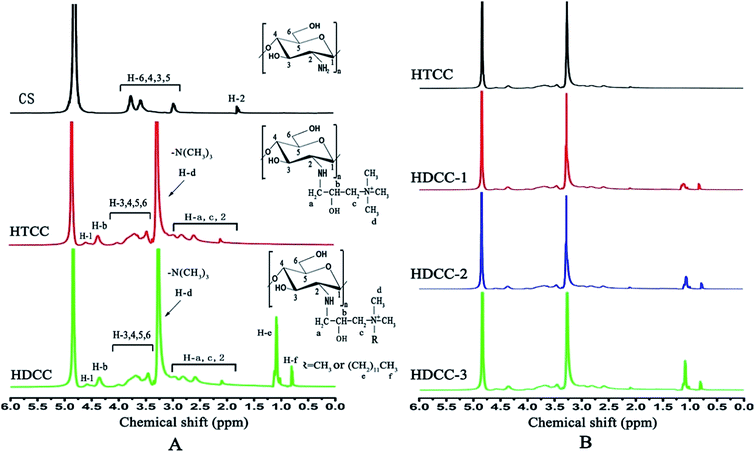 | ||
| Fig. 3 1H NMR spectra of chitosan and the modified chitosan samples: (A) chitosan, HTCC and HDCC; (B) HTCC, HDCC-1, HDCC-2 and HDCC-3. | ||
Different from chitosan, the spectra of HTCC showed a new characteristic chemical shift at 3.27 ppm attributed to the protons in –N+(CH3)3 groups due to the introduction of a quaternary ammonium group. The proton in the methenyl group (H-b) on the side chain of HTCC was exhibited at 4.58 ppm. The protons in the methylene group (H-a and H-c) on the side chain of HTCC could be found at 2.84 and 3.35 ppm. The chemical shift at 4.35 ppm was attributed to the proton in the hydroxyl groups on the side chain of HTCC.
In the 1H NMR spectra of HDCC, a new strong signal at 1.09 ppm was assigned to the methylene groups sequence (–N–CH2(CH2)10CH3) that was attached to the methyl group of the dodecyl groups. The protons in the methylene group (–N–CH2(CH2)10CH3) adjacent to the secondary amino groups could be found at 2.94 to 3.07 ppm. The methyl group of the long alkyl chain (–N–(CH2)11–CH3) showed a shift at 0.78 ppm. As seen in Fig. 3(B), the integral areas of the methyl groups in the long alkyl chain increased with increasing molar ratio of EDC/GTMAC and total amount of cationic etherifying agents.
The degree of substitution of quaternary ammonium groups (DSQ) and the degree of substitution of long chain alkyl cationic groups (DSA) of modified chitosan were further determined. The number of protons in methenyl (H-2) on the backbone of the chitosan chain was a constant before and after the grafting reaction, and it could be used as the internal standard. After grafting, DSQ and DSA could be calculated from the integral curve area of the protons in –N+(CH3)3 groups and protons in the grafted alkyl chain. DSQ and DSA of the modified chitosan samples were calculated with eqn (5) and (6):
 | (5) |
 | (6) |
 ,
,  and IH-2 represented integral areas of the signal of protons in –N(CH3)3+ groups and –N+(CH3)2(CH2)11CH3 groups, the protons of grafted long chain alkyl groups and the protons in methenyl (H-2) on the backbone of the chitosan chain.
The results are presented in Table 1. It was concluded that for the modified chitosan hydrogels samples HTCC, HDCC-1 and HDCC-2 with molar ratio of chitosan/etherifying agents of 1![[thin space (1/6-em)]](https://www.rsc.org/images/entities/char_2009.gif) :
:![[thin space (1/6-em)]](https://www.rsc.org/images/entities/char_2009.gif) 5, the DSQ values of HDCC decreased, while the DSA values increased with decreasing GTMAC/EDC ratio. It could be interpreted that the introduction of EDC with a relatively larger steric hindrance effect among the long alkyl chains resulted in the lower activity of the reaction system. As for HDCC-3 with 1
5, the DSQ values of HDCC decreased, while the DSA values increased with decreasing GTMAC/EDC ratio. It could be interpreted that the introduction of EDC with a relatively larger steric hindrance effect among the long alkyl chains resulted in the lower activity of the reaction system. As for HDCC-3 with 1![[thin space (1/6-em)]](https://www.rsc.org/images/entities/char_2009.gif) :
:![[thin space (1/6-em)]](https://www.rsc.org/images/entities/char_2009.gif) 7 molar ratio of chitosan/etherifying agents, higher values of DSQ and DSA can be obtained due to the increase of total amount of etherifying agents.
7 molar ratio of chitosan/etherifying agents, higher values of DSQ and DSA can be obtained due to the increase of total amount of etherifying agents.
| Samples | GTMAC/EDC ratio | DSQ% | DSA% |
|---|---|---|---|
| HTCC | 5![[thin space (1/6-em)]](https://www.rsc.org/images/entities/char_2009.gif) : :![[thin space (1/6-em)]](https://www.rsc.org/images/entities/char_2009.gif) 0 0 |
197 | — |
| HDCC-1 | 4![[thin space (1/6-em)]](https://www.rsc.org/images/entities/char_2009.gif) : :![[thin space (1/6-em)]](https://www.rsc.org/images/entities/char_2009.gif) 1 1 |
173 | 12 |
| HDCC-2 | 3![[thin space (1/6-em)]](https://www.rsc.org/images/entities/char_2009.gif) : :![[thin space (1/6-em)]](https://www.rsc.org/images/entities/char_2009.gif) 2 2 |
167 | 27 |
| HDCC-3 | 5![[thin space (1/6-em)]](https://www.rsc.org/images/entities/char_2009.gif) : :![[thin space (1/6-em)]](https://www.rsc.org/images/entities/char_2009.gif) 2 2 |
179 | 38 |
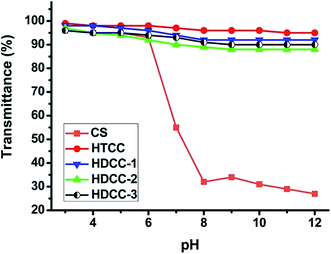
Fig. 4 exhibited the solubility of chitosan and modified chitosan samples at different pH values. The transmittance of chitosan decreased significantly when pH was above 6; however, HTCC and HDCC samples all exhibited higher transmittance values (about 90%) over a wide pH range. The introduction of large amounts of cationic groups caused chitosan to become more hydrophilic, and the steric hindrance effect of quaternary amino groups weakened the inter- and intra-molecular hydrogen bonding, resulting in great improvement of the water solubility of chitosan. On the other hand, the water solubility of HDCC was slightly lower than that of HTCC due to the hydrophobicity of long chain alkyl groups.
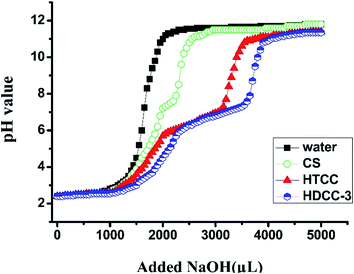
To better understand the pH-sensitive behavior of chitosan and the modified chitosan in an aqueous solution, the acid–base titration curve of the hydrogels is presented macroscopically in Fig. 5. In contrast, pure water, chitosan and modified chitosan were tested simultaneously with a concentration of 1 mg ml−1. As shown in Fig. 5, compared with pure water and chitosan, both the modified chitosans showed an obvious pH buffering path, which ranged from pH 5.3 to pH 7.6, and the buffering path of HDCC samples was wider than that of HTCC. This was due to the protonation of the trimethyl ammonium chloride groups and physical entanglement of long chain alkyl groups for HDCC, revealing that the HDCCs were more pH-sensitive than HTCC.
3.2 Network structure of HDCC hydrogels synthesized with different molar ratios of GTMAC/EDC
HTCC and HDCC were then cross-linked by TPP to form hydrogels. Frequency sweep tests are widely used to obtain information about the stability of three dimensional cross-linked networks. The frequency dependence of both storage modulus (G′) and loss modulus (G′′) was plotted in Fig. 6 for HTCC and HDCC hydrogels. Both figures showed typical gel spectra, with only very slight frequency dependence of the modulus; it could be asserted that the modulus would have a stable value even at low frequencies. The modulus of the HDCC hydrogels increased as the DSA increased, which indicated that more alkyl group substitution resulted in more compact and stable hydrogels.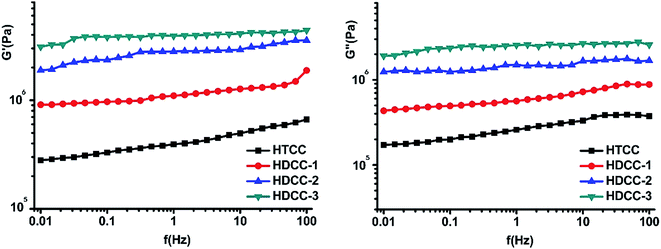 | ||
| Fig. 6 Variations with frequency of the shear modulus (G′ and G′′) of the modified chitosan hydrogels. | ||
In the hypothesis that the hydrogels may be regarded as a classic network, despite the fact that they presented a complex hierarchical structure, the storage modulus (G′) determined at low frequency may be related to the average number of equivalent units in a “network strand”, N, connecting two “ideal” junctions and to approximate this, the value of the network mesh size Lc was calculated with eqn (7) and (8).19 Moreover, crosslinking density (X) of hydrogels can be calculated using eqn (9).
| G′ = RTΦ1/3/NAva3N | (7) |
| Lc = (Φ)−1/3(C∞N)1/2a | (8) |
| X = G′Q1/3/RT | (9) |
In eqn (7), NAv is Avogadro's number, G′ is the shear modulus of the modified chitosan hydrogels samples, R is the gas constant, T is the absolute temperature, Φ is the polymer volume fractions of gel in the swollen state, NAva3 is the molar volume of the solvent, N is the average number of equivalent units with volume equal to the solvent volume (a3) between two junctions (in a “network strand”), and Q is the equilibrium swelling ratios of the modified chitosan hydrogels. In eqn (8), C∞ is the characteristic ratio of modified chitosan in relation to the molecular weight.
As shown in Table 2, the values of Lc thus obtained were in the range of 1.598–10.721 nm. With increasing DSA, G′ increased, Lc decreased and the crosslinking density of HDCC hydrogels increased, due to the enhancement of the physical entanglement interactions among the long chain alkyl groups of the HDCC hydrogels, resulting in the formation of a more compact structure, which made the hydrogel network shrink.
| Samples | G′ (Pa), storage modulus | N, average number of equivalent units | X (mol cm−3), crosslinking density | Lc (nm), average length of network strands |
|---|---|---|---|---|
| HTCC | 393![[thin space (1/6-em)]](https://www.rsc.org/images/entities/char_2009.gif) 000 000 |
28.578 | 0.1203 | 10.721 |
| HDCC-1 | 1![[thin space (1/6-em)]](https://www.rsc.org/images/entities/char_2009.gif) 100 100![[thin space (1/6-em)]](https://www.rsc.org/images/entities/char_2009.gif) 000 000 |
9.382 | 0.3095 | 4.676 |
| HDCC-2 | 2![[thin space (1/6-em)]](https://www.rsc.org/images/entities/char_2009.gif) 810 810![[thin space (1/6-em)]](https://www.rsc.org/images/entities/char_2009.gif) 000 000 |
3.234 | 0.6962 | 2.163 |
| HDCC-3 | 3![[thin space (1/6-em)]](https://www.rsc.org/images/entities/char_2009.gif) 902 902![[thin space (1/6-em)]](https://www.rsc.org/images/entities/char_2009.gif) 400 400 |
2.218 | 0.9210 | 1.598 |
3.3 Swelling behavior and pH-sensitive drug release of HDCC hydrogels synthesized with different molar ratios of GTMAC/EDC
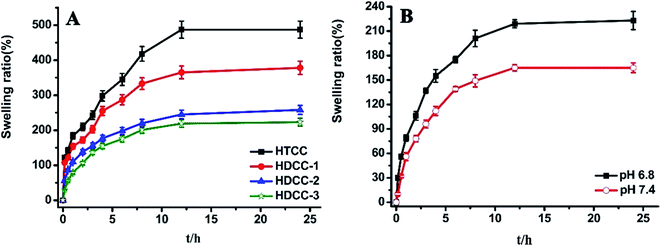
The swelling ratios of modified chitosan hydrogels immersed in buffer solutions (pH 6.8) were plotted versus time in Fig. 7(A). It can be seen that in the initial swelling stage, all samples absorbed water rapidly. The swelling ratio increased gradually with time, and reached equilibrium in about 12 h. In addition, the swelling ratios of HDCC hydrogels decreased with increasing DSA. This decrease can be attributed to the higher crosslinking density and more compact structure of the HDCC hydrogels.As can be seen from Fig. 7(B), the swelling ratio of HDCC-3 hydrogels exhibited higher values at acidic pH (pH6.8) than at basic pH (pH 7.4), which was attributed to the HDCC chains bearing positive charges. The expansive network allowed more acid solution to enter the interior. The results showed that HDCC hydrogels had good pH sensitivity.
To investigate the effect of pH value of the external medium on the drug release behavior of BSA-loaded modified chitosan hydrogels samples, the cumulative release amount of BSA in PBS buffer solution with pH 6.8 and 7.4 was measured.
Cumulative release data (as shown in Fig. 8) indicated that by increasing the pH value from 6.8 to 7.4, a considerable decrease in cumulative release was observed for all hydrogels. It suggested that the drug release profiles of all modified chitosan hydrogels were pH-sensitive. In addition, pH-sensitivity of modified chitosan hydrogels increased with the increase of DSA. Noticeably, when the DSA of HDCC was 38% (HDCC-3), there was a significant difference between BSA release profiles in the medium of pH 6.8 and 7.4, especially in the first 24 h.
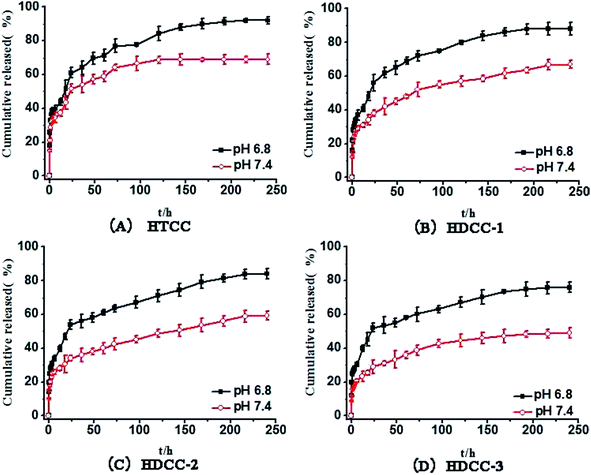 | ||
| Fig. 8 pH-responsive release behavior of the modified chitosan hydrogels in different pH conditions (pH 6.8 and 7.4) at 37 °C. Data points represent mean ± SD (n = 3). | ||
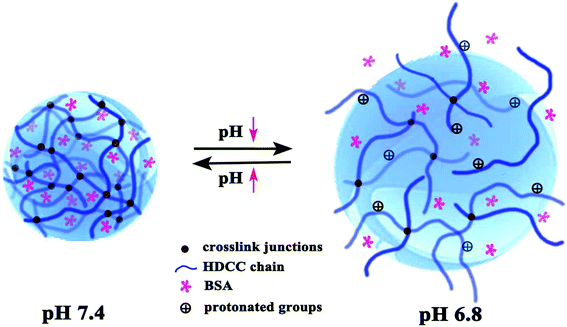
The schematic mechanism of pH-responsive release behavior of modified chitosan hydrogels is shown in Fig. 9. This behavior should be attributed to a different hydrolysis degree in PBS buffer solution with pH 6.8 and pH 7.4 because the acidic environment could promote the hydrolysis of the cationic groups of hydrogels. At physiological condition (pH 7.4), the weak degree of ionization along with the less positively charged amine groups of modified chitosan and more hydrogen bonds resulted in a relatively dense network structure with pore size 0.5–2 μm (Fig. 10(a)) and restricted BSA release from its carrier. In contrast, the amine groups on the chitosan and trimethyl ammonium chloride groups of modified chitosan became protonated, forming the hydrophilic –NH3+ groups and –N+(CH3)3 groups under a subacid environment (pH 6.8). The resulting electrostatic repulsion between the protonated cationic groups weakened the intermolecular and intramolecular hydrogen bonding interaction of chitosan molecules, and the obvious loose network structure with pore size 4–6 μm (Fig. 10(b)) can be observed. As a result, the PBS buffer solution can diffuse into the modified chitosan network easily, which would facilitate swelling and drug release. Moreover, the introduction of long chain alkyl groups slowed down the initial burst release rate (especially in pH 7.4) of the chitosan hydrogels and better pH-sensitive release behavior can be observed.
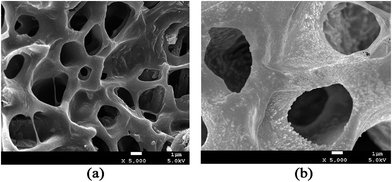 | ||
| Fig. 10 SEM images (×5000) of HDCC-3 hydrogels after immersion in PBS buffer solution (pH 7.4 or pH 6.8 37 °C) for 1 h. (a) HDCC hydrogel at pH 7.4; (b) HDCC hydrogel at pH 6.8. | ||
Encapsulation efficiency (EE) and drug loading capacity (LC) are two critical characteristics for evaluating the capacity of a selected polymer to entrap and carry a selected drug. EE and LC of drug may be altered by several factors such as the chemical structure of the polymers and drug and the interactions between the polymers and drug.25,26 In the present study, DSA of HDCC hydrogels was investigated for its possible influence on the EE and LC by entrapping BSA.
As revealed in Fig. 11, the BSA loading capacity for HTCC and the HDCC hydrogels samples was 8.2%, 10.6%, 12.7% and 15.4%. The BSA encapsulation efficiency for HTCC and the HDCC hydrogels samples was 90.1%, 92.3%, 96.5% and 98.4%. The EE and LC of the modified chitosan hydrogels increased with increasing DSA, which suggested that the interactions between the long alkyl chains of the HDCC hydrogels and BSA played an important role in determining the encapsulation efficiency and drug loading capacity.
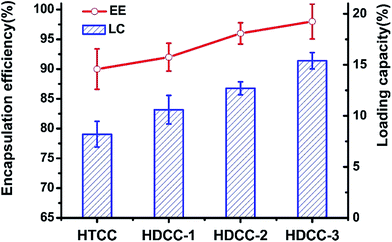 | ||
| Fig. 11 BSA encapsulation efficiency and loading capacity of the modified chitosan hydrogels. Data points represent mean ± SD (n = 3). | ||
3.4 Glucose-responsive drug release behavior of HDCC hydrogels
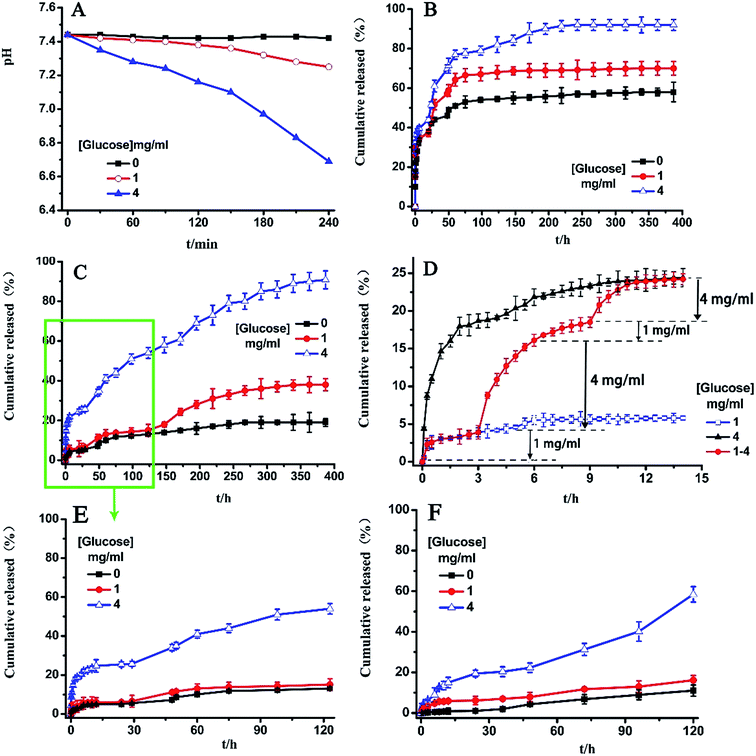
With respect to the in vitro release behavior of the polysaccharides delivery system, the release rate is highly affected by the nature of the interactive forces between the drug and hydrogel, as well as by the characteristics of the release medium. pH-sensitive modified chitosan hydrogels entrapped with GOD may be used as a glucose responsive drug release system. As shown in Fig. 12(A), the conversion of glucose to gluconic acid through GOD resulted in a decrease of pH value of PBS buffer solution from 7.4 to 6.8.Fig. 12(B) and (C) show the cumulative release profiles of BSA from HTCC and HDCC-3 hydrogels in response to different concentrations of glucose at pH 7.4, 37 °C. The results indicate a burst release behavior for HTCC hydrogels with different glucose concentrations during the initial 10 h. After the initial release, the release rate slowed down. However, it was observed that a much slower release rate was obtained when HTCC hydrogels were exposed to the basal glucose levels (1 mg ml−1) and control solutions (0 mg ml−1) than that at hyperglycemic glucose levels (4 mg ml−1). These results were consistent with the observed pH response (Fig. 7).
As seen in Fig. 12(C), the glucose-sensitivity of HDCC hydrogels was more distinct than that of HTCC hydrogels. Moreover, compared with HTCC hydrogels, HDCC-3 hydrogels exhibited a low initial burst and a slow release rate. This could be attributed to the strong physical entanglement interactions between the long alkyl chains of HDCC-3 hydrogels and BSA, and the structure of BSA-loaded HDCC hydrogels was more compact and dissociated more slowly. A hydrophobic barrier limited the access of water and dissolution of the drug.
The alternant release ability is considered to be one of the most important requisites for a potential clinically used glucose-responsive delivery system. In the present study, the alternant drug release from BSA-loaded HDCC-3 hydrogel was conducted in PBS buffer solution containing 1 or 4 mg ml−1 glucose at intervals of 3 h (Fig. 12(D)). The BSA-loaded HDCC-3 hydrogel was first placed in PBS buffer solution with 1 mg ml−1 glucose. The release of BSA was slow and only 3.9% of BSA was released in 3 h. Furthermore, the culture medium was changed to PBS with 4 mg ml−1 glucose, and then obvious BSA release (about 12.2%) was observed for the subsequent 3 h based on the glucose-sensitive release mechanism. When the release medium was switched back to PBS with 1 mg ml−1 glucose, BSA release was interrupted and only a 2.4% release amount was released during the following 3 h. However, the release behavior could be recovered as the release medium was changed from PBS with 1 mg ml−1 glucose to PBS with 4 mg ml−1 glucose again, as demonstrated by the release of 5.4% BSA during the 3 h interval. Therefore, the glucose-sensitive HDCC hydrogel that underwent glucose-switchable release was expected to be a promising therapeutic approach to diabetes mellitus.
To demonstrate the glucose-responsive release behavior of insulin-loaded HDCC-3 hydrogels, the cumulative release data of insulin from HDCC-3 hydrogels in response to different concentrations of glucose (0, 1, and 4 mg ml−1, at pH 7.4, 37 °C) were tested. The results showed that the release behavior tendency of insulin was consistent with BSA during the first 120 h. As shown in Fig. 12(E) and (F), insulin was released more slowly than BSA under the same glucose concentrations, especially at the first 10 h. For example, under glucose concentration of 4 mg ml−1, only 13.53% insulin was released from the hydrogels, while 23.35% of BSA was released. This can be attributed to the larger molecule and slower diffusion rate of insulin, resulting in enhancement of the physical entanglement interactions between the long chain alkyl groups of HDCC hydrogels and insulin.
3.5 In vitro release kinetics of HDCC hydrogels
To determine the drug release mechanism and compare the release profiles, the amount of drug released versus time was studied with the following Korsmeyer–Peppas models:ln![[thin space (1/6-em)]](https://www.rsc.org/images/entities/char_2009.gif) Mt/M∞ = n Mt/M∞ = n![[thin space (1/6-em)]](https://www.rsc.org/images/entities/char_2009.gif) ln ln![[thin space (1/6-em)]](https://www.rsc.org/images/entities/char_2009.gif) t + ln t + ln![[thin space (1/6-em)]](https://www.rsc.org/images/entities/char_2009.gif) k k |
Drug release kinetics data for BSA-loaded modified chitosan hydrogels in PBS buffer solution with pH 6.8 and 7.4 obtained from fitting drug release experimental data to the Korsmeyer–Peppas equation are summarized in Table 3. The exponent n values for the release of BSA from modified chitosan hydrogels were all less than 0.43, suggesting a Fickian release behavior and that diffusion through the swelling of modified chitosan hydrogels was the main factor in controlling BSA release. According to the correlation coefficient (r2), the release data fitted well to the exponential model when the surface effect was excluded. From Table 3, it could be found that the constant k of hydrogels decreased with increasing DSA at the same pH, corresponding to the enhanced physical entanglements interaction by long chain alkyl groups and compact network structure with high crosslinking density. Furthermore, Δk (the difference in constant k between pH 6.8 and pH 7.4) of the modified chitosan hydrogels increased with increasing DSA, which indicates that HDCC-3 was more distinctly pH-sensitive than HTCC.
| Samples | pH | Korsmeyer–Peppas model | |||
|---|---|---|---|---|---|
| Correlation coefficient, r2 | Diffusion exponent, n | Kinetic constant, k | Δk | ||
| a Note: Δk is the difference in constant k between pH 6.8 and pH 7.4. | |||||
| HTCC | 6.8 | 0.9763 | 0.2179 | 28.9960 | 3.8484 |
| 7.4 | 0.9738 | 0.2085 | 25.1476 | ||
| HDCC-1 | 6.8 | 0.9880 | 0.2277 | 25.2636 | 5.2875 |
| 7.4 | 0.9843 | 0.1924 | 19.9761 | ||
| HDCC-2 | 6.8 | 0.9896 | 0.2474 | 22.8535 | 5.3013 |
| 7.4 | 0.9901 | 0.2019 | 17.5522 | ||
| HDCC-3 | 6.8 | 0.9808 | 0.2518 | 21.5604 | 7.6949 |
| 7.4 | 0.9939 | 0.2236 | 13.8655 | ||
Drug release kinetics data for BSA-loaded modified chitosan hydrogels under different glucose concentrations are shown in Table 4. A good correlation coefficient (r2) approaching 0.98 was obtained in all cases. It was shown that the exponent n values for the release of BSA from HTCC hydrogels under different glucose concentrations were all less than 0.43, suggesting a Fickian release behavior. The exponent n values for the release of BSA from HDCC-3 hydrogels also gave an indication of Fickian diffusion under 0 mg ml−1 and 4 mg ml−1 glucose concentrations, and Fickian release behavior and polymer chain relaxation under 1 mg ml−1 glucose concentrations. Moreover, the constant k of HDCC-3 hydrogels was much lower than that of HTCC hydrogels under different glucose concentrations, indicating that HDCC-3 hydrogels may achieve a better slow-release effect.
| Samples | Glucose concentration (mg ml−1) | Korsmeyer–Peppas model | Transport mechanism | ||
|---|---|---|---|---|---|
| Correlation coefficient, r2 | Diffusion exponent, n | Kinetic constant, k | |||
| HTCC | 0 | 0.9814 | 0.2445 | 9.5780 | Fickian diffusion |
| 1 | 0.9517 | 0.1581 | 29.3573 | Fickian diffusion | |
| 4 | 0.9732 | 0.1881 | 32.0494 | Fickian diffusion | |
| HDCC-3 | 0 | 0.9846 | 0.4178 | 1.7218 | Fickian diffusion |
| 1 | 0.9769 | 0.6422 | 0.8939 | Fickian diffusion/polymer chain relaxation | |
| 4 | 0.9821 | 0.4149 | 7.7292 | Fickian diffusion | |
4 Conclusions
In this study, a glucose-responsive controlled drug-release system based on HDCC hydrogel with long chain alkyl groups was synthesized, and its composition was analyzed by FTIR and 1H NMR analysis. Introduction of cationic groups resulted in improvement of water solubility of HDCC, and introduction of long chain alkyl groups resulted in a wider pH buffering path. With increasing DSA, the modulus and crosslinking density of HDCC hydrogel increased, while the swelling ratios decreased, which indicated that more alkyl group substitution resulted in more-compact and stable hydrogels. A considerable increase in the cumulative release of BSA was observed by decreasing the pH value from 7.4 to 6.8 because the acidic environment could promote the hydrolysis of the cationic groups of hydrogels and pH sensitivity of the hydrogels increased with the increase of DSA. The encapsulation efficiency and drug loading capacity of HDCC hydrogels increased with increasing DSA, which suggested enhancement of interactions between the long alkyl chains and BSA. The release profiles revealed that BSA and insulin release from HDCC hydrogels were in response to the glucose concentration, and the alternant glucose-switchable release ability was observed. Drug-release kinetics data under different pH values and glucose concentration for BSA-loaded hydrogels presented an almost Fickian release behavior, and HDCC hydrogels were more distinctly pH- and glucose-sensitive than HTCC hydrogels and can achieve better slow-release effect.References
- Z. Gu, A. A. Aimetti and Q. Wang, et al., ACS Nano, 2013, 7, 4194 CrossRef CAS PubMed.
- X. Chen, W. Wu and Z. Guo, et al., Biomaterials, 2011, 32, 1759 CrossRef CAS PubMed.
- J. Luo, S. Cao and X. Chen, et al., Biomaterials, 2012, 33, 8733 CrossRef CAS PubMed.
- S. I. Kang and Y. H. Bae, J. Controlled Release, 2003, 86, 115 CrossRef CAS PubMed.
- M. K. L. Chu, J. Chen and C. R. Gordijo, et al., Lab Chip, 2012, 2533 RSC.
- R. Yin, K. Wang and S. Du, et al., Carbohydr. Polym., 2014, 103, 369 CrossRef CAS PubMed.
- R. Yin, Z. Tong and D. Yang, et al., Carbohydr. Polym., 2012, 89, 117 CrossRef CAS PubMed.
- Y. Yao, L. Zhao and J. Yang, et al., Biomacromolecules, 2012, 13, 1837 CrossRef CAS PubMed.
- R. Ma and L. Shi, Polym. Chem., 2014, 5, 1503 RSC.
- J. Wu, Z. G. Su and G. H. Ma, Int. J. Pharm., 2006, 315, 1 CrossRef CAS PubMed.
- K. Z. Elwakeel, et al., Chem. Eng. J., 2012, 203, 458 CrossRef CAS.
- X. Zou, X. Zhao and L. Ye, et al., J. Ind. Eng. Chem., 2015, 21, 1389 CrossRef CAS.
- X. Zou, X. Zhao and L. Ye, Chem. Eng. J., 2015, 273, 92 CrossRef CAS.
- J. Wu, W. Wei and L. Y. Wang, et al., Colloids Surf., B, 2008, 63, 164 CrossRef CAS PubMed.
- H. Zhang, S. Mardyani and W. C. W. Chan, Biomacromolecules, 2006, 7, 1568 CrossRef CAS PubMed.
- G. Ma, J. Controlled Release, 2014, 193, 324 CrossRef CAS PubMed.
- W. Wang, S. Chen and L. Zhang, et al., Mater. Sci. Eng., C, 2015, 46, 514 CrossRef CAS PubMed.
- Y. Xu, Y. Du and R. Huang, et al., Biomaterials, 2003, 24, 5015 CrossRef CAS PubMed.
- Z. Lian and L. J. Ye, J. Appl. Polym. Sci., 2013, 128, 3325 CrossRef CAS.
- B. Xiao, X. Wang and Z. Qiu, et al., J. Biomed. Mater. Res., Part A, 2013, 101, 1888 CrossRef PubMed.
- T. Yamamoto and Y. Tezuka, Polym. Chem., 2011, 2, 1930 RSC.
- S. Chatterjee, M. W. Lee and S. H. Woo, Chem. Eng. J., 2009, 155, 254 CrossRef CAS.
- C. H. Zhou, D. Zhang and D. S. Tong, et al., Chem. Eng. J., 2012, 209, 223 CrossRef CAS.
- Y. Song, L. Zhang and W. Gan, et al., Colloids Surf., B, 2011, 83, 313 CrossRef CAS PubMed.
- G. B. Jiang, D. Quan and K. Liao, et al., Mol. Pharmaceutics, 2006, 3, 152 CrossRef CAS PubMed.
- A. Wan, Y. Sun and H. J. Li, J. Appl. Polym. Sci., 2009, 114, 2639 CrossRef CAS.
- O. Zamoume, S. Thibault and G. Regnié, et al., Mater. Sci. Eng., C, 2011, 31, 1352 CrossRef CAS.
- A. Tabak, N. Yilmaz, E. Eren, B. Caglar, B. Afsin and A. Sarihan, Chem. Eng. J., 2011, 174(1), 281 CrossRef CAS.
| This journal is © The Royal Society of Chemistry 2015 |

