
 Open Access Article
 This Open Access Article is licensed under a
 Creative Commons Attribution 3.0 Unported Licence
Centrifugo-thermopneumatic fluid control for valving and aliquoting applied to multiplex real-time PCR on off-the-shelf centrifugal thermocycler†
M. Keller*ab,
S. Wadleab,
N. Paustab,
L. Dreesenb,
C. Nueseb,
O. Strohmeierab,
R. Zengerleabc and
F. von Stettenab
aHahn-Schickard-Gesellschaft für angewandte Forschung e.V., Georges-Koehler-Allee 103, 79110 Freiburg, Germany. E-mail: mark.keller@hahn-schickard.de; Fax: +49 761 203-73299; Tel: +49 761 203-73223
bLaboratory for MEMS Applications, IMTEK – Department of Microsystems Engineering, University of Freiburg, Georges-Koehler-Allee 103, 79110 Freiburg, Germany
cBIOSS – Centre for Biological Signalling Studies, University of Freiburg, Schaenzlestr. 18, 79104 Freiburg, Germany
First published on 15th October 2015
Abstract
We introduce microfluidic automation of geometrically multiplexed real-time PCR to off-the-shelf Rotor-Gene Q thermocyclers (RGQ, QIAGEN GmbH, Hilden, Germany). For centrifugal fluid control the RGQ provides low and constant rotation of 400 rpm, only. Compatibility to this very limited flexibility of centrifugal actuation is achieved by using thermal gas compression and expansion for valving and aliquoting. In contrast to existing thermo-pneumatic actuation, centrifugo-thermopneumatic (CTP) fluid control employs the induced change of partial vapor pressure by global temperature control as actuation parameter for two new unit operations: CTP siphon valving and CTP two-stage aliquoting. CTP siphon valving was demonstrated to reliably transfer sample liquid in all cases (n = 35) and CTP two-step aliquoting transfers metered aliquots of 18.2 ± 1.2 μl (CV 6.7%, n = 8) into reaction cavities within 5 s (n = 24). Thermal characteristics of CTP two-stage aliquoting were found to be in good agreement with an introduced analytical model (R2 = 0.9876, n = 3). A microfluidic disk segment comprising both new unit operations was used for automation of real-time PCR amplification of Escherichia coli DNA. Required primers and probes were pre-stored in the reaction cavities and a comparison with reference reactions in conventional PCR tubes yielded the same PCR efficiency, repeatability, and reproducibility.
Introduction
In the field of nucleic acid amplification testing, real-time polymerase chain reaction (PCR) constitutes the method of choice.1 Real-time PCR thermocyclers, featuring the required temperature cycling and fluorescence signal detection, have evolved to high-precision instruments.2 In order to perform different reactions in parallel, multiple reagents must be manually pipetted (aliquoted) into different reaction tubes in a time-consuming and error-prone workflow. While this workflow may be automated by liquid handling robots, they are costly and especially not affordable at low- to medium-throughput laboratories.To circumvent the problems described for manual PCR preparation several microfluidic solutions based on unit operations for the automation of aliquoting have been presented.3,4 In comparison to single-stage aliquoting, two-stage aliquoting structures5 first meter an introduced sample liquid into sub-volumes, before transferring the aliquots into reaction cavities.4 The approach was demonstrated to have a low risk of cross-contamination between PCR reagents inside different reaction cavities.6 Using two-stage aliquoting, different applications on the centrifugal microfluidic LabDisk platform operated in a modified Rotor-Gene thermocycler (QIAGEN GmbH, Hilden, Germany) were shown.6–9 The custom modification enabled the change in rotational frequency to make use of known valving concepts e.g. centrifugo-pneumatic valves5 in-between metering and transfer of metered aliquots into PCR reaction cavities. In contrast, microfluidic cartridges for off-the-shelf laboratory instruments, termed Microfluidic Apps,10 improve applicability of such microfluidic approaches. To realize a Microfluidic App for the Rotor-Gene and make use of its high-precision performance for real-time PCR without changing the instrument itself, novel valves for the introduction of a sample into an aliquoting structure and transfer of metered aliquots into reaction cavities are required. Such valves have to cope with the low and constant rotation of 400 rpm of the Rotor-Gene. As the majority of passive valves require a change in centrifugal pressure and thus rotational speed, only time-dependent and active valves are considered suitable.4 Timing of valving by dissolving of membranes requires integration of such membranes and a paper strip to guide a propagating auxiliary liquid to them.11 An alternative approach also requires an auxiliary liquid to open air vents inside a clepsydra structure in a timely manner.12 Their space consumption on the cartridge, increased complexity of manufacturing and lack of both pre-storage and release mechanism of the auxiliary liquid are major drawbacks. For active valves, off-the-shelf Rotor-Gene thermocyclers offer global temperature actuation. Though only demonstrated for local temperature application, active valves have been demonstrated to utilize melting of paraffin-wax13,14 or thermo-pneumatic liquid actuation.15–17 Wax valves require additional fabrication steps and may cause union of processed reagents with the wax material. While thermo-pneumatic liquid actuation theoretically holds potential for operation on Rotor-Gene thermocyclers, it still lacks pumping efficiency considering the ratio of the space-consuming air volume and the liquid volume, which may be actuated by the thermally induced ideal gas expansion or contraction. Recently, thermo-pneumatic actuation was demonstrated for the deflection of elastic membranes to open and close fluidic paths, with the major drawback of having a hybrid cartridge assembly and required fabrication steps.18
In contrast, in this work we employ centrifugo-thermopneumatic (CTP) fluid control,19,20 which for the first time utilizes temperature-induced partial vapor pressure change inside an enclosed gas volume for valving and aliquoting. CTP fluid control thereby highly exceeds pumping efficiencies of known thermo-pneumatic actuation on centrifugal microfluidic platforms.15–17 We present an analytical model of CTP fluid control to introduce the functional principle of two novel unit operations: CTP siphon valving for initial sample transfer and CTP two-stage aliquoting for distribution of the transferred sample into multiple reaction cavities. CTP siphon valving for the first time in monolithic thermo-pneumatic liquid actuation features a distinct valving temperature, instead of gradually displacing liquid over the time of temperature change. CTP two-stage aliquoting is utilized for experimental verification of the analytical model and a quantification of its fluidic aliquoting performance is presented. The applicability of the centrifugal microfluidic disk segment “GeneSlice” comprising both CTP unit operations for automation of real-time PCR inside an off-the-shelf Rotor-Gene Q (RGQ) is demonstrated: geometric multiplexing of a DNA sample of the model organism Escherichia coli (E. coli) into eight reaction cavities with pre-stored primers and probes allows comparison with a manual reference (i.e. pipetting in conventional real-time PCR tubes) and determination of key PCR characteristics.
Theory
Workflow for geometrically multiplexed real-time PCR
The GeneSlice automates the depicted workflow for geometrically multiplexed real-time PCR (Fig. 1B) utilizing both known and novel CTP unit operations (Fig. 1B, indicated in blue), which can be partly grouped into the process chain of main-amplification, as recently introduced by Strohmeier et al.4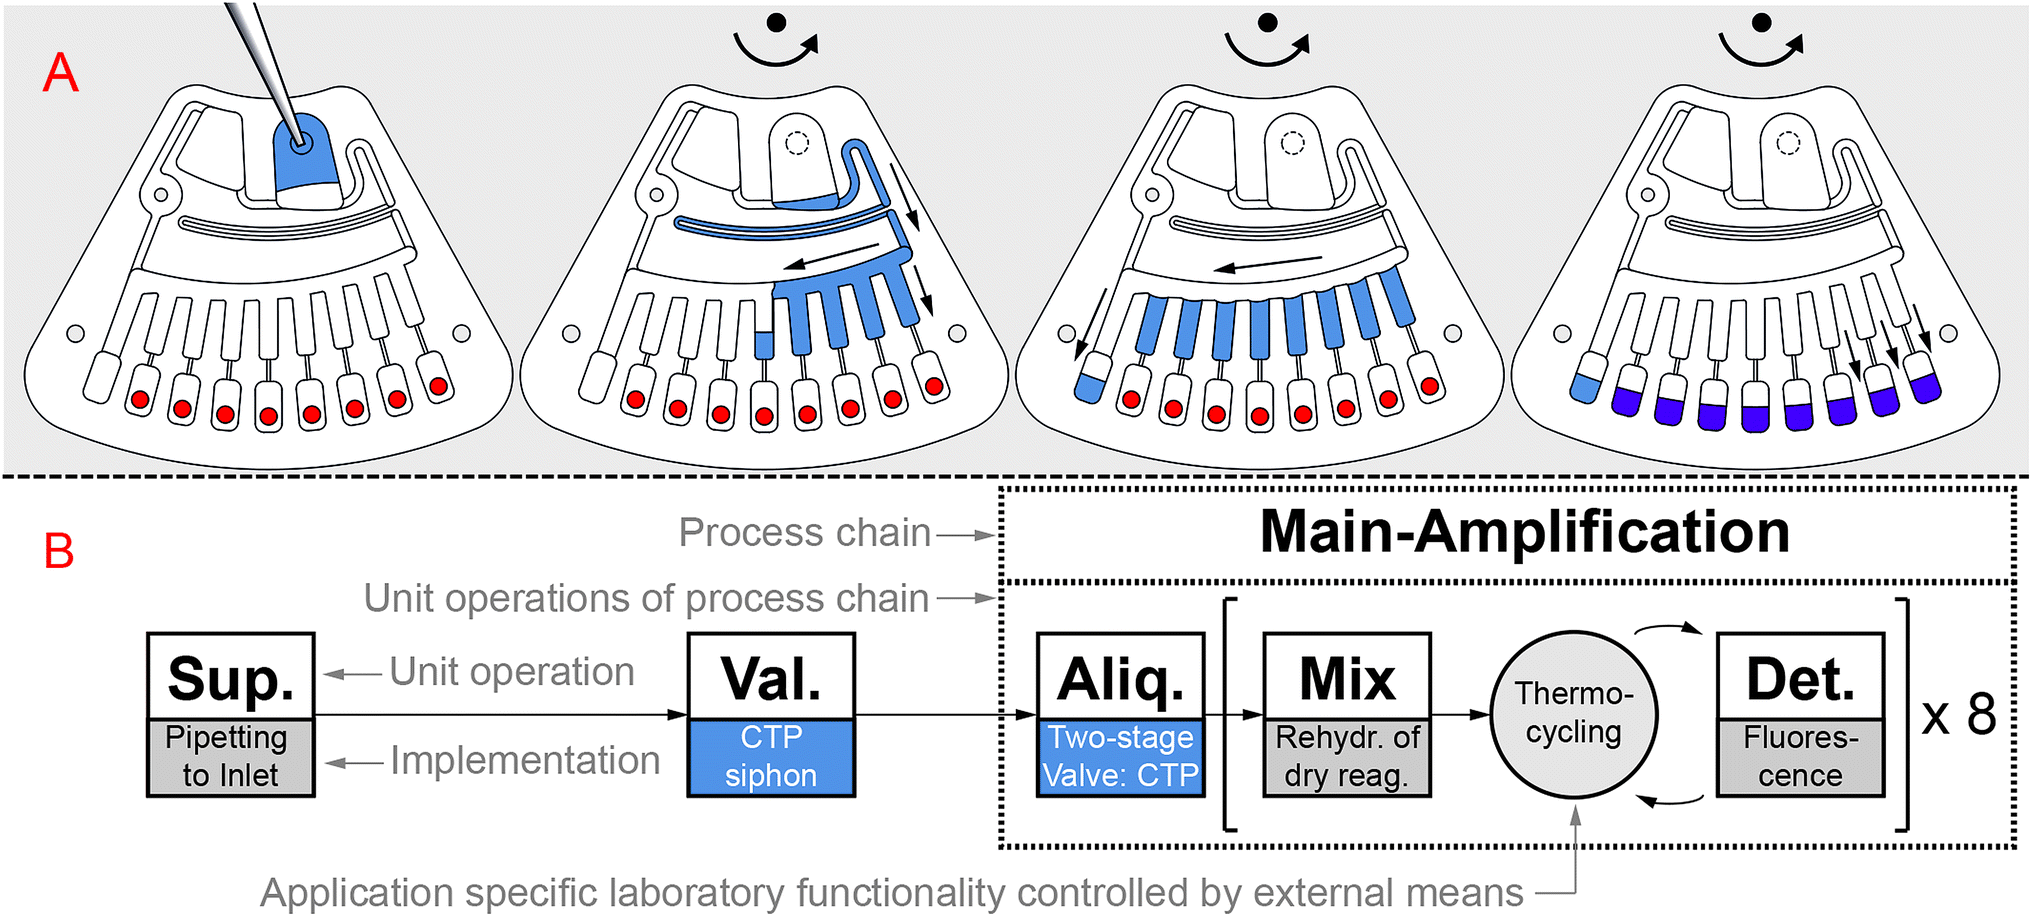 | ||
| Fig. 1 Illustration of workflow for geometrically multiplexed real-time PCR. (A) Sample liquid is supplied to the disk segment “GeneSlice” by pipetting to the sample inlet, which is then sealed. The GeneSlice aliquots the sample liquid into eight reaction cavities with pre-stored primers and probes (red). (B) Schematic representation of microfluidic process (Sup.: sample or reagent supply; Val.: valving; Aliq.: aliquoting; Mix: mixing; Det.: detection).4 The process is driven by novel centrifugo-thermopneumatic (CTP) siphon valving and CTP two-stage aliquoting (blue) to be compatible with the off-the-shelf thermocycler Rotor-Gene Q (QIAGEN, Hilden, Germany). | ||
After supply of a mixture of DNA sample and liquid PCR reagents (Fig. 1A, blue) by pipetting into a sample inlet, CTP siphon valving transfers the mixture into the CTP two-stage aliquoting structure. Here, the mixture is metered into eight sub-volumes and transfer of the metered aliquots into eight reaction cavities takes place. Each reaction cavity comprises a (different) pre-stored set of primers and probes (Fig. 1A, red), which is mixed with the aliquoted volume by rehydration (Fig. 1A, purple). Thermocycling and fluorescence detection are executed for all eight real-time PCRs in parallel.
Principle of centrifugo-thermopneumatic fluid control
We consider a chamber A that is partially filled with liquid and subsequently closed to enclose a gas volume Vg,T0 and a connection channel B to vented downstream structures as illustrated in Fig. 2. Upon global temperature change from T0 to T, a gas volume expansion (or contraction) ΔVg of the enclosed gas volume is induced. As a consequence, a portion ΔVl of the liquid volume Vl in chamber A is displaced into the vented channel B.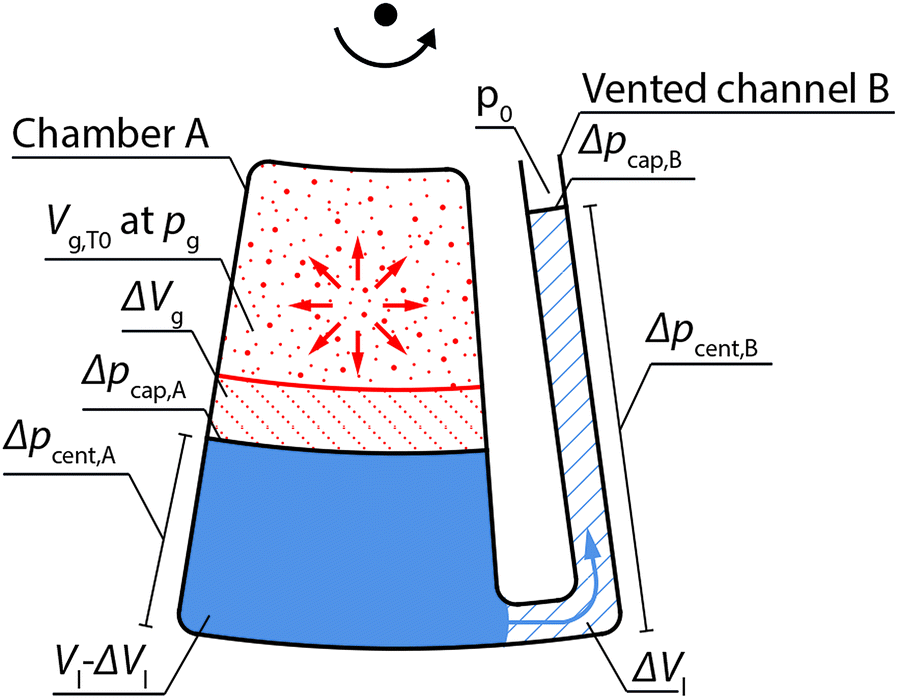 | ||
| Fig. 2 Illustration of centrifugo-thermopneumatic fluid control on a centrifugal microfluidic platform. Depicted is the liquid actuation of a portion ΔVl of a liquid volume Vl from a chamber A to a vented channel B by temperature increase including corresponding gas and liquid volumes and pressures. | ||
At all times during temperature change an equilibrium of pressures in the depicted system of Fig. 2 is given, which can be described as follows,
| pg + Δpcap,A + Δpcent,A = Δpcent,B + Δpcap,B + p0 | (1) |
 | (2) |
 | (3) |
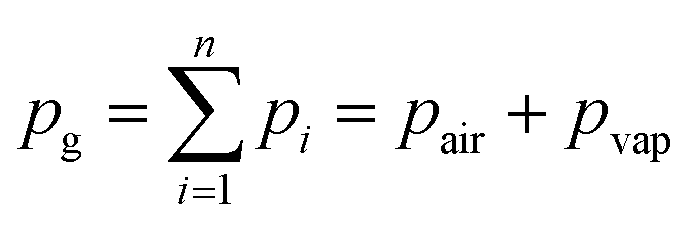
As the chemical species of each partial pressure takes up the entire enclosed gas volume and the amount n of air molecules, which is enclosed at the initial temperature T0 remains constant throughout the temperature change to T, the volume expansion/contraction from Vg,T0 to Vg,T can be described using the ideal gas law,
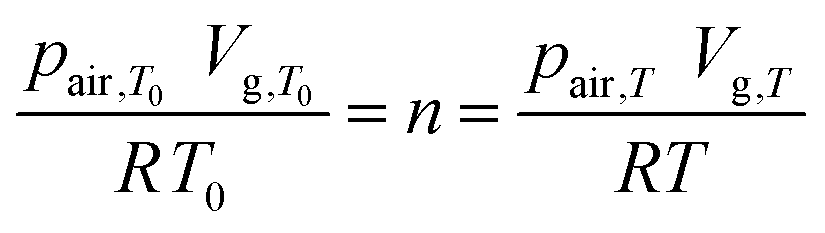 | (4) |
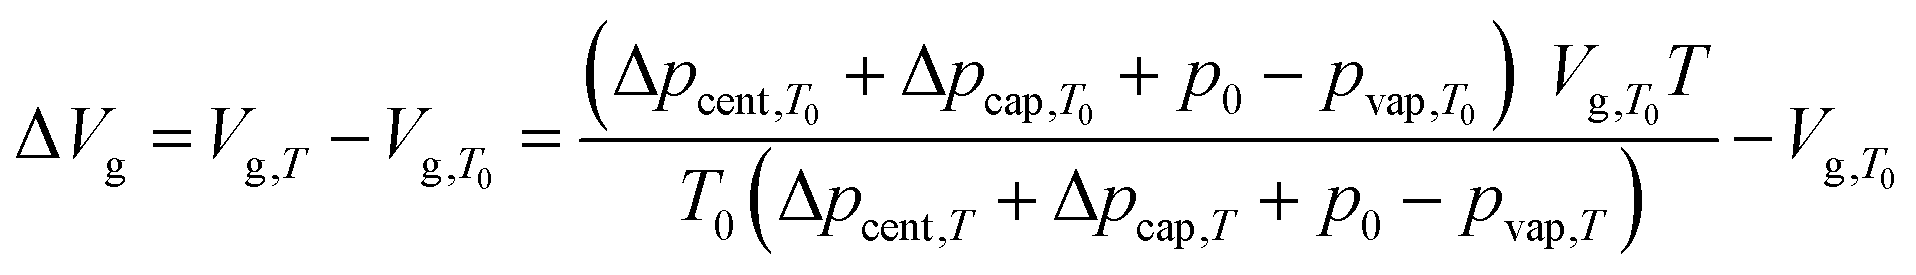 | (5) |
Centrifugo-thermopneumatic siphon valving
The CTP siphon valve (Fig. 3) consists of an inlet chamber comprising a sample inlet and two branching channels, the left one connected to a vented volume buffer and the right one constituting an overflow siphon. The overflow siphon is attached to the downstream CTP two-stage aliquoting structure (via a fluidic resistance). First, the sample volume Vl is inserted into the sample inlet, which is sealed gas-tight afterwards (Fig. 3A). Upon constant rotation, a gas volume Vg,TRT is enclosed in the inlet chamber (Fig. 3B) at room temperature TRT. With temperature increase, this gas volume Vg,T expands with the temperature T as described by eqn (5). The analytical description of the gas volume expansion for CTP siphon valving in this work can be simplified, since due to the low rotational speed of 400 rpm and the fluidic properties of the used reagents, the influence of centrifugal and capillary pressures on the gas volume can be neglected (cf. ESI S1† including discussion on the influence of temperature on fluidic properties). Thus, when neglecting capillary and centrifugal pressures for gas volume expansion, the total gas pressure pg can be assumed equal to the atmospheric pressure p0 at all times (eqn (1)), which reduces eqn (5) to
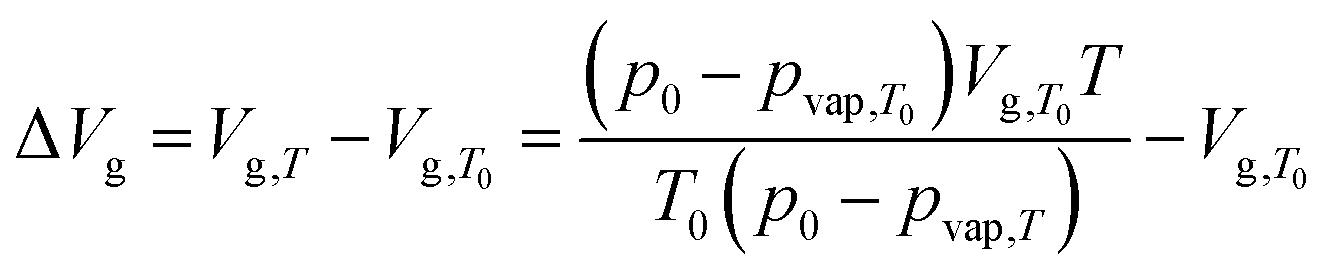 | (6) |
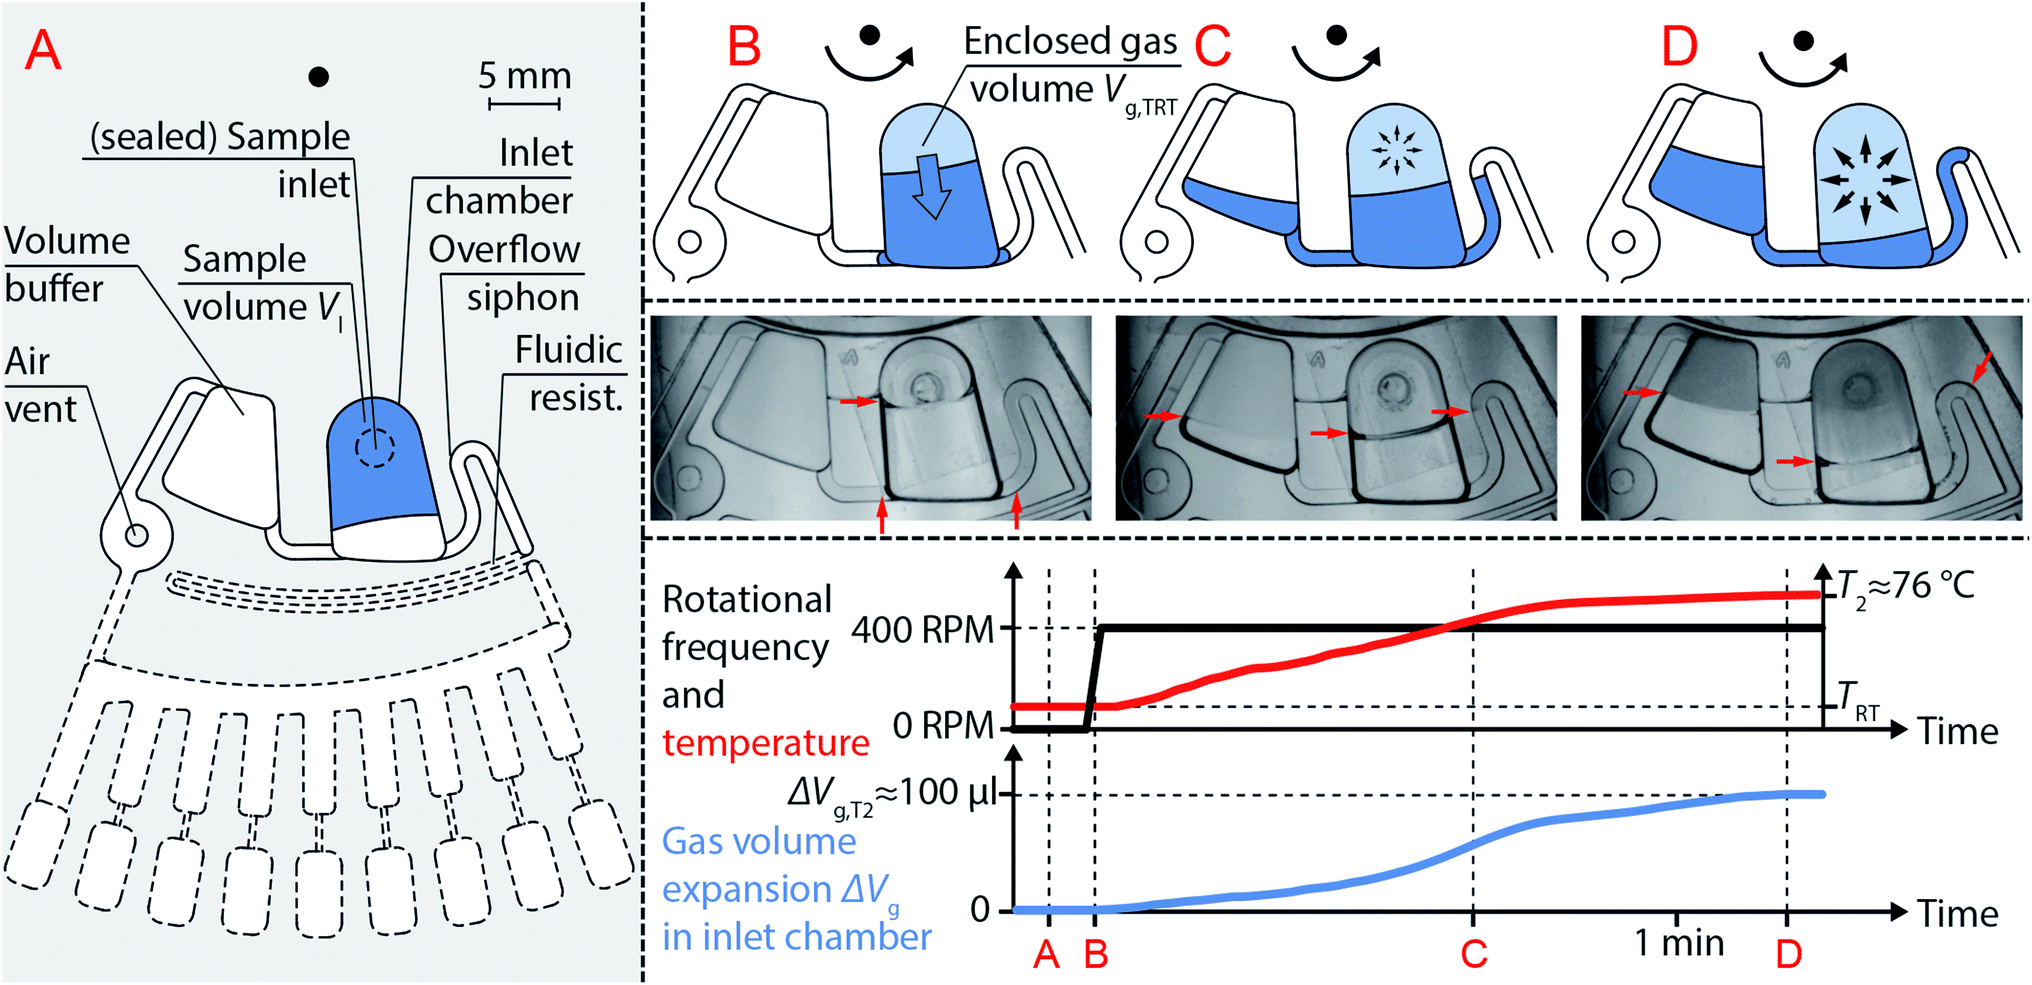 | ||
| Fig. 3 Functional principle of centrifugo-thermopneumatic (CTP) siphon valve. (A) CTP siphon valve comprising an inlet chamber with a branching volume buffer and a branching overflow siphon. The inlet chamber is filled with a sample volume Vl using the sample inlet, which is then sealed gas-tight. (B) Liquid is propelled radially outwards by constant rotation at 400 rpm, which encloses a gas volume Vg,TRT. (C) Temperature increase from TRT to T2 results in gas volume expansion according to eqn (6), which displaces a portion ΔVl of the sample volume into both branching structures with identical radial positions of the menisci. (D) At a critical displaced volume portion, the overflow siphon crest is reached, and the entire sample volume is propelled radially outwards into a downstream CTP two-stage aliquoting structure by centrifugal forces. Liquid menisci are visualized with red arrows. Rotational frequency, temperature and gas volume expansion at each depicted stage (A–D) are plotted over time. Quantitative values in the plots are given for the microfluidic cartridge detailed in the “design and fabrication” section. | ||
In this case, the displaced portion ΔVl of sample volume equals the gas volume expansion ΔVg at all times, and liquid is displaced into the volume buffer and overflow siphon channel (Fig. 3C). Although neglected as influence on the gas volume expansion, centrifugal pressures ensure identical radial positions of the menisci inside the volume buffer and overflow siphon channel. At a temperature T2 the filling heights reach the siphon crest and downstream transfer of the entire sample volume by centrifugal forces is triggered. First, the volume buffer is emptied, as the enclosed gas volume inside the inlet chamber still holds back the liquid. Eventually, the enclosed gas volume is vented, which allows complete draining of the remaining liquid from the inlet chamber into the downstream CTP two-stage aliquoting structure.
Centrifugo-thermopneumatic two-stage aliquoting
CTP two-stage aliquoting (Fig. 4A) meters the sample into sub-volumes at elevated temperature Tmax and subsequently transfers the metered aliquots into reaction cavities, both at constant rotational speed. For this, the sample from the upstream CTP siphon valve enters a feeding channel, which centrifugally routes the liquid into metering fingers. Each metering finger serves as an overflow vessel guiding excess liquid downstream into the adjacent metering finger and eventually into a waste. As surface tension of the liquid decreases with temperature increase, metering accuracy is improved by the elevated temperature. At the radial outlet of each metering finger a dead-end reaction cavity is connected via a narrow 180 × 400 μm connection channel. The filling of a metering finger leads to enclosure of a gas volume Vg,Tmax inside the connected reaction cavity. Liquid does not enter the reaction cavities during metering but flow comes to a stop at the equilibrium of pressures inside and outside the enclosed gas volume, which can be described analog to eqn (1) as follows,| pg + Δpcap,A = Δpcent,B + Δpcap,B + p0 | (7) |
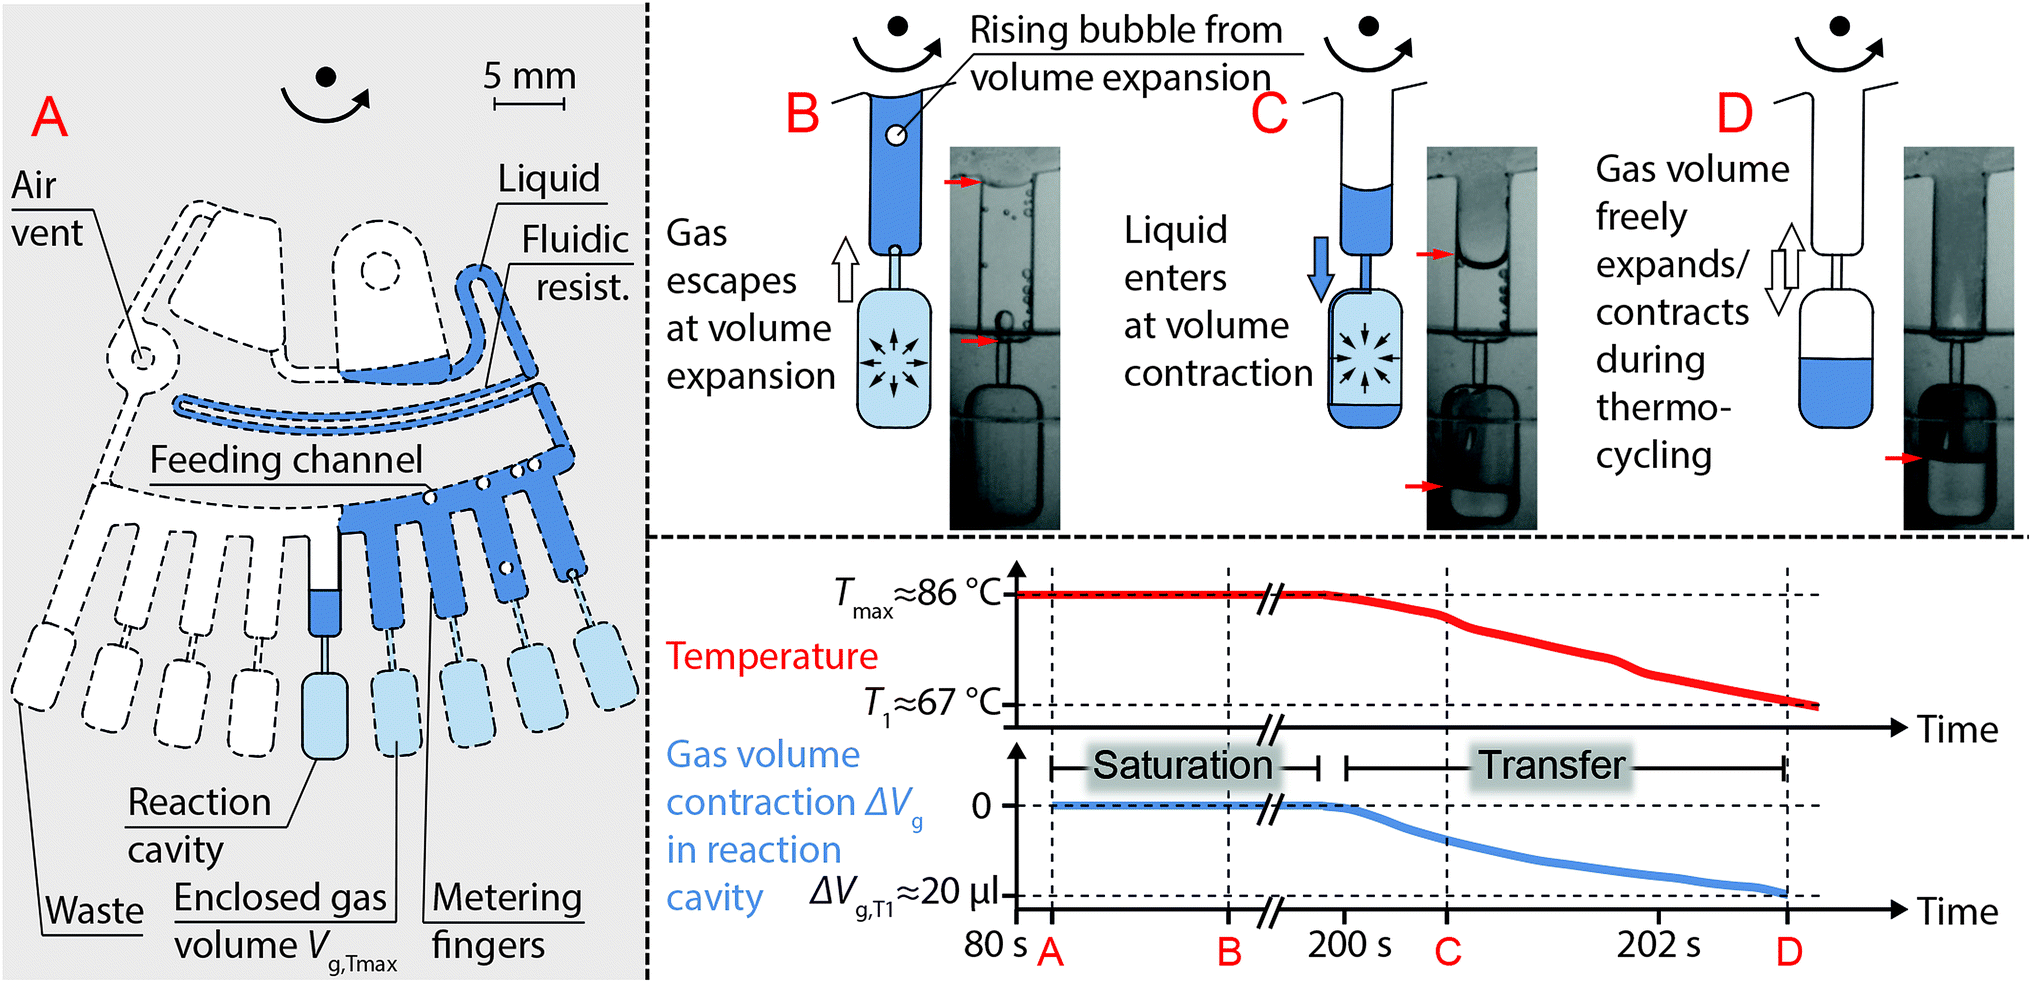 | ||
| Fig. 4 Functional principle of centrifugo-thermopneumatic (CTP) two-stage aliquoting. (A) CTP two-stage aliquoting comprises a feeding channel with metering fingers, which are connected to dead-end reaction cavities via narrow channels. During metering gas volumes Vg,Tmax inside each reaction cavity are enclosed. (B) Due to saturation of the gas volumes inside the reaction cavities with partial vapor pressure, bubbles are formed and escape through the metering fingers. (C) Temperature decrease from Tmax to T1 contracts the gas volume according to eqn (6), which aspirates liquid from the metering fingers into the reaction cavities. (D) Once the entire aliquot is transferred, the gas volume is vented again and is free to expand and contract during subsequent thermocycling for PCR. Liquid menisci are marked with red arrows. Temperature and gas volume contraction at each depicted stage (A–D) are plotted over time. The entire operation takes place at constant rotational speed of 400 rpm. Quantitative values in the plots are given for the microfluidic cartridge detailed in the “design and fabrication” section. | ||
After completion of metering and saturation of the enclosed gas volumes, temperature is decreased from Tmax to T1 to contract the enclosed gas volume Vg,T as described by eqn (6) (T0 = Tmax). The volume contraction ΔVg results in aspiration of an equal portion ΔVl of the aliquot from the metering finger into the reaction cavity (Fig. 4C). Within one cool down step (given a sufficient ΔVg for ΔVl), the metering fingers are eventually emptied and the initially enclosed gas volumes inside the reaction cavities are vented again. Ventilation allows free gas volume expansion and contraction without liquid actuation during subsequent thermocycling for PCR (Fig. 4D).
Materials and methods
Microfluidic cartridge design and fabrication
A microfluidic cartridge comprising a CTP siphon valve for 180 μl of sample volume to be transferred at up to Tmax = 90 °C and a CTP two-stage aliquoting structure for eight 20 μl-aliquots with an excess waste volume was designed in SolidWorks 2011 (Dassault Systèmes SolidWorks, Waltham, MA, USA, Fig. 5A). The microfluidic cartridge, a disk segment “GeneSlice” of our LabDisk platform, was manufactured in-house by the Hahn-Schickard Lab-on-a-Chip Design + Foundry Service (www.hahn-schickard.de/en/manufacturing/lab-on-a-chip-design-foundry-service) using a μTSL replication process.21 The micro-thermoformed foil cartridges were sealed applying pressure-sensitive adhesive polyolefin foil (#900 320, HJ-Bioanalytik, Erkelenz, Germany), which included laser-cut (PLS3.60, Universal Laser Systems, Scottsdale, AZ, USA) air vents (Fig. 4A). For real-time PCR experiments, a mixture of primers (10 μM) and probes (5 μM, together 0.8 μl) with trehalose as stabilizer22 (0.1 M, 1 μl) was pre-stored by pipetting and air drying into all eight reaction cavities of each GeneSlice prior to sealing (cf. ESI Table S1† for sequences). Those GeneSlices were stored in aluminum barrier film flat bags (A 20T, Long Life for Art, Eichstetten, Germany) with silica gel desiccants (#610.002, ThoMar, Luetau, Germany) under nitrogen atmosphere until execution of experiments.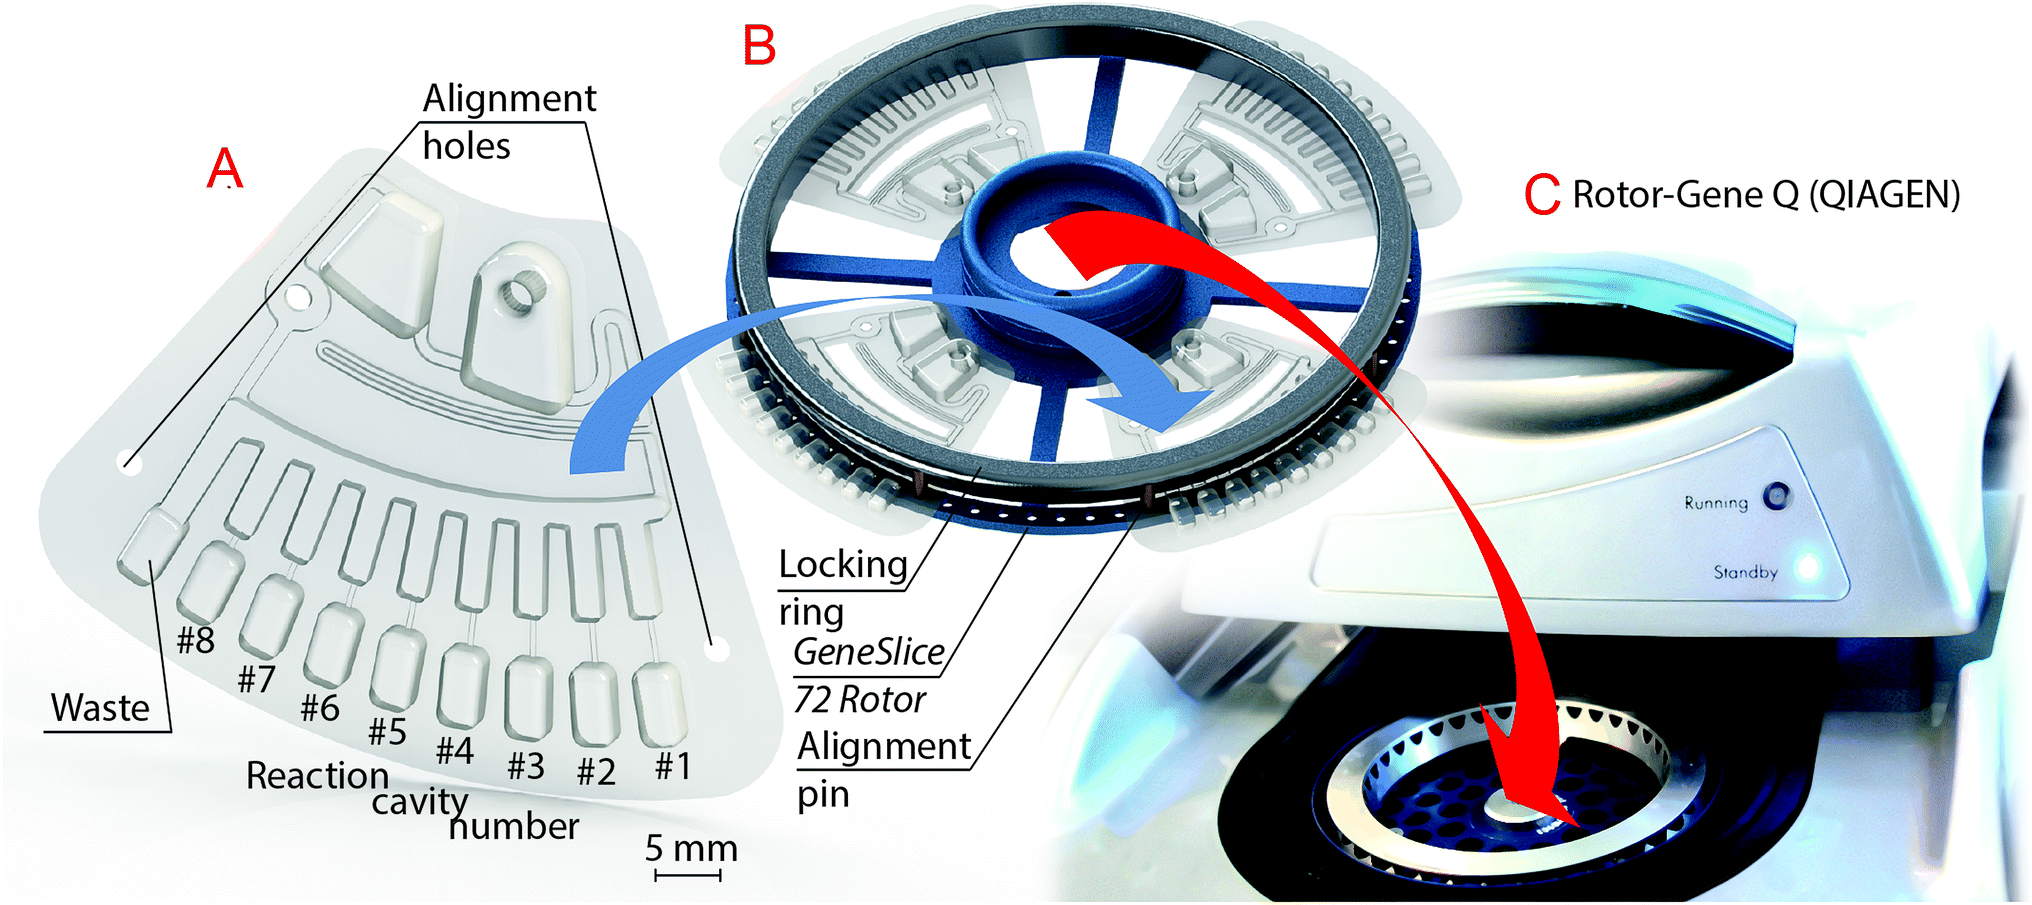 | ||
| Fig. 5 Workflow of insertion of microfluidic disk segment “GeneSlice” into an off-the-shelf Rotor-Gene Q (RGQ, QIAGEN GmbH, Hilden, Germany). (A) Overview of GeneSlice. (B) Custom GeneSlice 72 Rotor, which holds up to four GeneSlices. Alignment pins are provided by the GeneSlice 72 Rotor for precise alignment of the GeneSlice reaction cavities to the fluorescence detector inside the RGQ. GeneSlices are hold into place during processing by a locking ring. (C) Depiction of its insertion into an RGQ instead of the depicted standard tube rotor. | ||
Experimental setup
GeneSlices were placed in a custom rotor holder (GeneSlice 72 Rotor, Hahn-Schickard, Freiburg, Germany, Fig. 5B) that can be inserted into an off-the-shelf RGQ similar to standard tube rotors (Fig. 5C), allowing a maximum of 72 reaction cavities by its spacing. The reaction cavities of the GeneSlices are aligned to the fluorescence detector inside the RGQ by two laser-cut alignment holes in each GeneSlice and corresponding alignment pins on the GeneSlice 72 Rotor (Fig. 5B). The GeneSlice 72 Rotor can hold up to four GeneSlices to be processed in parallel within the same run, each processing an individual sample.For fluidic experiments, the sample volume of 180 μl consisted of a one-to-one mixture of PCR master mix (2x QuantiFast Probe (ROX), QIAGEN) and PCR-grade water (no-template control, NTC). In real-time PCR experiments for detection of E. coli, the PCR-grade water was partly substituted by 9 μl of genomic DNA (E. coli, O157:H7) dissolved in Nucleic Acid Dilution Buffer (both provided by QIAGEN). After sample insertion by pipetting, the sample inlet was sealed gas-tight with an adhesive tape (#95.1994, Sarstedt, Nuembrecht, Germany).6 The regular RGQ Series Software (version 2.1.0 build 9, QIAGEN) was used for programming all required temperature steps using the “hold at temperature” function: both temperatures (90 and 30 °C) are set each to be hold for 3 min to allow complete metering of liquids, saturation of the gas volumes inside the reaction cavities and transfer of aliquots into the reaction cavities. Subsequent thermocycling for real-time PCR is seamlessly executed within the same thermal protocol (for real-time PCR experiments only).
For fluidic development and characterization as well as thermal characterization of CTP two-stage aliquoting, a test site, termed strobe RGQ (BioFluidix, Freiburg, Germany), was utilized (cf. ESI Video S1†). The strobe RGQ allows stroboscopic stationary image acquisition of rotating GeneSlices at arbitrary azimuthal positions inside an RGQ.20 It was tested to have a similar heating and cooling behavior of an off-the-shelf RGQ. Acquired stroboscopic images were post-processed by measuring filling heights of liquids using ImageJ (National Institutes of Health, Bethesda, MD, USA). Measured values were fed into the CAD of SolidWorks to compute gas and liquid volumes.
Thermal and fluidic characterization of centrifugo-thermopneumatic two-stage aliquoting
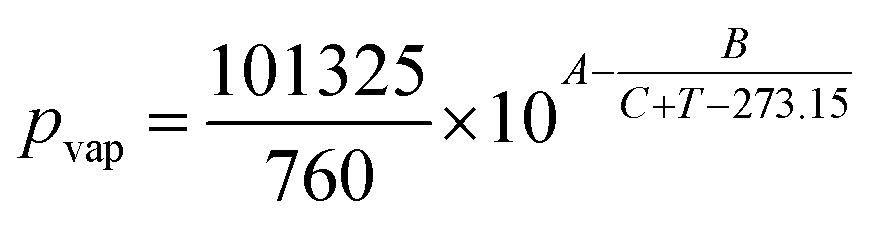
To characterize the gas volume contraction inside the reaction cavities of the CTP two-stage aliquoting structure, three GeneSlices in individual runs were processed according to the experimental setup inside the strobe RGQ. Simultaneous to the image acquisition, the temperature of the gas phase inside reaction cavity #5 (Fig. 5A) of an additional GeneSlice was measured. For this, the additional GeneSlice was located on the opposite side of the GeneSlice 72 Rotor and thermocouples of a rotary temperature measurement system (TMS)23 were inserted (cf. ESI Fig. S1† for positions of the thermocouples). The acquired temperature data was used to calculate a theoretical thermal volume contraction over time using eqn (6) (p0 = 98![[thin space (1/6-em)]](https://www.rsc.org/images/entities/char_2009.gif) 360 Pa, A = 8.07131, B = 1730.63, C = 233.426, all for aqueous liquids, and Tmax = measured temperature at the beginning of liquid transfer). The reaction cavity volume Vg,Tmax was designed to 39.0 μl, based on a robustness analysis using the analytical model (cf. ESI S3†). For model verification, the gas volume during temperature decrease of reaction cavity #8 (Fig. 5A) of each GeneSlice was experimentally determined based on the liquid volume transferred and the total reaction cavity gas volume Vg,Tmax. The possibility for additional model verification using the gas volume expansion during CTP siphon valving is described and evaluated in ESI S4.† In addition, the transfer times of all eight aliquots per GeneSlice were determined using the time stamp of the stationary stroboscopic images.
360 Pa, A = 8.07131, B = 1730.63, C = 233.426, all for aqueous liquids, and Tmax = measured temperature at the beginning of liquid transfer). The reaction cavity volume Vg,Tmax was designed to 39.0 μl, based on a robustness analysis using the analytical model (cf. ESI S3†). For model verification, the gas volume during temperature decrease of reaction cavity #8 (Fig. 5A) of each GeneSlice was experimentally determined based on the liquid volume transferred and the total reaction cavity gas volume Vg,Tmax. The possibility for additional model verification using the gas volume expansion during CTP siphon valving is described and evaluated in ESI S4.† In addition, the transfer times of all eight aliquots per GeneSlice were determined using the time stamp of the stationary stroboscopic images.
The fluidic aliquoting performance of the GeneSlice, as an important characteristic for geometrically multiplexed real-time PCR, was quantified by processing one GeneSlice per run inside an off-the-shelf RGQ according to the experimental setup. Subsequent image acquisition of such processed GeneSlices was performed at 400 rpm on a stroboscopic spin-stand, similar to,24 and post-processed according to experimental setup. A total of eight runs were conducted resulting in 64 (8 × 8) quantified aliquots. Prior to the examination, the same method was used to find an appropriate fluidic resistance in-between the CTP siphon valve and CTP two-stage aliquoting structure (cf. ESI S5†).
Real-time PCR experiments
The applicability of CTP fluid control for automation of real-time PCR was examined by comparing real-time PCR results from GeneSlices and manual reference experiments in standard strip tubes (#981103, QIAGEN) with accordingly pre-stored primers and probes (cf. Microfluidic cartridge design and fabrication). Analog to the reaction cavities of GeneSlices in their GeneSlice 72 Rotor, tubes were arranged in groups of nine at same positions in a standard 72-well rotor (#9018903, QIAGEN), with the ninth tube simulating the thermal mass of the waste of a GeneSlice, both without primers and probes. Tubes for reference were manually filled with 20 μl from the real-time PCR reagents by manual pipetting. Two experimental series were conducted, (I) with a constant DNA concentration of 1000 copies in all GeneSlice reaction cavities/tubes and (II) with a dilution series with 0 (NTC), 10, 30, 100, 300, and 1000 copies in all GeneSlice reaction cavities/tubes. Each experimental series was carried out three times and four GeneSlices were included in each run. For the experimental series (II), one GeneSlice per run was reserved for the NTC reaction. The five DNA dilutions were allocated to the remaining six GeneSlices of two runs. The 1000 copies per reaction cavity (tube) dilution was analyzed in both runs and served as inter-run calibrator to combine results of both runs into a joint standard curve. The temperature protocol for real-time PCR, directly executed within the same run after the fluidic processing, consisted of 3 min at 95 °C for polymerase hot start followed by 40 cycles of 20 s at 95 °C and 25 s at 60 °C with subsequent fluorescence readout (FAM and ROX, the latter as passive reference dye). Real-time PCR data was post-processed according to ESI S6† to obtain quantification cycle (Cq) values. Raw fluorescence signals also served as failure alert mechanism to indicate reaction cavities, which may not have been filled with liquid.Results and discussion
Thermal and fluidic characterization of centrifugo-thermopneumatic two-stage aliquoting
The determined gas volumes inside the reaction cavities during cool down are compared with calculations in Fig. 6. Each calculation is carried out with the exact starting temperature at the point of gas volume enclosure inside the reaction cavity. This yields individual gas contraction curves for each reaction cavity, as exemplarily depicted for one GeneSlice in Fig. 6A. A comparison of calculation and all three measurements is depicted in Fig. 6B and shows to be in good agreement (R2 = 0.9876). The remaining deviation between calculation and measurement is likely to be caused by inaccuracies of volume determination and slight temporal shifts between image acquisition and temperature measurement.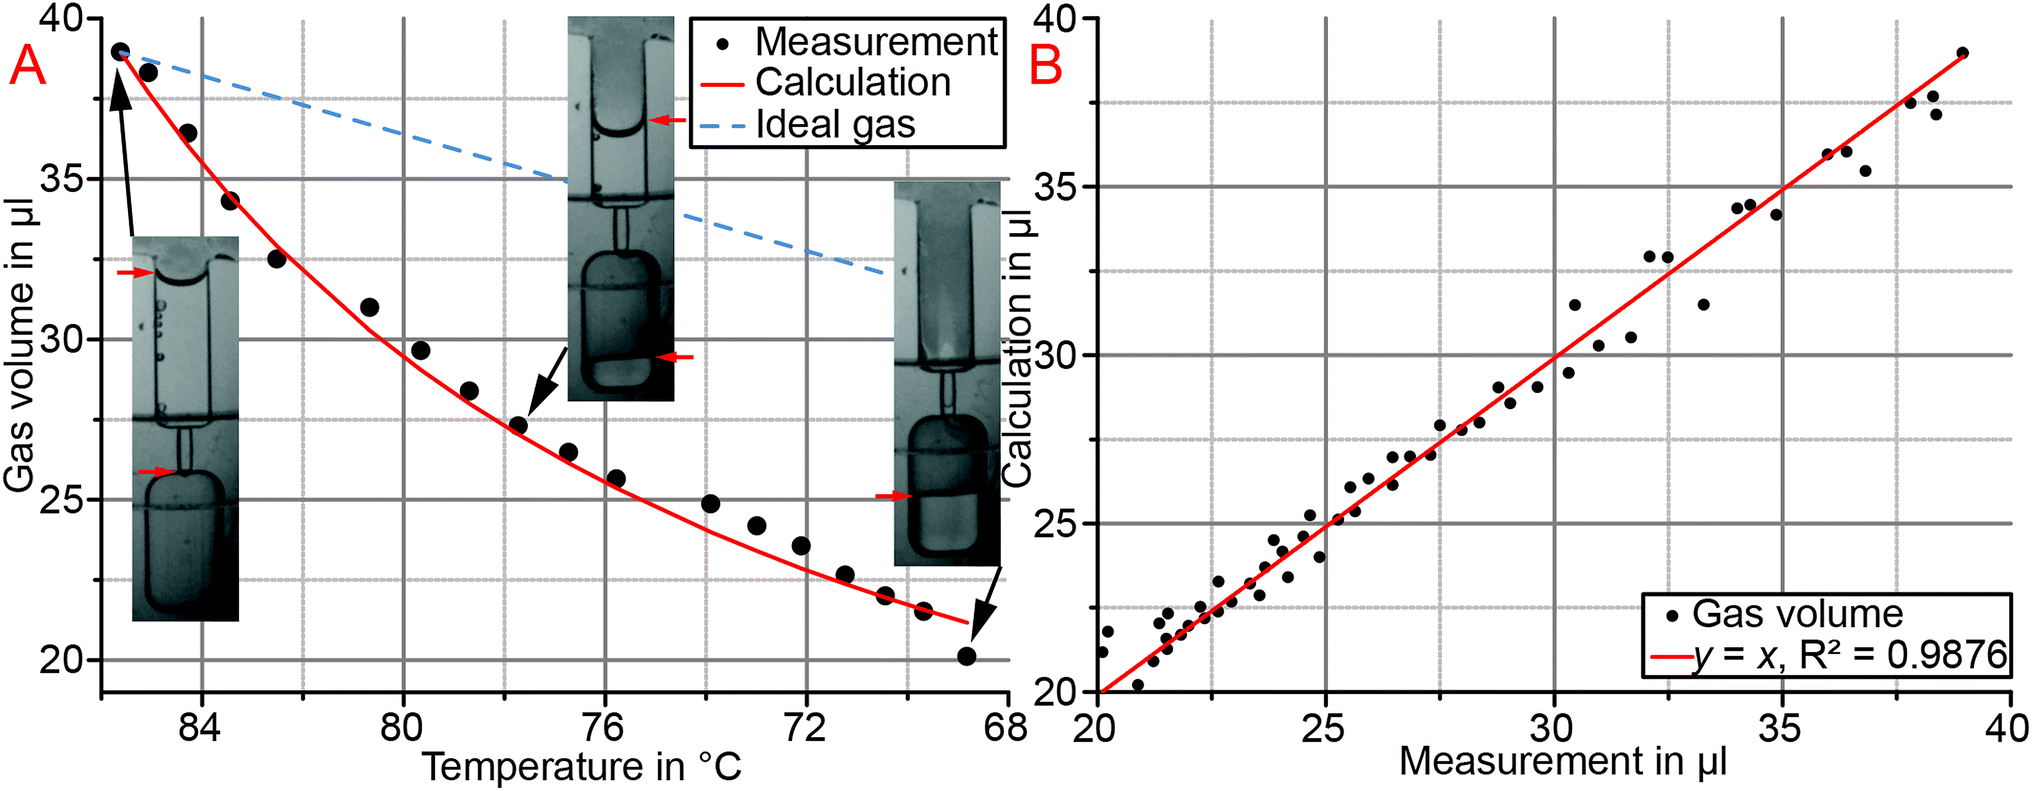 | ||
| Fig. 6 Characterization of gas volume contraction in reaction cavities during cool down for centrifugo-thermopneumatic (CTP) two-stage aliquoting. (A) Comparison of calculated and measured volume contraction inside a single reaction cavity over temperature decrease. Additional depiction of three corresponding stroboscopic images (red arrows illustrate liquid menisci). The dashed line (blue) compares CTP fluid control with ideal air volume contraction to illustrate the dominance of partial vapor pressure. (B) Comparison of calculated and measured gas volume contraction for all measurements (n = 3). | ||
The comparison of ideal air volume contraction with gas volume contraction of CTP fluid control, which includes a change in partial vapor pressure, shows that the change in partial vapor pressure is clearly dominating (Fig. 6A). Consequently the highly increased pumping efficiency of CTP fluid control allows smaller changes in temperature or smaller, space-efficient gas volumes, respectively, to actuate equal liquid volumes as by known thermo-pneumatic approaches.15–17 CTP fluid control thus renders compatible with global temperature actuation by ensuring temperatures to stay within safe ranges for common PCR reagents.
The transfer times of metered aliquots into their reaction cavities were measured to be 3.8 ± 0.7 s and below five seconds in all cases (n = 24). Thus, the hold time of 3 min at 30 °C for CTP two-stage aliquoting may be drastically reduced.
Quantification of aliquoted volumes resulted in a mean volume of 18.2 μl with an inter-GeneSlice coefficient of variation (CV, standard deviation divided by mean) of 5.5% and mean intra-GeneSlice CV of 4.2 ± 1.8%. The determined mean aliquoted volume remains below the nominal volume of 20 μl, which is caused by minor liquid transfer from one metering finger to the downstream adjacent one and finally into the waste during the saturation phase (Fig. 4B). Due to the low CV values, it is assumed that the mean aliquoted volume can be increased to the nominal volume by increasing the volume of the metering fingers in the cartridge design if required by the application.
Real-time PCR experiments
The experimental series (I) was conducted to determine variations in the quantification cycle (Cq) values obtained from GeneSlices and reference reactions in conventional PCR tubes. Corresponding CV values are stated in Table 1 and are a measure of repeatability within one GeneSlice and run (intra-GeneSlice and intra-run CV, respectively) and of reproducibility of several runs (inter-run CV). In case of the reference reactions, “GeneSlice” was defined as the group of nine tubes, which were located at the same positions in the rotor. Both, repeatability and reproducibility of the GeneSlice are similar or superior to the reference.| Quantification cycle (Cq) value | GeneSlice | Reference |
|---|---|---|
| Mean [cycles] | 26.9 | 26.9 |
| Mean intra-GeneSlice CV [%] | 0.5 ± 0.2 | 0.7 ± 1.5 |
| Mean intra-run CV [%] | 0.3 ± 0.2 | 0.5 ± 0.7 |
| Inter-run CV [%] | 0.5 | 0.5 |
In experimental series (II), all NTCs, both in reference and GeneSlices, stayed below threshold and were thus valid. Results from 10 copies per reaction from both systems were excluded from further post-processing due to Cq value variations. The PCR efficiency was determined to 76.2 ± 1.3 and 74.5 ± 1.7% for reference and GeneSlice, respectively, and the corresponding standard curves are depicted in Fig. 7.
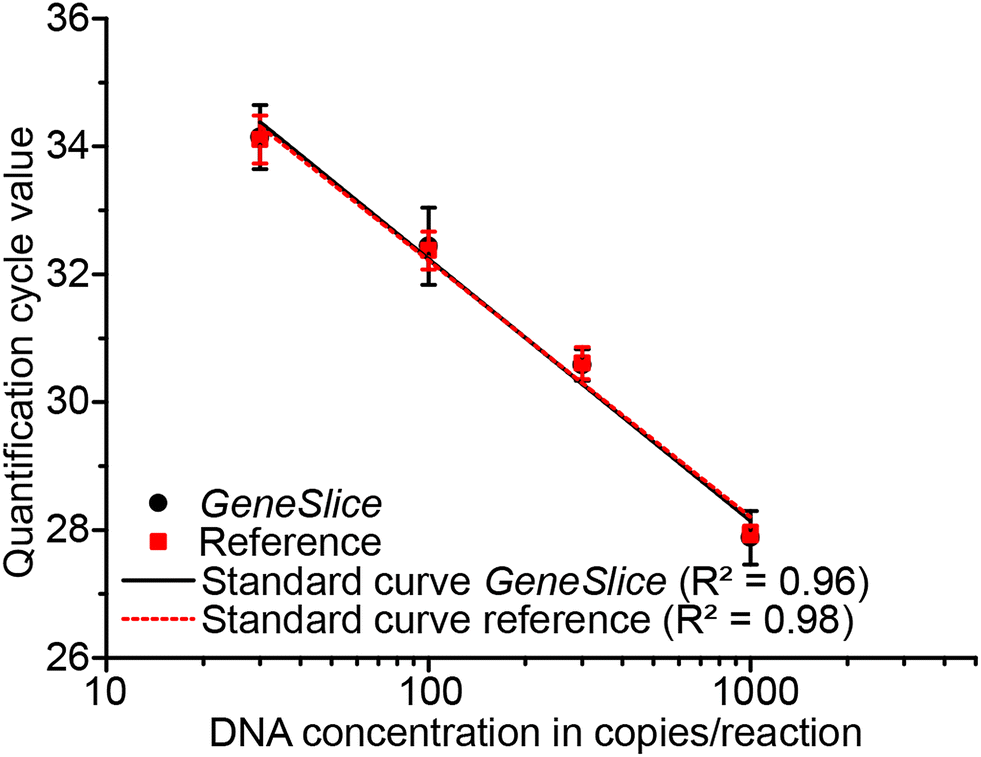 | ||
| Fig. 7 Mean quantification cycle (Cq) values obtained from real-time PCR with 30, 100, 300, and 1000 copies per reaction in GeneSlices and reference reactions in conventional PCR tubes with corresponding standard deviations. | ||
Relative comparison of the PCR efficiencies obtained from experimental series (II) show that similar PCR performance may be expected from GeneSlices as from the reference in tubes, though the absolute efficiencies remain low for both systems, which may be caused by the assay design. Investigation of the raw fluorescence signals showed that CTP siphon valving and subsequent CTP two-stage aliquoting worked in all cases (n = 24) and demonstrated its value as failure alert mechanism.
Conclusion and outlook
The functionality of CTP siphon valving and CTP two-stage aliquoting was successfully modeled by an analytical description of CTP fluid control. Experimental data of CTP two-stage aliquoting was demonstrated to be in good agreement with the analytical model, also demonstrating the advantageous dominance of partial vapor pressure change. Transfer times for aliquots into their reaction cavities were demonstrated to be below five seconds, which allows reduction in processing time in the future. Aliquoting results showed low CV values and proved sufficient for the demonstrated real-time PCR experiments. The applicability of CTP siphon valving and CTP two-stage aliquoting to real-time PCR was demonstrated by geometric multiplexing E. coli DNA into eight reaction cavities with pre-stored primers and probes. Here, similar performance parameters for GeneSlices and manual reference were achieved. CTP fluid control constitutes a space-efficient, well-modelled and easy to implement method for centrifugal microfluidic platforms to be operated at constant rotational frequency. Liquid is controlled by global temperatures, which stay within safe ranges for common PCR reagents at all times. The distinct valving temperature, similar to centrifugal burst pressure of passive valves, may allow to carry out biochemical reactions prior to valving: by using a crude lysis and subsequent direct DNA amplification, sample-to-answer nucleic acid testing in the presented GeneSlice may be realized. Alternatively, temperature-enhanced rehydration of lyophilized PCR reagents may take place prior to valving, which allows users to introduce pure DNA samples. Both approaches may increase the level of integration in the future. The demonstrated GeneSlice constitutes a powerful Microfluidic App for automation of geometrically multiplexed real-time PCR in an off-the-shelf Rotor-Gene Q. Since the RGQ may already be present at various laboratories, panel testing e.g. for infectious diseases, genotyping of KRAS point mutations8 or MRSA6 may now be implemented at such laboratories at no initial investments. In combination with the GeneSlice for nested PCR,20 allowing sensitive DNA detection in the fields of forensic science and food analysis, these Microfluidic Apps may bring automation of a variety of applications to a broad group of RGQ users.Acknowledgements
This work was financially supported from the German Federal Ministry of Education and Research (BMBF) as part of the initiative “MicroMountains Applications – Applikationszentren der Mikrosystemtechnik” (16SV3593). We thank Dr Ralf Himmelreich (formerly QIAGEN, now Fraunhofer ICT-IMM), Markus Jeziorski (formerly QIAGEN, now F. Hoffmann-La Roche), Dr Andy Wende (QIAGEN), Dr Maximilian Focke (formerly IMTEK, now QIAGEN) and Dr Günter Roth (University Freiburg) for helpful discussion, scientific advice and providing PCR reagents.References
- M. G. Roper, C. J. Easley and J. P. Landers, Anal. Chem., 2005, 77, 3887–3894 CrossRef CAS PubMed.
- H. D. de Paz, P. Brotons and C. Muñoz-Almagro, Expert Rev. Mol. Diagn., 2014, 14, 827–843 CrossRef CAS PubMed.
- R. Gorkin, J. Park, J. Siegrist, M. Amasia, B. S. Lee, J.-M. Park, J. Kim, H. Kim, M. Madou and Y.-K. Cho, Lab Chip, 2010, 10, 1758–1773 RSC.
- O. Strohmeier, M. Keller, F. Schwemmer, S. Zehnle, D. Mark, F. von Stetten, R. Zengerle and N. Paust, Chem. Soc. Rev., 2015, 44, 6187–6229 RSC.
- D. Mark, T. Metz, S. Haeberle, S. Lutz, J. Ducrée, R. Zengerle and F. von Stetten, Lab Chip, 2009, 9, 3599–3603 RSC.
- M. Focke, F. Stumpf, B. Faltin, P. Reith, D. Bamarni, S. Wadle, C. Müller, H. Reinecke, J. Schrenzel, P. Francois, D. Mark, G. Roth, R. Zengerle and F. von Stetten, Lab Chip, 2010, 10, 2519–2526 RSC.
- M. Focke, F. Stumpf, G. Roth, R. Zengerle and F. von Stetten, Lab Chip, 2010, 10, 3210–3212 RSC.
- O. Strohmeier, S. Laßmann, B. Riedel, D. Mark, G. Roth, M. Werner, R. Zengerle and F. von Stetten, Microchim. Acta, 2014, 181, 1681–1688 CrossRef CAS.
- O. Strohmeier, N. Marquart, D. Mark, G. Roth, R. Zengerle and F. von Stetten, Anal. Methods, 2014, 6, 2038–2046 RSC.
- D. Mark, F. von Stetten and R. Zengerle, Lab Chip, 2012, 12, 2464–2468 RSC.
- D. J. Kinahan, S. M. Kearney, O. P. Faneuil, M. T. Glynn, N. Dimov and J. Ducrée, RSC Adv., 2014, 5, 1818–1826 RSC.
- Y. Ukita, Y. Takamura and Y. Utsumi, Sens. Actuators, B, 2015, 220, 180–183 CrossRef CAS PubMed.
- K. Abi-Samra, R. Hanson, M. Madou and R. A. Gorkin III, Lab Chip, 2011, 11, 723–726 RSC.
- W. Al-Faqheri, F. Ibrahim, T. H. G. Thio, J. Moebius, K. Joseph, H. Arof, M. Madou and A. Han, PLoS One, 2013, 8, e58523 CAS.
- K. Abi-Samra, L. Clime, L. Kong, R. Gorkin, T.-H. Kim, Y.-K. Cho and M. Madou, Microfluid. Nanofluid., 2011, 11, 643–652 CrossRef CAS.
- T. H. G. Thio, F. Ibrahim, W. Al-Faqheri, J. Moebius, N. S. Khalid, N. Soin, M. K. Kahar and M. Madou, Lab Chip, 2013, 13, 3199–3209 RSC.
- T. H. G. Thio, F. Ibrahim, W. Al-Faqheri, N. Soin, M. Kahar Bador and M. Madou, PLoS One, 2015, 10, e0121836 Search PubMed.
- M. M. Aeinehvand, F. Ibrahim, S. W. Harun, A. Kazemzadeh, H. A. Rothan, R. Yusof and M. Madou, Lab Chip, 2015, 15, 3358–3369 RSC.
- M. Focke, O. Strohmeier, P. Reith, G. Roth, D. Mark, R. Zengerle and F. von Stetten, in Proc. of MicroTAS 2011, 2011, pp. 659–661 Search PubMed.
- M. Keller, J. Naue, R. Zengerle, F. von Stetten and U. Schmidt, PLoS One, 2015, 10, e0131845 Search PubMed.
- M. Focke, D. Kosse, D. Al-Bamerni, S. Lutz, C. Müller, H. Reinecke, R. Zengerle and F. von Stetten, J. Micromech. Microeng., 2011, 21, 115002 CrossRef.
- M. Rombach, D. Kosse, B. Faltin, S. Wadle, G. Roth, R. Zengerle and F. von Stetten, BioTechniques, 2014, 57, 151–155 CAS.
- J. Burger, M. Focke, A. Gross, T. Jäger, A. Lastochkin, D. Mark and G. Roth, WO2012046178 A1, 2012.
- M. Grumann, T. Brenner, C. Beer, R. Zengerle and J. Ducrée, Rev. Sci. Instrum., 2005, 76, 025101 CrossRef PubMed.
Footnote |
| † Electronic supplementary information (ESI) available: Experimental details and a video of stationary stroboscopic images. See DOI: 10.1039/c5ra16095b |
| This journal is © The Royal Society of Chemistry 2015 |