
Solvent-free 1H-tetrazole, 1,2,5,6-tetrahydronicotinonitrile and pyrazole synthesis using quinoline based ionic fluoride salts (QuFs): thermal and theoretical studies†
Nafees Iqbala,
Jamshed Hashima,
Syed Abid Alia,
Mariya al-Rashidab,
Rima D. Alharthyc,
Shakeel Ahmada,
Khalid Mohammed Khan a,
Fatima Zahra Bashaa,
Syed Tarique Moin*a and
Abdul Hameed*a
a,
Fatima Zahra Bashaa,
Syed Tarique Moin*a and
Abdul Hameed*a
aH.E.J. Research Institute of Chemistry, International Center for Chemical and Biological Sciences, University of Karachi, Karachi-75270, Pakistan. E-mail: tarique.syed@iccs.edu; abdul.hameed@iccs.edu; Fax: +92-213-4819018; Tel: +92-219-9261701-2
bDepartment of Chemistry, Forman Christian College (A Chartered University), Ferozepur Road, 54600, Lahore, Pakistan
cDepartment of Chemistry, King Abdulaziz University, Jeddah, Saudi Arabia
First published on 30th October 2015
Abstract
The role of ionic liquids as catalyst and solvent to mediate organic reactions is well documented. While imidazole and pyridine-based ionic liquids have traditionally been the ionic liquids of choice for organic synthesis, imidazole's inert nature and pyridine's toxicity are often viewed as impediments. In the present study, we have synthesized ionic liquids (QuFs), employing the non-toxic quinoline ring. The desired QuFs were readily prepared via N-alkylation and corresponding anion exchange with fluoride ions. The structures of the synthesized QuFs were confirmed with advanced spectroscopic techniques such as 1H and 13C NMR, IR and mass spectrometry. The potential of these newly synthesized QuFs as catalyst for click chemistry and other reactions was explored by carrying out synthesis of 5-(p-methylphenyl)-1H-tetrazole (7), 2-dicyanomethylene-6-methyl-4,6-bis(m-methoxyphenyl)-1,2,5,6-tetrahydronicotinonitrile (12), and 3,5-dimethyl-1-(p-methoxy)-1H-pyrazole (15). Detailed thermal analysis (DSC, TGA and DTG) was carried out to study the thermal stability of synthesized QuFs. Density functional theory (DFT) calculations and molecular dynamics simulations were also carried in order to establish a relationship between binding energies, and structural and dynamic characteristics of QuFs.
1. Introduction
Ionic liquids (ILs) have been used in lieu of traditional solvents in organic synthesis due to their unique physiochemical properties such as low volatility, significant thermal stability, and ease of recovery.1,2 ILs offer a clean solvent-free environment to carry out a variety of eco-friendly reactions.3,4 Imidazole or pyridine-based ionic liquids with a varied range of counter anions have commonly been used as catalysts in synthetic chemistry. However, the inert nature of imidazole and the well-known toxicity of pyridine are impediments towards further expanding the scope of ionic liquids.5–7 In the present study, we have employed non-toxic quinoline as a head group for the synthesis of N-alkylated ionic liquids. Quinoline is an important scaffold in a number of compounds of medicinal and pharmaceutical interest.8–10 Quinoline-based ionic salts have not yet been explored as catalysts in organic synthesis. Quinoline-based ionic liquids can be easily prepared via a simple alkylation and subsequent counter-ion exchange under conventional environment, without employing any strict controlled reaction conditions. In this study, the counter anions (i.e. I−, Br−) of the corresponding ionic salts were exchanged with fluoride ions (F−), which is known to act as a mild base in various organic reactions.11 The quinoline-based ionic liquids with fluoride counter anion have a close resemblance with tetrabutyl ammonium fluoride (TBAF), a well-known catalyst in organic reactions.12–16 In order to explore the catalytic potential of synthesized QuFs, click reaction, and other multicomponent reactions were carried out under solvent-free conditions. Click chemistry was used for the synthesis of 5-(p-methylphenyl)-1H-tetrazole (7). Keeping in view the hygroscopic nature of ionic liquids, the effect of successively increasing concentration of water on synthetic output of the reaction employing QuF (4) as ionic liquid was investigated in detail (Fig. 1). | ||
| Fig. 1 Water effects on reaction output; 1H-tetrazole (7a). Reaction conditions: 4′-methyl benzonitrile (1 mmol), TMSN3 (2 mmol), QuF-C5 (4) (1 mmol), MW 120 °C, 2 h, quenched with aqueous 1 M HCl. | ||
Tetrazole serves as an isosteric substituent for carboxylic acid group in many compounds of pharmaceutical interest.17 The tetrazole moiety improves the metabolic resistance and also the pharmacokinetic properties of drugs.18 Multicomponent reactions carry unique place in synthesis and medicinal chemistry to build different compounds libraries for biological screening purposes.19
A wide range of applications of ionic liquids have been reported owing to a number of unique physical properties including thermodynamic and ion transport properties.20 These properties of ionic liquids vary widely depending on the nature of the cation and anion, therefore, such properties should ideally be known prior to the use of an ionic liquid. Transport properties of ions are of great significance that need to be estimated for the design of new ionic liquids for use as electrolytes or in electrochemical devices.21 Different properties of ionic liquids can be assessed by means of experimental techniques and can also be simulated by means of molecular dynamics (MD) simulation.22,23 Hence structural and dynamic properties of QuF derivatives in bulk, including self-diffusion coefficients were investigated by employing molecular dynamics simulations.
Density functional theory (DFT) calculations were used to gain structural insight into QuF ionic liquids. The stability of such ionic liquids is of paramount interest, hence binding energy calculations were performed in comparison to TBAF, a commercially available ionic liquid.24
2. Results and discussion
2.1. Synthesis of quinoline-based fluoride ionic liquids (QuFs) (3–5)
A synthetic layout of quinoline-based ionic liquids (QuFs) (3–5) is given in Scheme 1. The synthetic scheme involved two steps; (1) N-alkylation of quinoline (1) with alkyl halides, and (2) fluoride ion exchange to obtain the desired ionic salts in 80–95% yield. The N-alkylation of quinoline (1) was carried out using alkyl halides of different chain lengths (C2, C5, and C7). Attachment of longer alkyl chains have been known to affect the catalytic efficiency of ionic liquids due to their steric hindrance.25 Alkylation with alkyl iodides (C2) was found to occur in less time as compared to alkyl bromides (C5 and C7), this is attributed to group leaving characteristics of halides. Next the counter ion (either I− or Br−) of the resultant ionic liquid was exchanged with fluoride ion (F−). Potassium fluoride was used as fluoride ion source in the mixture of water/methanol (1![[thin space (1/6-em)]](https://www.rsc.org/images/entities/char_2009.gif) :1) at room temperature. The structures of the desired QuFs (3–5) were confirmed via different spectroscopic techniques including 1H and 13C NMR, IR, and mass spectroscopy (EI+ and HRMS). Reactions have also been scaled upto 3–5 g (23–39 mmol) to validate the synthetic layout.
:1) at room temperature. The structures of the desired QuFs (3–5) were confirmed via different spectroscopic techniques including 1H and 13C NMR, IR, and mass spectroscopy (EI+ and HRMS). Reactions have also been scaled upto 3–5 g (23–39 mmol) to validate the synthetic layout.
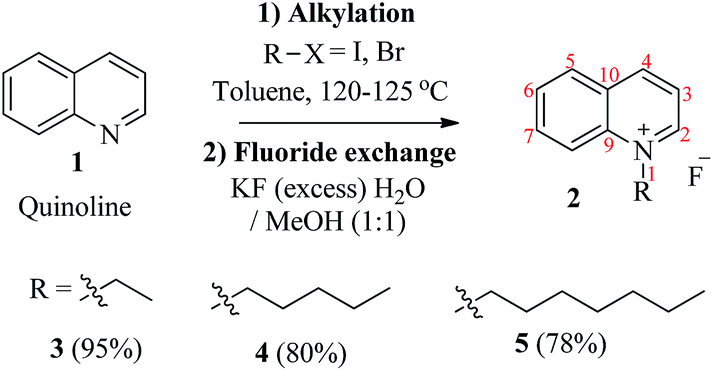 | ||
| Scheme 1 Synthesis of quinoline-based ionic fluoride salts. Reactions were scaled upto 3–5 g (23–39 mmol) with quinoline as starting material. | ||
2.2. Applications in synthesis
Applications of quinoline-based fluoride ionic liquids (QuFs) as catalyst in organic synthesis, under solvent-free conditions, were explored by preforming different reactions. Initially, click chemistry for tetrazole formation was explored. 1H-Tetrazole (7) was constructed from benzonitrile (6), as substrate, on coupling with an azide source (TMSN3) in the presence of neat QuFs (3–5). TMSN3 is used as azide source for [3 + 2]-cycloaddition with nitrile (CN) group to form tetrazole ring. Fluoride ion has much affinity for silicon atom to release active azide species.26 In some previous methods, neat TBAF12,15 or 1,8-diazabicycloundec-7-ene (DBU)-based ionic liquids with fluoride counter anion has been used for click reaction for tetrazole synthesis.24 In the present study, we used new quinoline-based fluoride salts to catalyze click reaction. Although, quinoline scaffold is a part of many pharmaceutical products of interest, the use of quinoline, or its modified forms, in organic synthesis as catalyst is not well explored. The quinoline-based fluoride salts (3–5) are easy to prepare and can serve as mild reagents to catalyze organic reactions. Typically, click reaction for tetrazole formation was performed using neat quinoline-based fluoride salts as under solvent-free conditions. Both conventional heating and microwave irradiation was employed for the reaction. QuF (3) gave desired tetrazole in only trace amount or low yield (18% using microwave irradiations) under solvent-free conditions which may be due to insufficient diffusion of reactants in QuF (3) medium as it exists in solid form. While, the click reaction with QuFs (4) or (5) occurred smoothly to yield 1H-tetrazole (7) in 54–60% yield. As expected, the reaction time observed under microwave irradiation was less than conventional heating (Table 1).
Hygroscopic nature of ionic salts is well-known. The presence of water contents in ionic liquids affects their catalytic efficacy. Keeping in view this fact, we performed click reaction with freshly prepared QuF-C5 (4), dried over anhydrous magnesium sulfate, by adding different percentage of water (10%, 30%, and 50%) in reaction mixture. All these reactions were performed under microwave irradiation to elaborate the effects of added water contents on the catalytic efficiency of ionic liquid (4). The yield of 5-(p-methylphenyl)-1H-tetrazole (7a), in the presence of 0% and 10% water was found to be almost the same (60% and 58% respectively), while with 30% water content, the reaction output slightly dropped to 45%. A substantial decline in reaction output (32%) was observed in the presence of 50% water (Fig. 1). The percentage of water in ionic liquid (4) was determined by using Karl-Fisher apparatus after storing more or equal to 3 months at room temperature. The water contents in (4) were found to be 12.3%. These observations signify the tolerance level of water in catalytic efficiency of quinoline fluoride salts (Scheme 2).
 | ||
| Scheme 2 Solvent-free 1H-tetrazole (7a) formation in quinoline fluoride salts. | ||
The catalytic efficiency of QuFs (4) or (5) was further explored by preforming a one-pot reaction involving (1) Knoevenagel condensation, and subsequent (2) dimerization of Knoevenagel product (9) under solvent-free conditions (Scheme 3). The reaction sequence showed proton abstraction from methylene group with QuF and reaction of resultant malononitrile anionic species to acetophenone (8) to afford alkylidene malononitrile species (9). In second step, QuF again abstracts proton from α-methyl group to promote dimerization via multistep sequence to afford 2-dicyanomethylene-6-methyl-4,6-bis(m-methoxyphenyl)-1,2,5,6-tetrahydronicotinonitrile (13) (Scheme 3).27–29 Moreover, a reaction between acetylacetonate (13) and p-methoxyphenyl hydrazine hydrochloride (14) in the presence of QuF (4) under solvent-free condition afforded corresponding 3,5-dimethyl-1-(p-methoxyphenyl)-1H-pyrazole (15) in good yield (63%) as shown in the Scheme 4. The applications of QuFs in 1H tetrazole (7), 1,2,5,6-tetrahydronicotinonitrile (12) or pyrazole (15) formation signify their catalytic activity in organic reactions.
 | ||
| Scheme 3 Solvent-free one-pot Knoevenagel condensation and dimerization to (12). | ||
 | ||
| Scheme 4 Synthesis of 3,5-dimethyl-1-(p-methoxyphenyl)-1H-pyrazole (15). | ||
Interesting structure of 2-dicyanomethylene-6-methyl-4,6-bis(m-methoxyphenyl)-1,2,5,6-tetrahydronicotinonitrile (12) was fully characterized with 1H, C13 NMR and correlation spectra (HSQC, HMBC, COSY, NOSEY). Data of 1,2,5,6-tetrahydronicotinonitrile (12) has been summarized in Table 2. Compound (12) showed three distinct signals; (a) a broad singlet (brs) for NH-1 proton at δ 9.71 ppm, (b) two doublets for each methylene protons Ha-5 and Hb-5 at δ 3.77 and δ 3.27 ppm, respectively, and (c) a singlet for C-7 methyl protons at δ 1.71 ppm. In HMBC NH-1 showed correlations with C-2, C-3, C-5, C-6, C-7, C-8, and C-10 in the structure (12). In COSY spectra NH-1 showed correlation with Ha-5, H-6′, while in NOSEY spectrum it showed correlations with H-2′, H-7. The C-7 methyl proton showed HMBC correlation with C-1′ and C-5, and C-6 and NOSEY correlation with H-1, H-2′, and Ha-5. Among methylene protons Hb-5 showed additional HMBC correlation with C-2 and C-2′′ due to molecule geometry. A detail summary of the NMR spectral data has been summarized in Table 2 to confirm the structure (12).
|
||||||
|---|---|---|---|---|---|---|
| Atom (N or C) # | δC | δH | Mul. | HBMC | COSY | NOESY |
| a Obscured by m-methoxy protons.b Mul. = multiplicity. | ||||||
| 1 | — | 9.71 | NH | C-2, C-3, C-5, C-6, C-7, C-8, C-10 | Ha-5, H-6′ | H-2′, H-7 |
| 1′ | 144.6 | — | C | — | — | — |
| 1′′ | 136.8 | — | C | — | — | — |
| 2 | 157.5 | — | C | — | — | |
| 2′ | 111.5 | 6.98 (brs) | CH | C-3′, C-6, C-6′ | — | H-1, Ha-5, H-6′, H-4′, H-7, H-12 |
| 2′′ | 113.4 | 6.91 (brs) | CH | C-3′′, C-4, C-4′′, C-6′′ | — | H-6′′, H-4′′, H-13 |
| 3 | 101.2 | — | C | — | — | — |
| 3′ | 159.5 | — | C | — | — | — |
| 3′′ | 159.1 | — | C | — | — | — |
| 4 | 168.6 | — | C | — | — | — |
| 4′ | 112.5 | 6.88 (dd, J = 2.4, 10.4 Hz) | CH | C-2′, C-6′ | H-5′, H-6′ | H-5′, H-6′, H-12 |
| 4′′ | 117.6 | 7.14 (dd, J = 2.2, 9.2 Hz) | CH | C-2′′, C-6′′ | H-5′′, H-6′′ | H-5′′, H-6′′, H-13 |
| 5 | 43.8 | 3.77 (d, 18.4 Hz)a | CHaH | C-1′, C-1′′, C-3, C-4, C-6, C-7 | Hb-5 | Hb-5 |
| 3.27 (d, 18.4 Hz) | CHHb | C-1′, C-1′′, C-2, C-2′′, C-3, C-4, C-6, C-7 | Ha-5 | H-2′, H-2′′, Ha-5, H-6′′ | ||
| 5′ | 129.8 | 7.33 (t, J = 8 Hz) | CH | C-1′, C-3′ | H-4′, H-6′ | H-4′, H-6′ |
| 5′′ | 130.1 | 7.43 (t, J = 8 Hz) | CH | C-1′′, C-3′′ | H-4′′, H-6′′ | H-4′′, H-6′′ |
| 6 | 56.9 | C | — | — | — | |
| 6′ | 117.1 | 6.95 (d, J = 8.4 Hz) | CH | C-2′, C-4′, C-6 | H-4′, H-5′ | H-2′, H-4′, Ha-5, H-5′ |
| 6′′ | 120.4 | 7.03 (d, J = 7.6 Hz) | CH | C-2′′, C-4, C-4′′ | H-4′′, H-5′′ | H-2′, H-4′, Ha-5, H-5′′ |
| 7 | 28.2 | 1.71 (s) | CH3 | C-1′, C-5, C-6 | — | H-1, H-2′, Ha-5 |
| 8 | 49.5 | — | C | — | — | — |
| 9 | 115.4 | — | CN | — | — | — |
| 10 | 113.6 | — | CN | — | — | — |
| 11 | 114.8 | — | CN | — | — | — |
| 12 | 55.1 | 3.75 (s) | OCH3 | C-3′ | — | H-2′, H-4′ |
| 13 | 55.3 | 3.77 (s) | OCH3 | C-3′′ | — | H-2′′, H-4′′, H-6′′ |

2.3. Thermal studies
Thermal studies were also carried out for all newly synthesized QuFs (3, 4, and 5) along with commercially available TBAF·3H2O to determine their decomposition temperatures. Fig. 2 shows overlap of TGA graphs of all QuFs (3, 4, and 5) and TBAF·3H2O. TGA graph showed TBAF decomposition in three steps, the first step (20% weight loss) is due to loss of water molecules when heated from ambient to 120 °C, the remaining steps 120–165 °C (35% weight loss), and 165–260 °C (37% weight loss) are due to successive loss of alkyl chains possibly involving a Hofmann elimination.30 Hofmann elimination has been proposed to be the most plausible mechanism for thermal degradation of quaternary ammonium compounds containing alkyl chains.31 In last step, slight weight loss of 4% is observed in the range 350–380 °C. The DSC data has been overlapped on TGA graph of TBAF, indicating an endothermic peak associated with each weight loss step. First derivative graph (DTG) was calculated for TBAF and is shown in Fig. 3b. The DTG peaks indicate two decomposition temperature for TBAF at 130 °C and 240 °C. | ||
| Fig. 2 TGA graphs of ionic salts (3), (4), (5), and TBAF·3H2O. | ||
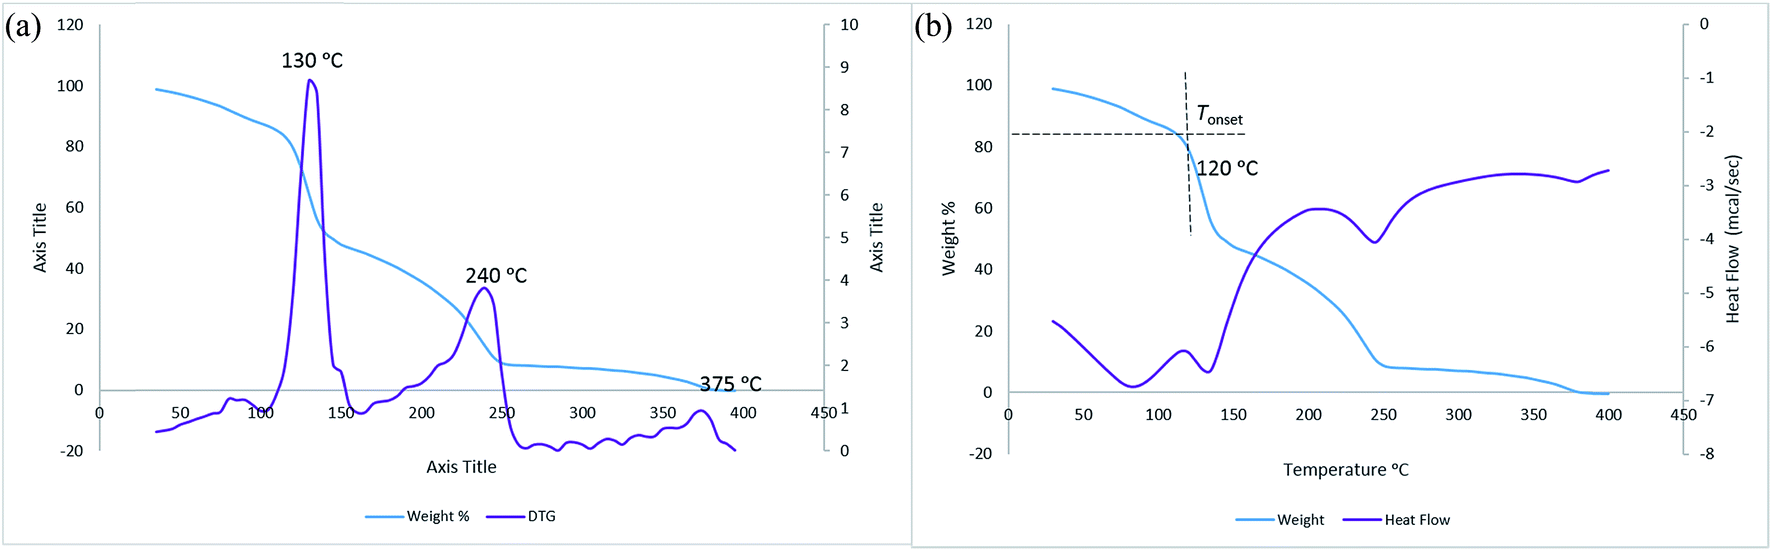 | ||
| Fig. 3 TBAF·3H2O (a) TGA and DSC graphs; (b) TGA and first derivative (DTG). | ||
The ionic salt QuF (3) was found to possess most thermal stability, the onset of decomposition (Tonset) was observed at 200 °C, which is the highest among all QuF ionic salts studied, including the commercially available TBAF·3H2O. The ionic salt (3) decomposes in a single step in the temperature range 200–300 °C (95% weight loss). First derivative graph of TGA data (DTG) was also calculated and overlapped on TGA graph (Fig. 4a), indicating decomposition temperature at 265 °C (which is 10 degrees higher than (4), 20 degrees higher than (5), and 135 degrees higher than first decomposition temperature of TBAF). The heat flow data (DSC) has also been overlapped on TGA data, it indicates two endothermic peaks, the first one is observed in the temperature range 150–175 °C, since there is no associated weight loss step in this temperature range, it is inferred that this endothermic peak is due to melting of (3). The second endothermic peak is observed in the temperature range 245–300 °C and is due to decomposition since it has as associated weight loss with it (TGA data). An overlay of TGA graph with DTG graph showed decomposition at 265 °C (Fig. 4b).
 | ||
| Fig. 4 (a) TGA and DSC graphs of QuF (3); (b) TGA and first derivative (DTG) of QuF (3); (c) TGA and DSC graphs of QuF (4); (d) TGA and first derivative (DTG) of QuF (4); (e) TGA and DSC graphs of QuF (5); (f) TGA and first derivative (DTG) of QuF (5). | ||
For QuF (4), the first step in TGA is observed in the temperature range from ambient to 100 °C (6% weight loss), and is due to dehydration, this is also evidenced by accompanying endothermic peak in the same temperature range. The onset temperature (Tonset) is calculated after dehydration step and is 105 °C (Fig. 4c). From 105–200 °C, there is a slight and gradual loss of weight (6%), the last and major step in TGA is observed in the broad temperature range of 200–315 °C (86% weight loss) and indicates decomposition as evidenced by an associated endothermic peak in the matching temperature range. First derivative graph of TGA data (DTG) was also calculated and overlapped on TGA, indicating decomposition temperature at 255 °C (Fig. 4d).
Thermal analysis of QuF (5) was very similar to (3). In TGA graph for (5), there is a very slight loss in weight (2% weight loss) in the beginning from ambient temperature to 110 °C, this step is accompanied by a small endothermic peak (as evidenced from the heat flow, DSC data overlapped on TGA graph). This slight loss is most probably due to dehydration. The onset temperature (Tonset) is calculated after dehydration step and is 110 °C (Fig. 4e). From 110–200 °C, there is a gradual loss of weight (8%), whereas the majority of the weight loss (88%) is observed in the temperature range 200–350 °C. This weight loss step is due to decomposition as it is accompanied by a corresponding endothermic peak (Fig. 4e). First derivative graph of TGA (DTG) was also calculated and overlapped on TGA, indicating decomposition temperature at 245 °C (Fig. 4f).
2.4. Theoretical studies
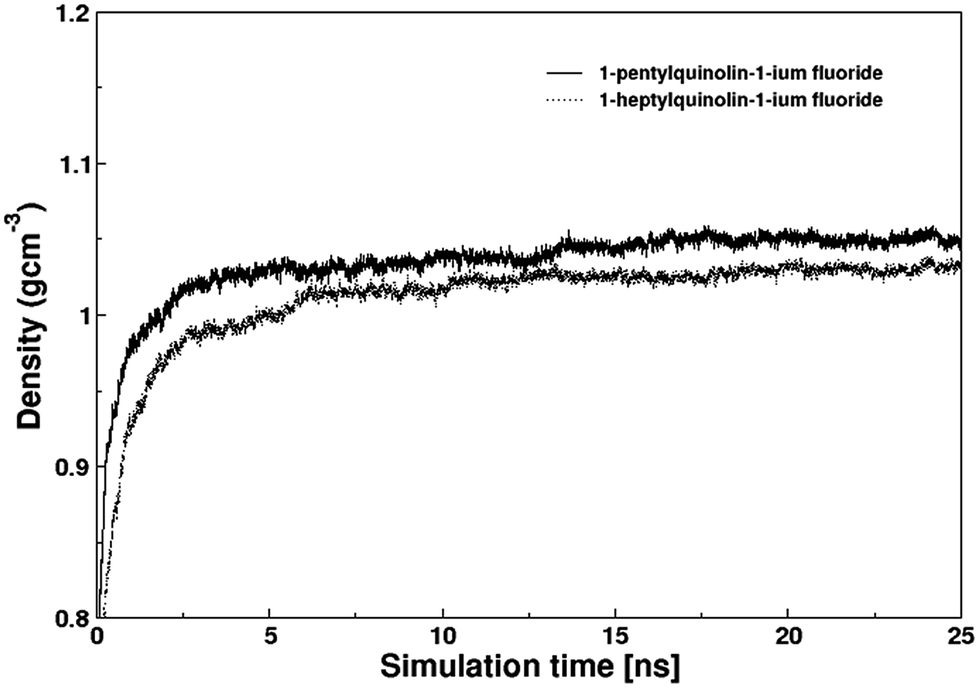 | ||
| Fig. 5 Densities of QuFs (4) and (5) ionic liquids calculated by molecular dynamics simulations. | ||
The structural properties of the QuF ionic liquids were assessed via site–site intermolecular radial distribution functions as shown in Fig. 6 and 7. The radial distribution functions plotted between center of mass of the cation and anion exhibit an identical plot for both compounds (cf. Fig. 6). In case of QuF (4), a sharp first peak appeared at 2.35 Å which leads to respective second and third well-structured peaks at 3.25 and 4.45 Å along with further oscillations extending beyond 10 Å. A closely related radial distribution function pattern was observed in case of QuF (5) indicating a similar structure for the two ionic liquids. The sharp first peaks in both RDFs demonstrate that a strong electrostatic interaction which exists between a pair of cation and anion whereas second and third peaks correspond to electrostatic interaction that may be experienced between cations and anions of different ion pairs.
 | ||
| Fig. 6 Radial distribution functions between center of masses of cation and anion in both ionic liquids (solid and dash line are for QuFs (4) and (5), respectively). | ||
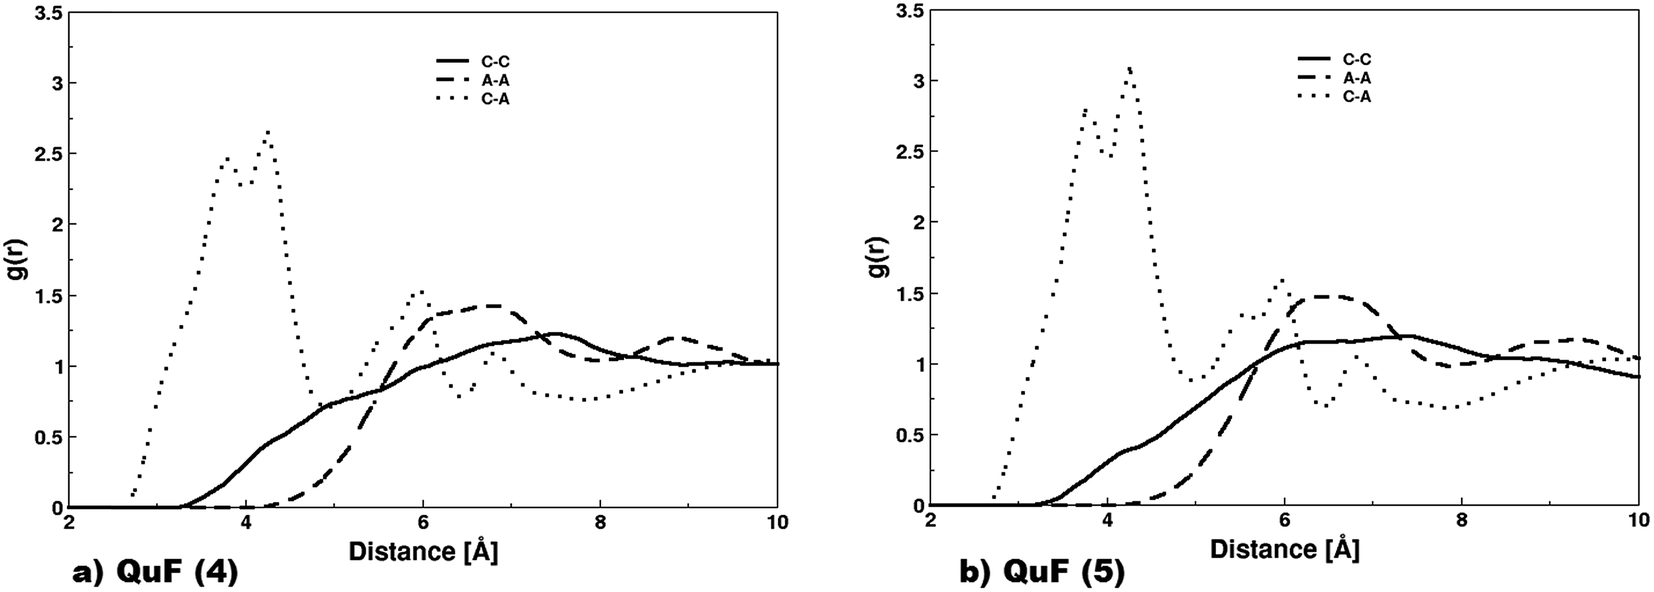 | ||
| Fig. 7 (a) Radial distribution functions between the N atom of cations (C–C), between the fluoride anions (A–A), and between the N atoms of cations and fluoride anions (C–A) of the QuF (4) ionic liquid are illustrated; (b) radial distribution functions between the N atom of cations (C–C), between the fluoride anions (A–A), and between the N atoms of cations and the nitrogen atom of the fluoride anions (C–A) of the QuF (5) ionic liquid are illustrated. | ||
Fig. 7a displays radial distribution functions between atomic pairs of cations and anions in QuF (4) ionic liquids. The distribution function between the nitrogen atoms of the quinolinium ion (gC–C) shows a very broad unstructured peak whose maximum appeared at a larger distance, after that between fluoride ions (gA–A) located beyond 7 Å. The distribution function evaluated between nitrogen atom of quinolinium cation and fluoride anion (gC–A) was visible at a lower distance compared to that of gC–C and gA–A which is a clear indication of the charge-ordering structure due to electrostatic force of attraction. In gC–A profile, the splitting of first broad peak resulted into two tiny peaks located at 3.77 and 4.24 Å that were attributed to the delocalization of positive charge between nitrogen and adjacent carbon connected via unsaturated bond, thereby dynamically binding fluoride anion to the nitrogen and carbon atom. For QuF (5), a similar behavior was observed as depicted by radial distribution functions shown in Fig. 7b. This clearly indicates that increasing alkyl chain length does not cause any influence on the structural characteristics of QuF based ionic liquids in bulk.
The mean square displacements (MSDs) of the cations and anions in the QuFs (4) and (5), computed from 25 ns simulations are shown in Fig. 8a and b. Contrasting to similar structural properties for the two ionic liquids, the dynamical properties i.e. transport properties in terms of MSDs of these liquids are different which clearly demonstrate the influence of two alkyl chains of different length attached to the quinolinium nitrogen that in turn affect the MSDs of fluoride anion. The MSD plots have asymptotic linear region till 2 ns that corresponds to their diffusion properties, hence self-diffusion coefficients of the cation and anions are possible to compute from MSDs of the ions over this region between 0 and 2 ns according to the Einstein relation.
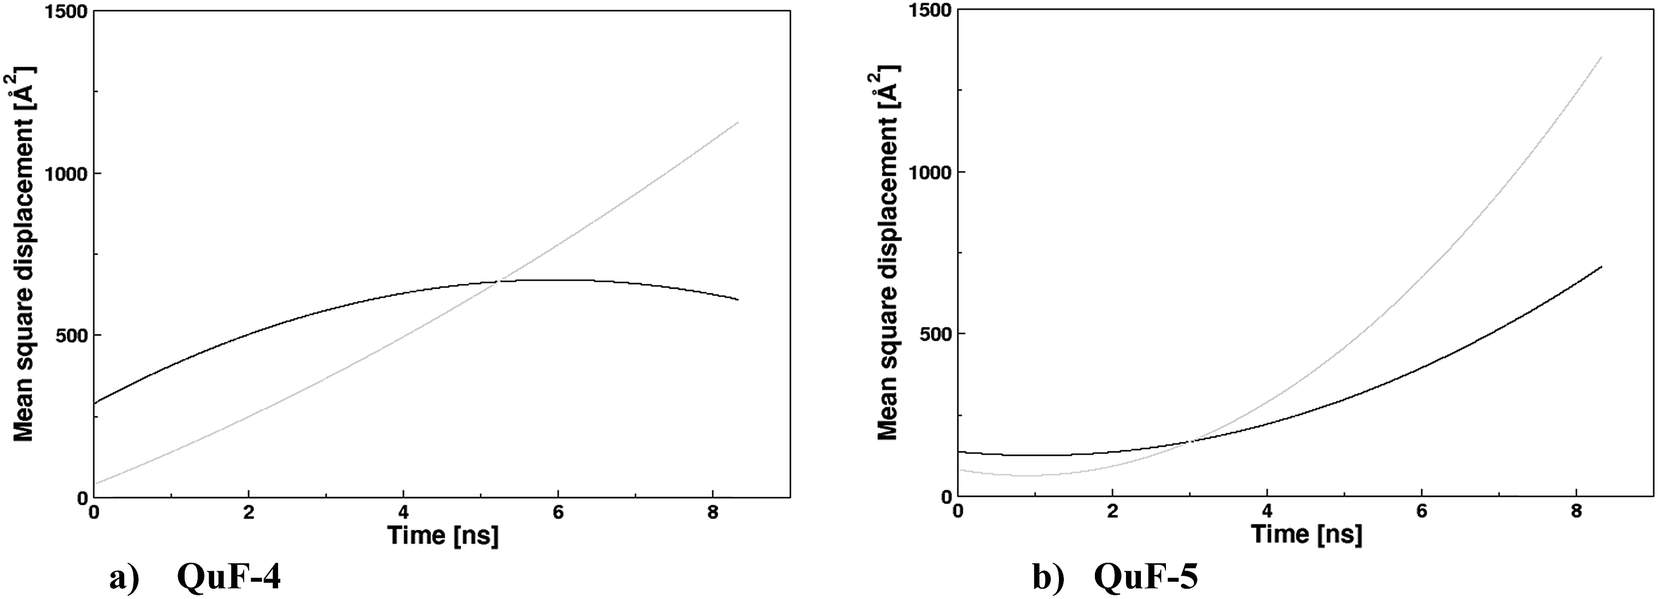 | ||
| Fig. 8 (a) Mean-square displacements (MSDs) of the ions in the QuF (4) (black and gray line for the cation and anion, respectively); (b) mean-square displacements (MSDs) of the ions in the QuF (5) (black and gray line for the cation and anion, respectively). | ||
| QuFs | 3 | 4 | 5 | TBAF |
|---|---|---|---|---|
| Energy (kcal mol−1) | −126.6 | −125.2 | −124.9 | −104.25 |
The relationship between the ionic structure and the transport properties of the ionic liquids needs to be figured out, since it aids significantly in designing novel ionic liquids for many industry related applications. Based on simulation data, it was evaluated that a direct relationship between self-diffusion coefficients and binding energies of the ion pairs lead a conclusion that several factors such as size of cations, magnitude of binding energies for the ion pairs (cations and anion) determine the magnitude of the self-diffusion coefficients. The radial distribution functions exhibited somewhat similar attributes which is an indication of similar charge-order structures for these ionic liquids. Besides structural properties, it also seems significant to mention that the binding energies of both ionic liquids (4 and 5) are identical, though the transport properties are strongly dependent on the alkyl chain length, hence indicating that the transport properties rely on size of cations. Other properties such as size of anions, interaction between cation and anions, etc. also affect the ion diffusion but in QuF based ILs fluoride anions are present in both cases. It was previously reported about the dependence of the self-diffusion coefficients on the alkyl chain length-long alkyl chain decreases and increases the self-diffusion coefficients of the ILs when they are composed of other anions. Here, a variation in the alkyl chain length affects the self-diffusion properties, thus showing influence on the fluid properties of the ionic liquids.33
3. Conclusion
In conclusion, quinoline-based ionic fluoride salts (QuFs) (3, 4, and 5) have been synthesized and explored as catalysts in different organic reactions. 5-(p-Methylphenyl)-1H-tetrazole (7), 2-dicyanomethylene-6-methyl-4,6-bis(m-methoxyphenyl)-1,2,5,6-tetrahydronicotinonitrile (12), and 3,5-dimethyl-1-(p-methoxyphenyl)-1H-pyrazole (15) have been synthesized from their corresponding reagents by using QuFs as catalyst under solvent-free conditions. Thermal stability of the QuFs (3, 4, and 5) has also been determined by conducting TGA, DTG, and DSC analysis. Data obtained after molecular dynamics simulations and binding energy calculations is significant enough to be considered or addressed in the context of future design of novel ionic liquids.4. Material and methods
Quinoline (≥99.0%), alkyl halides (I, Br), potassium fluoride (≥99.0%) were purchased from Sigma Aldrich and used without any purification unless otherwise stated. The analytical grade toluene, methanol and distill water were used as solvents. For thin layer chromatography (TLC), silica gel 60 aluminium-backed plates 0.063–0.200 mm had been employed. Analytical grade solvents such as ethyl acetate (EtOAc), diethyl ether, hexane and methanol etc. were used. Screw capped Micro Reaction Vessels (3–5 mL) were purchased from Sigma Aldrich. Short wavelength UV radiation at 254 nm was used for visualization of TLC plates, in addition various staining mixtures, such as basic potassium permanganate or vanillin were also used. Infrared (IR) spectra were obtained via Bruker Vector-22 spectrometer. The 1H NMR spectra were recorded using Bruker spectrometers at 300 MHz, 400 MHz, 500 MHz, and 600 MHz, while 13C NMR spectra were recorded at 75 MHz, 100 MHz, 125 MHz, 150 MHz in the appropriate deuterated solvent. The chemical shifts were recorded on the δ-scale (ppm) using residual solvents as an internal standard (DMSO; 1H 2.50, 13C 39.43 and CHCl3; 1H 7.26, 13C 77.16). Coupling constants were calculated in Hertz (Hz) and multiplicities were labelled s (singlet), d (doublet), t (triplet), q (quartet), quint (quintet) and the prefixes br (broad) or app (apparent) were used. Mass spectra (EI+ and FAB) were recorded on Finnigan MAT-321A, Germany. Melting points of solids were determined using a Stuart™ melting point SMP3 apparatus.Initiator-8 single-mode microwave reactor was used for synthesis. It produces controlled radiation at 2.450 GHz (Biotage AB, Uppsala), including proprietary Workflow Manager Software (version 2.1). Sealed microwave vials (0.2 to 0.5 mL, 0.5–2.0 mL filling volume) were used to perform reactions. A standard absorbance level (400 W maximum power) was utilized. Under microwave conditions, reaction time represents the hold times at temperatures indicated, not the total irradiations times. The temperature was measured with IR sensor present outside the reaction vessel.
4.1. Theoretical methods
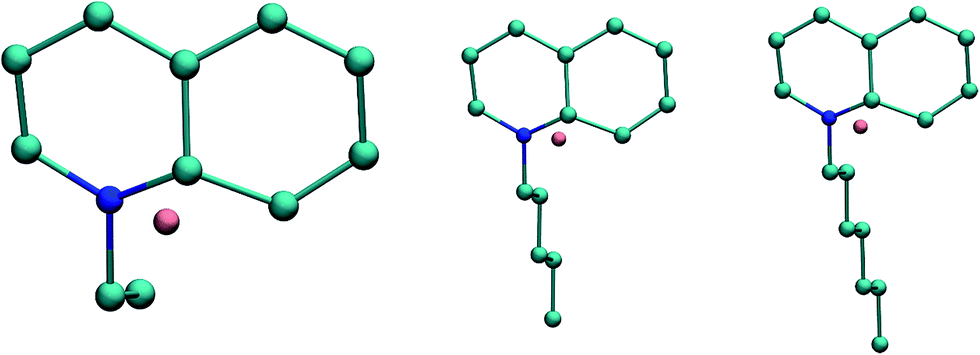 | ||
| Fig. 9 Cations and anion of QuFs (3), (4), and (5). | ||
 | ||
| Fig. 10 Simulation boxes representing QuFs (4) and (5). | ||
Molecular dynamics simulations for both systems were performed in the NPT ensemble. To remove bad clashes, energy minimizations of both systems were performed for 10000 steps which were followed by NVT equilibration for 5 ns. The equilibrated systems were then subjected to sampling of trajectories for 25 ns. All bonds including hydrogen bonds were treated flexible, enabling a time step of 1.0 fs. Particle mesh Ewald algorithm was employed to treat long-range electrostatic interactions, and a cutoff value of 8.0 Å was set for non-bonded interactions. The temperature was kept at 298 K employing the Langevin dynamics using a collision frequency of 5.0 ps−1. The pressure was maintained at 1 atm utilizing pressure coupling algorithm with a relaxation time of 1.0 ps. For both simulations, SANDER module implemented in AMBERTOOLS14 was used whereas CPPTRAJ and VMD were used for the analysis and visualization of trajectories, respectively.39,40
4.2. General synthetic procedure for quinoline-based fluoride ionic liquids (3–5)
Step I: to an oven dried round bottom flask quinoline (3–5 g, 23–39 mmol, 1 equiv.), alkyl halides (I, Br) (1.0–1.2 equiv.) (ethyl iodide 3.59 g, 23 mmol or 1-bromopentane 7.02 g, 46.8 mmol or 1-bromoheptane 8.33 g, 46.8 mmol) along with 2–3 mL of toluene at room temperature. The resulting reaction mixture was heated at reflux (120–125 °C) until thin layered chromatographic analysis showed no starting material, quinoline 1. The resulting corresponding ionic liquids was further washed with cold toluene or hexane, dried and used without purification in the next step.Step II: in fluoride exchange step, the crude mixture of step I was dissolved in methanol (5 mL) and added to the saturated aqueous solution of KF (5 mL) at room temperature. The mixture was stirred overnight, afterwards methanol was evaporated. To the aqueous layer, dichloromethane (15 mL) was added and both layers were separated using a separating funnel. The organic layer was dried over magnesium sulfate, filtered, and evaporated by using rotary evaporator. The obtained material was occasionally washed with hexane to get the final desired product. The final ionic quinoline-based ionic salts 3–5 were characterized with 1H, 13C-NMR, IR, UV spectroscopy and mass spectrometry.
4.3. Spectral data of quinoline-based fluoride salts
4.4. Procedure for 5-(p-methylphenyl)-1H-tetrazole (7a–e) synthesis
In a typical reaction, an oven dried micro reaction vessel capped with septum was used for reaction. To an open vessel, 4-methyl benzonitrile (234 mg, 1 or 2 mmol, 1 equiv.), trimethyl silyl azide (460 mg, 4 mmol, 2 equiv.) along with quinoline fluoride salt(s) ((4) 438 mg, 2 mmol, 1 equiv.) was added at room temperature. The resulting reaction mixture was heated under convention heating at 105–110 °C for 6 h until TLC showed no starting material. The click reaction was also carried out under microwave irradiation at 120 °C for 2 h. The reaction mixture in both cases was cooled to room temperature and quenched with 1 M HCl (15 mL). To this mixture, EtOAc (20 mL) was added and organic layer was separated via a separating funnel, dried over MgSO4, filtered and evaporated in rotary evaporator to get the crude material. Silica gel column chromatography was used to separate the pure 1H-tetrazoles (7a–e) as off-white solids in 50–60% yield. 5-(4′-Methylphenyl)-1H-tetrazole (7a) 60% (192 mg) 1H NMR (400 MHz, DMSO): δH 7.91 (2H, d, J = 8.0 Hz, ArH), 7.39 (2H, d, J = 8.0 Hz, ArH), 2.38 (3H, s, CH3); MS-EI m/z 160 (M+). The data is identical to those previously reported.41,425-(3′-Methylphenyl)-1H-tetrazole (7b) 65% (105 mg) 1H NMR (400 MHz, DMSO): δH 7.86 (1H, brs, ArH), 7.81 (1H, d, J = 7.6 Hz, ArH), 7.47 (1H, t, J = 7.8 Hz, ArH), 7.39 (2H, d, J = 7.6 Hz, ArH), 2.39 (3H, s, CH3); MS-EI m/z 160 (M+).
5-(4′-Chlorophenyl)-1H-tetrazole (7c)43 69% (125 mg) 1H NMR (400 MHz, DMSO): δH 8.03 (2H, d, J = 8.8 Hz, ArH), 7.67 (2H, d, J = 8.4 Hz, ArH); MS-EI m/z 180 (M+).
5-(4′-Methoxyphenyl)-1H-tetrazole (7d) 58% (102 mg) 1H NMR (400 MHz, DMSO): δH 7.96 (2H, d, J = 8.8 Hz, ArH), 7.13 (2H, d, J = 8.8 Hz, ArH), 2.83 (3H, s, OCH3); MS-EI m/z 176 (M+).
5-(4′-Fluorophenyl)-1H-tetrazole (7e)44 61% (100 mg) 1H NMR (400 MHz, DMSO): δH 8.06 (2H, dd, J = 5.2, 8.8 Hz, ArH), 7.45 (2H, t, J = 8.8 Hz, ArH); MS-EI m/z 164 (M+).
4.5. Procedure for 1,2,5,6-tetrahydronicotinonitrile (12) synthesis
An oven dried round bottom flask was charged with 3′-methoxy acetophenone (300 mg, 2 mmol, 1 equiv.), malononitrile (165 mg, 2.5 mmol, 1.5 equiv.) and QuFs ((4) 438 mg or (5) 494 mg, 2 mmol, 1 equiv.) at room temperature. The resulting mixture was heated at 95–100 °C for 12–14 h until the complete consumption of starting material. The reaction mixture was cooled to room temperature and diluted with dioxane (5 mL). The dilute mixture was then added to 20% HCl aqueous solution to afford yellow precipitate of 1,2,5,6-tetrahydronicotinonitrile (12). The precipitates of (12) were further washed with 20% HCl solution for the complete removal of ionic salt. Precipitates were collected and dried for further spectroscopic analysis.45 1H NMR showed >90% purity of the compound (12) (238 mg, 60%). A complete spectral data of the 1,2,5,6-tetrahydronicotinonitrile (12) has been provided in the Table 1.4.6. Procedure for pyrazole (15) synthesis
An oven dried screw tight micro reaction vessel was charged with acetylacetonate (200 mg, 2 mmol, 1 equiv.), p-methoxy phenylhydrazine hydrochloride (383 mg, 2.2 mmol, 1.2 equiv.) and QuF (4) (438 mg, 2 mmol, 1 equiv.) at room temperature. The resulting reaction mixture was heated at 95–100 °C for 4 h until thin layered chromatography analysis showed no sign of starting material. The reaction mixture was cooled to room temperature and quenched with water. Crude material was extracted with EtOAc (15 mL × 2) from aqueous phase. Combined organic layers (EtOAc) were dried over MgSO4, filtered and evaporated in rotatory evaporator to afford crude mixture of (15). Silica gel column chromatography with eluents (EtOAc:hexane, 2/8) was used to purify the compound (15) in 60% yield (242 mg). 3,5-Dimethyl-1-(p-methoxyphenyl)-1H-pyrazole spectral data; 1H NMR (300 MHz, DMSO): δH 7.33 (2H, d, J = 8.7 Hz, ArH), 7.01 (2H, d, J = 9 Hz, ArH), 5.99 (1H, CH), 3.78 (3H, ArOCH3), 2.19 (CH3), 2.13 (CH3).
Conflict of interest
The authors have declared no conflict of interest.Acknowledgements
We are thankful to Higher Education Commission (HEC), Pakistan and H. E. J. Research Institute of Chemistry, International Centre for Chemical and Biological Sciences, University of Karachi, Karachi-75270, Pakistan for providing financial support for this project.References
- M. Freemantle, An introduction to ionic liquids, Royal Society of Chemistry, 2009 Search PubMed.
- P. Wasserscheid and T. Welton, Ionic Liquids in Synthesis, Wiley-VCH, Weinheim, Germany, 2008 Search PubMed.
- T. Welton, Chem. Rev., 1999, 99, 2071–2084 CrossRef CAS PubMed.
- J. P. Hallett and T. Welton, Chem. Rev., 2011, 111, 3508–3576 CrossRef CAS PubMed.
- A.-G. Ying, L.-M. Wang, H.-X. Deng, J.-H. Chen, X.-Z. Chen and W.-D. Ye, ARKIVOC, 2009, xi, 288–298 Search PubMed.
- X. Chen and A. Ying, in Ionic Liquids: Applications and Perspectives, ed. P. A. Kokorin, InTech, 2011 Search PubMed.
- T. P. Thuy Pham, C.-W. Cho and Y.-S. Yun, Water Res., 2010, 44, 352–372 CrossRef PubMed.
- A. Marella, O. P. Tanwar, R. Saha, M. R. Ali, S. Srivastava, M. Akhter, M. Shaquiquzzaman and M. M. Alam, Saudi Pharm. J., 2013, 21, 1–12 CrossRef PubMed.
- K. Kaur, M. Jain, R. P. Reddy and R. Jain, Eur. J. Med. Chem., 2010, 45, 3245–3264 CrossRef CAS PubMed.
- V. R. Solomon and H. Lee, Curr. Med. Chem., 2011, 18, 1488–1508 CrossRef CAS PubMed.
- J. H. Clark, Chem. Rev., 1980, 80, 429–452 CrossRef CAS.
- D. Amantini, R. Beleggia, F. Fringuelli, F. Pizzo and L. Vaccaro, J. Org. Chem., 2004, 69, 2896–2898 CrossRef CAS PubMed.
- N. Singh, B. K. Allam, D. S. Raghuvanshi and K. N. Singh, Adv. Synth. Catal., 2013, 355, 1840–1848 CrossRef CAS.
- J. L. Garcia Ruano, V. Marcos, J. A. Suanzes, L. Marzo and J. Aleman, Chem.–Eur. J., 2009, 15, 6576–6580 CrossRef CAS PubMed.
- D. Amantini, F. Fringuelli, O. Piermatti, F. Pizzo, E. Zunino and L. Vaccaro, J. Org. Chem., 2005, 70, 6526–6529 CrossRef CAS PubMed.
- S. Gao, C. H. Tsai, C. Tseng and C.-F. Yao, Tetrahedron, 2008, 64, 9143–9149 CrossRef CAS.
- M. Malik, M. Wani, S. Al-Thabaiti and R. Shiekh, J. Inclusion Phenom. Macrocyclic Chem., 2014, 78, 15–37 CrossRef CAS.
- L. V. Myznikov, A. Hrabalek and G. I. Koldobskii, Chem. Heterocycl. Compd., 2007, 43, 1–9 CrossRef CAS.
- E. Ruijter, R. Scheffelaar and R. V. Orru, Angew. Chem., Int. Ed., 2011, 50, 6234–6246 CrossRef CAS PubMed.
- E. J. Maginn, Acc. Chem. Res., 2007, 40, 1200–1207 CrossRef CAS PubMed.
- D. R. MacFarlane, M. Forsyth, P. C. Howlett, J. M. Pringle, J. Sun, G. Annat, W. Neil and E. I. Izgorodina, Acc. Chem. Res., 2007, 40, 1165–1173 CrossRef CAS PubMed.
- A. Stark, M. Brehm, M. Brüssel, S. C. Lehmann, A. Pensado, M. Schöppke and B. Kirchner, in Electronic Effects in Organic Chemistry, ed. B. Kirchner, Springer Berlin Heidelberg, 2014, vol. 351, ch. 485, pp. 149–187 Search PubMed.
- W. Shi, K. Damodaran, H. B. Nulwala and D. R. Luebke, Phys. Chem. Chem. Phys., 2012, 14, 15897–15908 RSC.
- A. Hameed, S. A. Ali, A. A. Khan, S. T. Moin, K. M. Khan, J. Hashim, F. Z. Basha and M. I. Malik, RSC Adv., 2014, 4, 64128–64137 RSC.
- C. L. Wang, J. W. Leng and Y. Gao, Int. J. Mol. Sci., 2014, 15, 1284–1299 CrossRef PubMed.
- P. G. M. Wuts and T. W. Greene, Greene's Protective Groups in Organic Synthesis, Wiley, 2006 Search PubMed.
- H. Karlsen, P. H. Songe, L. K. Sunsby, L. C. Hagen, P. Kolsaker and C. Romming, J. Chem. Soc., Perkin Trans. 1, 2001, 497–507 RSC.
- Y. T. Abramenko, A. Ivashchenko, K. Nogaeva and Y. A. Sharanin, Chem. Heterocycl. Compd., 1986, 22, 508–512 CrossRef.
- F. M. Abdelrazek, N. H. Metwally, N. A. Kassab, N. A. Sobhy, P. Metz and A. Jaeger, J. Heterocycl. Chem., 2010, 47, 384–388 CAS.
- R. Casarano, P. A. Pires and O. A. El Seoud, Carbohydr. Polym., 2014, 101, 444–450 CrossRef CAS PubMed.
- M. T. Clough, K. Geyer, P. A. Hunt, J. Mertes and T. Welton, Phys. Chem. Chem. Phys., 2013, 15, 20480–20495 RSC.
- H. Tokuda, K. Hayamizu, K. Ishii, M. A. B. H. Susan and M. Watanabe, J. Phys. Chem. B, 2004, 108, 16593–16600 CrossRef CAS.
- H. Tokuda, K. Hayamizu, K. Ishii, M. A. B. H. Susan and M. Watanabe, J. Phys. Chem. B, 2005, 109, 6103–6110 CrossRef CAS PubMed.
- H. Tokuda, K. Ishii, M. A. B. H. Susan, S. Tsuzuki, K. Hayamizu and M. Watanabe, J. Phys. Chem. B, 2006, 110, 2833–2839 CrossRef CAS PubMed.
- M. J. Frisch, G. W. Trucks, H. B. Schlegel, G. E. Scuseria, M. A. Robb, J. R. Cheeseman, G. Scalmani, V. Barone, B. Mennucci, G. A. Petersson, H. Nakatsuji, M. Caricato, X. Li, H. P. Hratchian, A. F. Izmaylov, J. Bloino, G. Zheng, J. L. Sonnenberg, M. Hada, M. Ehara, K. Toyota, R. Fukuda, J. Hasegawa, M. Ishida, T. Nakajima, Y. Honda, O. Kitao, H. Nakai, T. Vreven, J. A. Montgomery Jr, J. E. Peralta, F. Ogliaro, M. J. Bearpark, J. Heyd, E. N. Brothers, K. N. Kudin, V. N. Staroverov, R. Kobayashi, J. Normand, K. Raghavachari, A. P. Rendell, J. C. Burant, S. S. Iyengar, J. Tomasi, M. Cossi, N. Rega, N. J. Millam, M. Klene, J. E. Knox, J. B. Cross, V. Bakken, C. Adamo, J. Jaramillo, R. Gomperts, R. E. Stratmann, O. Yazyev, A. J. Austin, R. Cammi, C. Pomelli, J. W. Ochterski, R. L. Martin, K. Morokuma, V. G. Zakrzewski, G. A. Voth, P. Salvador, J. J. Dannenberg, S. Dapprich, A. D. Daniels, Ö. Farkas, J. B. Foresman, J. V. Ortiz, J. Cioslowski and D. J. Fox, Gaussian 09, Revision D.01, 2009 Search PubMed.
- W. D. Cornell, P. Cieplak, C. I. Bayly and P. A. Kollmann, J. Am. Chem. Soc., 1993, 115, 9620–9631 CrossRef CAS.
- J. Wang, R. M. Wolf, J. W. Caldwell, P. A. Kollman and D. A. Case, J. Comput. Chem., 2004, 25, 1157–1174 CrossRef CAS PubMed.
- L. Martínez, R. Andrade, E. G. Birgin and J. M. Martínez, J. Comput. Chem., 2009, 30, 2157–2164 CrossRef PubMed.
- D. A. Case, J. T. Berryman, R. M. Betz, D. S. Cerutti, I. T. E. Cheatham, T. A. Darden, R. E. Duke, T. J. Giese, H. Gohlke, A. W. Goetz, N. Homeyer, S. Izadi, P. Janowski, J. Kaus, A. Kovalenko, T. S. Lee, S. LeGrand, T. L. P. Li, R. Luo, B. Madej, K. M. Merz, G. Monard, P. Needham, H. Nguyen, H. T. Nguyen, I. Omelyan, A. Onufriev, D. R. Roe, A. Roitberg, R. Salomon-Ferrer, C. L. Simmerling, W. Smith, J. Swails, R. C. Walker, J. Wang, R. M. Wolf, X. Wu, D. M. York and P. A. Kollman, AMBER, University of California, San Francisco, 2015 Search PubMed.
- W. Humphrey, A. Dalke and K. Schulten, J. Mol. Graphics, 1996, 14, 33–38 CrossRef CAS PubMed.
- G. M. Morris, R. Huey, W. Lindstrom, M. F. Sanner, R. K. Belew, D. S. Goodsell and A. J. Olson, J. Comput. Chem., 2009, 30, 2785–2791 CrossRef CAS PubMed.
- S. Marui, K. Aso, M. Yamaoka and S. Ikeyama, EP Pat., 0 665, 223, 1995.
- S. S. Ghodsinia and B. Akhlaghinia, RSC Adv., 2015, 5, 49849–49860 RSC.
- Z. Du, C. Si, Y. Li, Y. Wang and J. Lu, Int. J. Mol. Sci., 2012, 13, 4696–4703 CrossRef CAS PubMed.
- A. Hameed, A. Anwar, S. Yousaf, K. M. Khan and F. Z. Basha, Eur. J. Chem., 2012, 3, 179–185 CrossRef CAS.
Footnote |
| † Electronic supplementary information (ESI) available: NMR spectra of the synthesized compounds. See DOI: 10.1039/c5ra16075h |
| This journal is © The Royal Society of Chemistry 2015 |